A Dense Stereo Correspondence Algorithm for Hardware Implementation with Enhanced Disparity Selection Lazaros Nalpantidis1, Georgios Ch. Sirakoulis2, and Antonios Gasteratos1 1
Democritus University of Thrace, Department of Production and Management Engineering, GR-67 100 Xanthi, Greece 2 Democritus University of Thrace, Department of Electrical and Computer Engineering, GR-67 100 Xanthi, Greece
[email protected],
[email protected],
[email protected]
Abstract. In this paper an effective, hardware oriented stereo correspondence algorithm, able to produce dense disparity maps of improved fidelity is presented. The proposed algorithm combines rapid execution, simple and straightforward structure as well as comparably high quality of results. These features render it as an ideal candidate for hardware implementation and for real-time applications. The proposed algorithm utilizes the Absolute Differences (AD) as matching cost and aggregates the results inside support windows, assigning Gaussian distributed weights to the support pixels, based on their Euclidean distance. The resulting Disparity Space Image (DSI) is furthered refined by Cellular Automata (CA) acting in all of the three dimensions of the DSI. The algorithm is applied to typical as well as to self-recorded real-life image sets. The disparity maps obtained are presented and quantitatively examined. Keywords: stereoscopic vision, stereo correspondence, cellular automata.
1 Introduction Stereo correspondence remains in the focus of the machine vision community for a few decades [1]. It is implied by the biological finding that two, slightly moved from each other, images of the same scene are enough in order to perceive the depth of the objects depicted. Thus, the importance of stereo correspondence is obvious in the fields of machine vision, virtual reality, robot navigation, Simultaneous Localization and Mapping (SLAM) [2], depth measurements and 3D environment reconstruction [3]. The advances in the field of stereo vision during the recent years are, to a large extent, dominated and guided by the test-bench of Scharstein and Szeliski [4]. Very accurate results have been reported on the corresponding web site [5]. However, the high quality of these results comes most of the times at the expense of computation power and thus processing time. The stereo correspondence methods utilized in order to obtain such accuracy and coverage typically involve some kind of global disparity consideration. This direction, although impressive in terms of results, disregards the need for simple, real-time solutions that would be ideally hardware implementable. Hardware implementations provide high execution speeds and often eliminate the J. Darzentas et al. (Eds.): SETN 2008, LNAI 5138, pp. 365 – 370, 2008. © Springer-Verlag Berlin Heidelberg 2008
366
L. Nalpantidis, G. Ch. Sirakoulis, and A. Gasteratos
need of a dedicated computer. These features are highly appreciated in the case of autonomous robots, where the payload, power consumption, resources management and timing constraints are very strict. However, hardware implementation to be feasible and efficient the utilized algorithm should be simple and parallel in structure avoiding repetitive calculations. This paper presents a stereo correspondence algorithm, able to produce dense disparity maps with satisfactory output fidelity, for most of the practical autonomous behavior cases. The main merit of the proposed algorithm is its simplicity, rendering it as an ideal choice for real-time operations and hardware implementation. AD is utilized as matching cost function since it is the simplest one. The aggregation step is a 2D process performed inside fix-sized square support windows upon a slice of the Disparity Space Image (DSI). The pixels inside each support window are assigned to a Gaussian distributed weight during aggregation. The weight of each pixel is a Gaussian function of its Euclidean distance towards the central pixel of the current window. The resulting aggregated values of the DSI are furthered refined by applying Cellular Automata (CA). Finally, the best disparity value for each pixel is decided by a Winner-Take-All (WTA) selection step. Space, time and even the dynamical variables are discrete in CA [6]. CA comprise a very effective computational tool in simulating physical systems and solving scientific problems, because they can capture the essential features of systems where global behavior arises from the collective effect of simple components which interact locally through simple rules. Moreover, CA can easily be implemented in hardware and deal with image processing problems due to the parallel nature of their structure.
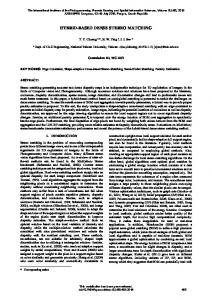
2 Proposed Algorithm The algorithm proposed in this paper follows the structure presented in Fig. 1. The matching cost aggregation step of the proposed algorithm consists of two sub-steps rather than one. In addition, the disparity selection process is a non-iterative one.
Fig. 1. Block diagram of the proposed stereo correspondence algorithm
The results are refined during the aggregation procedure, rather than during an additional final step. This point of view coincides with the authors’ motivation. The key idea is that instead of refining the resulting 2D disparity map, refinement should be performed inside the 3D DSI. Thus, all the available information could be taken into consideration. After all, WTA is a rigid information rejection method, often rejecting useful information as well. This alteration preserves the quality of the produced results while removing any iterative stage from the algorithm’s flow.
A Dense Stereo Correspondence Algorithm for Hardware Implementation
367
The matching cost function utilized is the AD. It is inherently the simplest metric of all, involving only summations and finding absolute values of intensity values.
AD(i, j , d ) =| I l (i, j ) − I r (i, j − d ) |
(1)
where Il and Ir denote the left and right image’s pixel intensity value, d is the value of the disparity under examination and i,j are the coordinates of the pixel. The main merit of AD is the speed of calculations and its potential to be easily hardware implemented. The AD calculated in the previous step comprise the DSI. These results are aggregated inside fix-sized square windows for constant value of disparity. The width of the window plays an important role on the final result. Small windows generally preserve details but suffer from noise, whereas big windows have the inverse behavior. After extensive testing to perform best, the width of the square window is selected to be 11 pixels. However, the AD summation is weighted. Each pixel is assigned a weight w(i,j,d), the value of which results from the 2D Gaussian function of the pixel’s Euclidean distance from the central pixel. The center of the function coincides with the central pixel and has a standard deviation equal to the one third of the distance from the central pixel to the nearest window-border. The Gaussian weight function remains the same for fixed width of the support window. Thus, it can be considered as a fixed mask that can be computed once, and then applied to all the windows. The weighted SAD comprises the DSI:
DSI (i, j , d ) =
11
11
∑ ∑ w(i + μ , j + ν , d ) ⋅ AD(i + μ , j + ν , d )
(2)
μ = −11 ν = −11
The resulting aggregated values of the DSI are furthered refined by applying CA. Two CA transition rules are applied to the DSI. The values of parameters used by them were determined after extensive testing to perform best. The first rule attempts to resolve disparity ambiguities. It checks for excessive consistency of results along the disparity (d) axis and, if necessary, corrects on the perpendicular (i,j) plane. It can be expressed as follows: • if at least one of the two pixels lying from either sides of a pixel across the disparity axis (d) differs from the central pixel less than half of its value, then its value is further aggregated within its 3x3 pixel, constant-disparity neighborhood, ⎡| DSI (i, j , d ) − DSI (i, j , d − 1) | < 1 DSI (i, j , d ) ⎤ 2 ⎥ if ⎢ ⎢or | DSI (i, j , d ) − DSI (i, j , d + 1) |< 1 DSI (i, j , d )⎥ 2 ⎦ ⎣ then DSI (i, j , d ) = 1
1
(3)
1
∑ 9 μ∑ = −1ν = −1
DSI (i, j , d )
The second rule is placed in order to smoothen the results and at the same time to preserve the details. It checks and acts on constant-disparity planes and can be expressed as follows:
368
•
L. Nalpantidis, G. Ch. Sirakoulis, and A. Gasteratos
if there are at least 7 pixels in the 3x3 pixel neighborhood which differ from the central pixel less than half of the central pixel’s value, then the central pixel’s value is scaled down by the factor 1.3 as dictated by exhaustive testing. if | DSI (i + μ , j +ν , d ) − DSI (i, j , d ) |< 1 DSI (i, j, d ) 2
∀ ( μ ,ν ∈ {−1,1} while (ν ≠ 0 ∧ μ ≠ 0)) for at least 7 pixels in the 3 x3 pixel neighborhood
(4)
then DSI (i, j , d ) = 1 DSI (i, j , d ) . 1.3
The two rules are applied once. Their outcome comprises the enhanced DSI that will be used in order the optimum disparity map to be produced. In the last stage the best disparity value for each pixel is decided by a WTA selection procedure. For each image pixel coordinates (i,j) the smaller value is searched for on the d axis and its position is declared to be the pixel’s disparity value. (5)
D(i,j) = arg min DSI(i,j,d) .
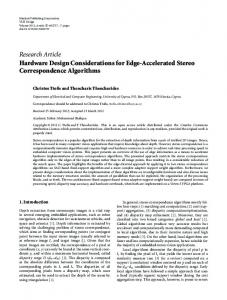
3 Experimental Results The algorithm was applied to standard image sets [4, 7] as well as to self-recorded real-life ones, in order to be evaluated. Results are presented in terms of calculated images in Fig. 2 and quantitative metrics in Table 1. Table 1. Percentage of pixels whose absolute disparity error is greater than 1 in various regions of the images Data Sets Tsukuba Venus Teddy Cones
Non-occluded (%) 10.3 8.86 24.5 20.6
All (%) 12.3 10.2 31.5 28.8
Discontinuities (%) 23.5 35.8 35.2 31.1
Table 2, on the other hand, presents the Normalized Mean Square Error (NMSE) for the calculated disparity maps of the four image sets, for a simplified version of the proposed algorithm, which makes no use of CA, as well as for the complete version of the algorithm. The addition of CA substantially improves the quality as shown from the last column. Table 2. Calculated NMSE for various versions of the algorithm Data Sets Tsukuba Venus Teddy Cones
Normalized Mean Square Error (NMSE) Proposed without CA Proposed with CA 0.0627 0.0593 0.0545 0.0447 0.1149 0.1108 0.0809 0.0768
Improvement (%) 5.42 17.98 3.57 5.07
A Dense Stereo Correspondence Algorithm for Hardware Implementation
(a)
(b)
(c)
(d)
369
(e)
Fig. 2. Results for the Middlebury data sets. From top to bottom: the Tsukuba, Venus, Teddy and Cones images From left to right: the reference (left) images (a), the provided ground truth disparity maps (b), the disparity maps calculated by the proposed method (c), maps of signed disparity error (d), and maps of pixels with absolute computed disparity error bigger than 1 (e).
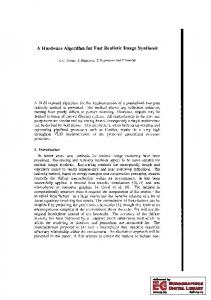
The proposed algorithm was also applied to two self-recorded non synthetic stereo pairs, as well. The stereo pairs and the calculated disparity maps are presented in Fig. 3.
Fig. 3. Self-recorded scenes. (a) outdoor scene, (b) indoor scene. From left to right: left image, right image, calculated disparity map.
370
L. Nalpantidis, G. Ch. Sirakoulis, and A. Gasteratos
4 Conclusions The proposed algorithm exhibits satisfactory performance despite its simple structure. Gaussian weighted aggregation and CA refinement inside the DSI have been proven to comprise an effective computational combination. Disparity maps of standard image sets, as well as of self-recorded ones are calculated. The data show that the proposed algorithm is in the right direction for a hardware implementable, real-time solution. However, the quality of the results could be further improved by refining further the applied CA rules. The possibilities concerning the nature and the number of the applied CA rules are practically endless and the chosen ones, although effective, are only one of those possibilities. The proposed algorithm’s ability to calculate disparity maps of real-life scenes is highly appreciated. Finally, it can be concluded that the algorithm’s serial flow and low complexity combined with the presented satisfactory results render it as an appealing candidate for hardware implementation. Thus, depth calculation could be performed efficiently in real-time by autonomous robotic systems. Acknowledgments. This work is supported by the E.U. funded project View-Finder, FP6-IST-2005-045541.
References 1. Marr, D., Poggio, T.A.: Cooperative Computation of Stereo Disparity. Science 194, 283– 287 (1976) 2. Murray, D., Little, J.J.: Using Real-Time Stereo Vision for Mobile Robot Navigation. Autonomous Robots 8, 161–171 (2000) 3. Jain, R., Kasturi, R., Schunck, B.G.: Machine vision. McGraw-Hill, Inc., New York (1995) 4. Scharstein, D., Szeliski, R.: A Taxonomy and Evaluation of Dense Two-Frame Stereo Correspondence Algorithms. International Journal of Computer Vision 47, 7–42 (2002) 5. http://vision.middlebury.edu/stereo/ 6. von Neumann, J.: Theory of Self-Reproducing Automata. University of Illinois Press, Urbana (1966) 7. Scharstein, D., Szeliski, R.: High-accuracy stereo depth maps using structured light. In: IEEE Computer Society Conference on Computer Vision and Pattern Recognition, vol. 1, pp. 195–202 (2003)