about the selection of a suitable JavaScript development frameworks to support ... Modern home automation system (HAS) architectures are usually distributed ...
Front-End Development for Home Automation Systems - A design approach using JavaScript Frameworks Olaf Droegehorn¹, Marie Leslie Melanie Pittumbur¹, Jari Porras² ¹ Harz University of Applied Sciences, Wernigerode, 38855, Germany ² Lappeenranta University of Technology, Lappeenranta, 53850, Finland Keywords: Home Automation, User Interface Design, Web Application development, User-Centered Design.
Abstract Automation technologies are widely acclaimed to have the potential to significantly reduce energy consumption and energy-related costs in buildings. The energy consumption of buildings represents in average a total of 41% of the energy usage in the European Union (EU) and from this lot, residential buildings accounts for 65.9% of the total energy usage of EU buildings and 27% of the total energy consumption in the EU. However, despite the abundance of commercially available technologies, automation in domestic environments keeps on meeting commercial failures. The main reason for this is the development process that is used to build the automation front-ends, which tend to focus more on technical aspects rather than on the users’ needs. On the other hand, developing a usable and interactive interface is a complicated task for developers due to the heterogeneity of technologies that exist in the system architecture of a Home/Building Automation System. In this paper we recommend the ISO 9241-11 (Guidance on usability, ISO/IEC 1998) standardized User Centered Design (UCD) approach as a design method for developing a user interface that meets user-, usability- and system requirements. Based on this approach a set of design guidelines are proposed to help developers solving the multi-disciplinary design challenges that are involved in this development process. A home energy management functionality for a Web-based home automation front-end has been developed as a proof-of-concept for this approach. In addition, due to a lack of recommendations to assist developers in making an informed decision about the selection of a suitable JavaScript development frameworks to support the development of the front-end, a list of selection criteria is given. Finally, a user evaluation of the interface is proposed to assess the suitability of the User-Centered Design method for producing more usable and satisfying interfaces.
I. INTRODUCTION The primary purpose of building automation systems (BAS) is to achieve cost and energy efficiency in operating building spaces through the automatic and remote control of indoor environmental conditions by regulating the heating, air-conditional, ventilation and lightning systems of buildings through the deployment of interconnected sensors and actuating devices. Home automation system (HAS) is a smaller specialization of BAS where besides optimizing energy consumption, the comfort and peace of mind of the home inhabitants are the main priorities. In recent years, reducing energy consumption in buildings has gained increased interest amongst researchers due to the growing global awareness about the need to achieve long-term environmental sustainability and also because of the numerous national legislations being approved to reduce CO2 emissions. According to the European Commission, buildings account for 40% of energy consumption and 36% of CO2 emissions in the EU. The European Commission estimates that
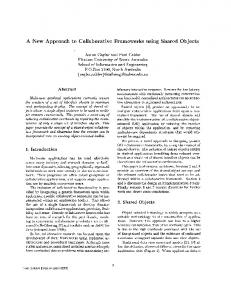
by using proven and commercially available automation products in buildings, it is possible to reduce the total EU energy consumption by 5% to 6% and the EU CO2 emissions by about 5% (EC, 2016). However, despite the wide availability of home automation technologies for many years now, a significant number of repeated commercial failures have been noted and the reluctance of customers to invest into these technologies still remains relatively high. Many reasons have been proposed to explain this phenomenon and the main ones include: high investment cost, lack of flexibility and scalability to adapt to new technologies, the diverse availability of products that are not compatible with one another and last but not least, the low usability of HAS technologies. The front-end of the automation system is often reported to be the most unusable product due to its poor design and complex features which result in home automation technologies being inaccessible to a wide range of non-technical users. A. Background Modern home automation system (HAS) architectures are usually distributed across a three-level hierarchy (shown in Figure 1) namely: a field level, an automation level and a management level (Droegehorn, 2016). Applications aggregate entire system’s data for Management
Automation
Field
user visualization and control. Sensor data are processed and action is taken according to automation rules. Data are collected from sensors and commands sent to actuators.
Figure 1: The typical architecture and type of functionalities associated with each level for a HAS (Droegehorn, 2016)
Currently there is no single standard technology that covers all the three levels of the architecture and as a result heterogeneous technologies and design solutions have proliferated with no standard principles for interoperability. This greatly affects the development of a management-level application such as a visualization and control user interface as each technology comes with its own data representation that is tightly coupled to its internal requirements. Since it is difficult to integrate all these sources of data into a single information model it becomes complicated for engineers to build a good and universal user interface for the HAS. In the domain of Human-Computer Interaction (HCI), the usability of an interface is usually determined by four factors which include: efficiency, effectiveness, satisfaction and adaptability of the interface to its context of use (Usabilitiy2006). In order to build a usable interface, the HCI designers strive to apply numerous design methods and techniques to get a thorough understanding of the explicit and implicit context of use of the interface. This entails understanding 1) the user group for which the interface is designed for, 2) the goals and tasks that the typical users want to achieve when using the interface and 3) the external physical, social or economic factors that may affect the use of the interface. Furthermore, evaluating the usability of a product is a proven technique for measuring the quality of the user experience (Eggen 2014). B. Statement Of Problem Considering that building a user-friendly, interactive and multi-target interface for a home automation application is a multi-disciplinary task, the development process for developers and designers, especially from the open source community, is a very complicated, time-consuming and very often not successful task as there is a lack of definitive design guidelines for the front-end development in HAS. In this context, the current research work is undertaken in order to investigate the design challenges that exist in the three distinct domain areas that are involved in this task, that is: home/building automation, HCI design and user-focused design approaches. The suitability of the UCD approach to
enable developers to include user, usability and system requirements into their development process, is assessed. The outcomes of the research include a set of design challenges and guidelines that should help developers understand the existing issues and create a more user-friendly, interactive and responsive UI for HAS.
II. LITERATURE REVIEW In order to gain a holistic understanding of the different aspects involved in the home automation interface development, the approach proposed by (Saizmaa 2008) to carry out such a research work was taken. In the context of smart homes, the paper demonstrated that any holistic development work for smart home applications should be based on the relationship between its three main dimensions which consist of home, human and technology. From the home/technology perspective, one of the main technology-related problems that HAS application developers focus on is the interoperability of the heterogeneous automation technologies. According to (Granzer 2012), these diverse technologies and protocols have caused a problem of integration at the information level due the lack of interoperability of their data representation of devices and building layouts. The lack of interoperability in data description mechanisms makes it difficult to integrate different sources of information at the management level which in turn affects the development of high-level applications to process, visualize and control the entire automation system. From the Human/Technology perspective, the main challenges involved in the UI development are mostly concerned with concepts that involve usability and acceptability of the interface from the user point of view and the social consequences that may arise from this interaction (Saizmaa, 2008). The international standard ISO 9241-11 (Guidance on usability, ISO/IEC 1998) defines the usability of a product as “the extent to which it can be used by specified users to achieve specified goals with effectiveness, efficiency and satisfaction in a specified context of use”, (Usability, 2006). Beyond these usability evaluation guidelines, other quality factors may affect the experience that users can derive from using the interface and this includes for instance aspects involving the learnability of the interface and the motivation that users express to explore advanced features of the product (Ceccacci, 2013). It is further argued that considering the social and emotional aspects of the interaction with the interface can play a major role in the willingness of the users to integrate the use of the technology into their daily lives without being intrusive (Saizmaa, 2008). The literature review revealed that the usability problems of an interface for HAS can be clustered into 4 main problems, described below. The first one is the need for users to manage different visualization and control interfaces due to the heterogeneous technologies in HAS (Penner, 2002, Brush, 2011). Different interfaces for each technology means that the interface styles and interaction designs may also differ from product to product making it difficult for the users to learn how to use and manage (Brush, 2011). Secondly, the ability of users to understand and configure customized automation solutions that meet their needs is also identified as a major design requirement (Mennicken, 2014). This is because end-user configurability enables users to derive benefits from automation technologies by for instance automating energy demanding tasks for low fare times of the day. In order to make end-user configurability user-friendly, using metaphors that are familiar to users were proposed. As an example, using temporal metaphors such as clocks and calendars instead of typing in commands can make user-defined automation more user-friendly (Mennicken, 2014). The third usability problem arises due to the different mobile computing devices that are now used to access information and carry out tasks. These devices have different hardware specifications and therefore require the application interface to be responsive and adapt to the new hardware context such as the screen resolution while having to maintain a good user experience. These types of multitarget front-end are called plastic interfaces (Calvary, 2003) and they require an adaptation
functionality that detects the change in context of use and responds by changing the presentation layouts. Finally, the last main usability problem that HAS UIs have is the inability to provide information and functionalities that are relevant to the users (Eggen, 2014, Brush, 2011, Takayama, 2012). An example of this problem is the lack of an energy management feature on the interface. Implementing an energy management system through the interface is a powerful mean to help users apply to achieve energy and economic savings as it can assist users become aware of their energy consumption habits, identify sources of energy wastes in the home and configure automation scenarios that reduce consumption (Banerjee, 2011). Several research works adopted a user-focused research approach to understand the needs and limitations of the users to optimize the design of the UI (Eggen, 2014, Ceccacci, 2013). According to (Takayama, 2012) a good product design for HAS should satisfy users in three main ways. First the product should be designed so that it is useful for the users. Secondly it should allow users to easily and effectively perform tasks and finally a good product design helps users derive meaning and positive emotional significance from its use. Over the past decade, the popularity of JavaScript programming language for web application development has incessantly increased because it solves the problem of cross-platform compatibility. Other important features that JavaScript frameworks offer for a front-end development are the user interface (UI) and user experience (UX) features such as animations and different CSS templates for different screen resolutions when using responsive designing. All these interactive features give the means to developers to enhance the usability and user experience of an interface (Heitkötter, 2013).
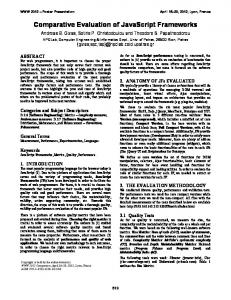
III. RESEARCH METHOD The method utilized in this research work was the analytical-based Qualitative Data Analysis approach. By analyzing existing research works and existing interfaces to produce meaningful design requirements and design guidelines this could lead to more usable, acceptable and satisfying designs. The aim of undertaking a QDA research approach for the context of this project was to gain useful insights and draw out patterns about the existing recurring design problems that UI developers face as well as the existing solutions and best practices that they apply to build good and usable interface for home automation applications. In the design and development of the home automation interface the five main stages of the design process (shown also in Figure 2) are included. 1. Data Collection: Document Review, Literature study and Analysis of existing interfaces 2. Qualitative Analysis: Open Coding with QDAMiner 3. Requirements Specification: Home Energy Management Scenario 4. Prototyping: Low Fidelity Prototype + Heuristics Evaluation 5. Final Interface: Front-end JavaScript Framework BootStrap + User Evaluation for Usability
Figure 2: Design stages for the user interface using the QDA approach
A. Data Collection The data collection process was carried out by using the investigative methods of literature study, document review and analysis of existing interfaces so as to examine what had already been found out in previous works. The document review and the literature study focused primarily on research works that were user-centered or directly involved users in their research and investigated the challenges and implications of deploying and using automation technologies in the domestic environment. Research works that also investigated domain-specific system challenges and solutions as well as usability concepts were included in the data collection process.
The ISO 9241-11 standard (Usability, 2006) defines the context of use as the “users, tasks, equipment and the physical and social environmental factors in which a product is used”. Therefore the data collection process sought to answer questions about these three main dimensions and a set of questions to address these concerns were used as guidelines in order to systematically collect data from the existing research papers and to avoid subjective interpretation. The data collection process was broken down into six main parts: 1. The first part was to define the users of the application which consisted in finding out the characteristics of the typical or stereotype user group for which the application is intended. 2. The second part was to define the user tasks which should cover requirements concerning mainly the tasks the users need and wish to achieve, the user goals behind the task carried out, the frequency of the tasks, the results users expect from executing the task and the importance of the task to the users. 3. The definition of the physical and social environmental factors was the third part which tried to define the additional resources such as hardware and software resources in which the interface is expected to work in the real world. 4. In addition to the above set of requirements, since the aim of this work is to improve the user experience when interacting with a product, it was also important to cover usability and other quality design aspects in the data collection. 5. Additional literature study was carried out to capture the functional requirements specific to the domain of home and building automation systems for the development of high-level applications that include automation and supervisory interfaces. 6. For the analysis of the existing products, successful designs of other products were analysed so as to draw out best practices that can be reapplied for the context of this work. The key features of the interface found to be relevant for the prototype design are noted down and a set of lessons learnt are derived to further help in the later stages of the process. B. Qualitative Analysis of Data The qualitative analysis was done using an inductive approach and an open coding technique whereby recurring topics in the research papers and documents were identified and used to cluster data of similar nature under a common theme. In the context of this current research, the documented design problems and existing design solutions were grouped under common themes which related to a specific design aspect of the home automation user interface. The analysis of the collected data was done using the free version of QDAMiner (https://provalisresearch.com/). In QDAMiner a code group category clustered data related to a particular design aspect of the interface. The group category is referred to as a theme. A group category could consist of several more detailed colored codes, referred to as subthemes, that related to a more specific design aspect of the interface. Therefore, a group category or a theme had a set of codes or subthemes. A subtheme in turn grouped together a set of design problems. A subtheme was also associated with a set of design solutions. Furthermore, for each subtheme a set of requirements were derived.
Figure 3: Overview of the coding and clustering process used in the analysis stage
Figure 3 shows the different relationships between the themes, subthemes, design problems, design solutions and citations of sources. The direction of reading is from the flat to the pointed end of the arrow. The analysis of the data collected led to the creation of eight main categories or themes. For each main theme a number of subthemes were broken down as the data collected referred to a more detailed design aspect of that theme. A break down and description of three of the themes and subthemes used for the coding process of the data collected is shown below:
Information o Analytics: Computation of information, making queries on data, viewing time-based data o data_aggregation: Data from different sources are used to compute more complex information o information_view: The visualisation and presentation of data and information
Interface o interface_reusability: Using the same interface for different home automation systems o interface_interoperability: Compatibility with different technologies, data sets or data sources o web_services: Provide data from external web services to the user from the interface o basic_features: What are the basic tasks that the interface should offer o interface_view: The visualisation and presentation aspects of the interface o data_representation: how data from different technologies is represented on screen o interface_adaptibility: The ability of the interface to adapt to different contexts of use o interface_learnability: The intuitiveness of the interface o desired_features: Tasks that users wished to be able to perform on the interface o advanced_features: More complex tasks that can be performed on the interface
Interaction o interaction_acceptability: Techniques to make the interaction more acceptable for the user o interaction_ease_of_use: Techniques to make the interaction easy for the user to use the application o interaction_generic: Using same interaction techniques and abstractions to interact with devices using different technologies o multi_tasking: Techniques to allow users to switch from one task to another
IV. IMPLEMENTATION The following section details the steps taken in the implementation of the proof-of-concept for home automation interface which was built to meet the functional, usability and user requirements based on the following target groups. The ultimate aim was to assess the validity of the derived requirements for building a good, usable and responsive home automation interface. A. User groups of home automation The qualitative analysis of data allowed the identification of two distinct and main groups of home automation users. The first group consisted of early technology adopters who had extensive knowledge and experience in using automation applications. The second group consisted of users who did not have a technical background and had to interact with the HAS mainly because of living together with the early adopters. A summary of the main user characteristics is shown below: Description of Persona 1:
o Young to middle aged o Leader of the family o Considered to be a technology guru or specialist who is responsible for HAS management, configuration and troubleshooting o Has deep technical expertise in engineering-related or IT-related profession and thus is able to tinker with home automation o Primary user of the HAS o Wants peace of mind by connecting to HAS to check on the status of the home o Wants to show off the capabilities of the HAS to guests o Wants to implement complex automation scenarios o Gets tired of using the HAS after many years of tinkering and fixing the HAS and thus wants an easier way to manage system Description of Persona 2: o Young to middle aged o No or little technical or programming background o Passive user of technology who does not actively engage in using or configuring or managing the HAS o Is able to use web-based interfaces and modern applications on mobile devices o Wants convenience by automating boring and complex tasks o Wants peace of mind by connecting to HAS to check on the status of the home o Wants to achieve cost and energy savings o Be able to view useful and non-technical information on the interface o Wants to efficiently carry out tasks that do not involve typing in commands o Does not like to feel humiliated by not being able to understand how to carry out a task o Does not like to feel humiliated by feeling like not having any control over the HAS B. Home Energy Management scenario Due to the wide scope of the user needs and tasks, system and usability functionalities collected from the data collection process, it was necessary to define a specific scenario for the implementation of the proof-of-concept. The scenario selected was to incorporate a home energy management feature in the HAS front-end to help users become aware of their energy consumption habits and motivate them to decrease their power consumption by making use of the automation features of the HAS and by displaying the resulting economic savings and the increased sustainability effect of their initiatives. The selection criteria for the requirements to be considered for the implementation of the proof-ofconcept to be built later are laid out as follows. The requirement was selected if it matched either of the following criteria:
Criteria 1: Requirement that focuses on user experience, usability, interactivity and/or responsiveness Criteria 2: Requirement that focused on user experience, usability Criteria 3: Requirement that focused on the needs, expectations or limitations of the users. Criteria 4: Requirement that was related to managing the energy consumption in the home using the HAS
The table below shows the requirements selected for the implementation of the proof-of-concept and the subsequent design decisions taken in order to fulfill the requirements. Requirements Visualization of the past, present and future automation events.
Design decisions A table component was used to display past, current and upcoming automation tasks.
Centralized access to the HAS from different end-devices. Using friendly metaphors to describe the behavior and state of the home. Queries and display analysis of power and energy consumption. Aggregate data into useful information Notify users of upcoming automation tasks. Generate notifications for alerts. Suggestions for more energy-efficient operation of devices. A single user interface that adapts to different screen sizes. Maintaining the same user experience on different devices.
The interface was implemented as a web-based client application. Use of graphics such as mimics and charts to display information about the HAS status. Changing the color of information displayed to intuitively convey the state of the value. Trend charts were used to display energy consumption over time. Bar charts and Pie charts were used to compare energy consumption by different devices. Gauges are used to indicate normal or excessive energy consumption to users Displaying of total home energy consumption. Computing the cost savings and carbon footprint and other meaningful information for the user. A table component was used to display upcoming automation events with the possibility for the user to cancel it. A table component was used to display current and past alerts. Different colors were used to convey importance of the alert to the user. A section of the dashboard was dedicated to an energy management tips and advices section. Bootstrap responsive grid layout was used to design the interface so that the UI automatically resized depending on the resolution of the device being used. Media queries and media content of different resolution were used to change the appearance of the UI so as to maintain its readability, ease of use and good user experience.
Table 1: Requirements selected and design decisions taken for the implementation of the home energy management proof-of-concept
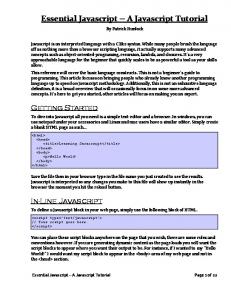
C. Prototyping The template layout of a dashboard was used for the design of the energy management for the current home automation interface as it was found in the previous stages of the development cycle that it was an efficient and user-friendly way of conveying and analyzing a large amount of numerical and statistical information to users of an interface application. Two mock-ups were created in order to decide on the general layout of the interface for two different sets of devices, that is, for screen resolutions greater than 992px usually used by mediasized and large laptops and desktops and for screen resolutions smaller than 768px which is used usually employed by mobile phones and tablets of up to 9 inches. The initial mock-ups were evaluated with a set of three users using a set of heuristic principles introduced by (Eggen, 2014) for evaluating the usability of interfaces. The following heuristics were used to evaluate the prototypes: Visibility of system status: Providing appropriate visual feedback and timely use of interactive UI features. Match between system and the real world: Avoiding the use of technical language and using metaphors that are understood by users. User control and freedom: Using simple interaction steps to facilitate navigation throughout the interface. Consistency and standards: Ensuring that the layout, UI components, metaphors and look-andfeel of the interface are consistent and standard. Recognition rather than recall: Helping the user to build a mental map of the interface by using familiar metaphors to minimise their need to memorise details. Flexibility and efficiency of use: Adapting layout of interface and using interaction techniques that help users to efficiently carry out tasks. Aesthetic and minimalist design: Minimising superfluous details and excessive text content. D. Final Home Automation Interface Due to its popularity for building responsive front-end applications Bootstrap was selected for developing the home automation interface. Besides Bootstrap the Harp.js workflow was used to make the development process even more easy as it included some advanced development tools for instance for the automatic compiled into HTML, CSS and JavaScript and fed to the web browser to display the interface. This makes the use of template files for the general layouts of several web pages easier, faster, more maintainable and reusable for other applications. Figure 4(a) below shows the implementation of the Charts section using interactive and UX
enhanced components in order to convey meaningful information to the user while minimizing the use of text content. Figure 4(b) shows result of using responsive web designing through the implementation of media queries so as to optimize the layout of the interface to the current screen resolution of the device being used. For instance, shown in Figure 4(a) and 4(b) is the sidebar which was made available for screen resolution larger than 768px and replaced by a navigation pill of list of links for resolutions smaller than 768px.
Figure 4(a): Charts, using interactive and UX enhanced components
Figure 4(b): Use of responsive Web Design
E. User Evalutation of Final Interface A set of tasks were selected in order to evaluate the different usability aspects of the final HAS interface. The four tasks assigned for the evaluation were the following:
T1 - Find out the current total energy consumption of your home and whether it is within normal values T2 - Find out the current energy consumption of all the lightning systems in the home and whether or not you are within your targeted limit. T3 - Which is the device in the home that is consuming the most energy at the moment? T4 - How much cost savings or additional expenses are you incurring at the moment?
The usability tests involved a user group consisting of 8 participants. The users are aged between 18 and 60 years old and are all familiar with using web browsers and web applications on the PC as well as on mobile devices. Out of the 8 people, 4 people have technical background and programming knowledge for the case of high-skilled users and the remaining 4 users were selected on the criteria of having no technical or programming background but who are familiar with using PCs and mobile phones for the case of low skilled users. The usability tests involved users filling a questionnaire in order to evaluate their perceived experience out of interacting with the interface in order to carry out the tasks assigned. The satisfaction level experienced by the users was then evaluated against a 5-points Likert scale ranging from ‘highly satisfied’ to ‘Very Unsatisfied’ with a questionnaire. Usability aspect under test Effectiveness Efficiency Satisfaction
Evaluation metrics for usability aspect Did you succeed in completing the task? Was the time taken to complete the task acceptable for you? Assess the interface's ease of use in order to achieve this task Assess the interface's learnability, that is, how easy it was the first time to learn how to achieve the task. Assess your understanding of how the task could be achieved. Assess the organisation of information and menu Assess the usefulness of information displayed Assess the usefulness of the features available Readability of contents on mobile device Navigability of interface on mobile device Maintainability of experience when interface adapts to different screen resolutions Satisfaction about knowing what is going on in the home automation system Satisfaction about the usefulness of the energy management system to reduce power consumption
Table 2: The experimental procedure used for the usability tests of the HAS interface, adapted from (Saizmaa, 2008)
To ease answering the questionnaire, an explanation of the Likert scale was given to them: Very Satisfied - The feature met your expectations and made you derive positive feelings. Satisfied - The feature could be further improved to meet your expectations but it was satisfactory enough. Not so satisfied - The feature has to be improved in order to make it easier and more acceptable to use. Not Satisfied - The feature did not meet your expectations, it was not easy to use. Very Unsatisfied - Besides not meeting your expectations and its lack of usability, the UI feature made you derive strong negative feelings.
V. RESULTS The success rate of the four tasks (T1 - T4) assigned to the users for the home automation interface developed in this design process was 100% which showed that the interface proved to be usable for users. For the tasks T1-T4, the results showed that the majority of the users responded positively (Very Satisfied and Satisfied) for the use of the different interactive UI features: use of charts to display statistical data or the use of widgets to display key analytical data. The results obtained also showed that the majority of them felt the use of these UI elements improved the ease of use and learnability of the interface while making the access to the information very fast. However, a number of 3 users, all of them belonging to the high skilled user group, felt that the appearance and functionality of the gauge chart UI element to display the total home energy consumption could be improved in order to make users understand the functionality of this feature better.
T1 - Find out the current total energy consumption of your home and whether it is within normal values understandability of task achievement learnability ease of use time taken task success 0 Very Unsatisfied
Not Satisfied
1
2 Not so Satisfied
3
4
5
Satisfied
Very Satisfied
6
Figure 5: Evaluation results of the first task
Figure 5 shows the results obtained for the task T1 which consisted in finding out the total home energy consumption that was displayed using a gauge chart UI component, see Figure 4(a). The results of the evaluation of the satisfaction derived by the users when using the dashboard themed interface for the home energy management functionality are shown in the Figure 6 below.
New Home Automation Interface Column2 Usefulness of the energy management Awareness of HAS status Experience on different screen resolutions Readability on mobile device Usefulness of features Usefulness of information Organisation 0 Very Unsatisfied
Not Satisfied
1
2
3
Not so Satisfied
4 Satisfied
5
6
7
8
Very Satisfied
Figure 6: Results of the satisfaction level of different aspects of the new home automation interface
It shows that the majority of the participants felt that the current interface designed was usable enough and provided meaningful and useful features to them. Some design aspects concerning the experience of using the interface on different devices, the readability of the interface content on mobile devices and the organization of the information and UI components could be improved to further enhance the user experience.
VI. Discussion The QDA approach to collect data from the multiple disciplines involved in the development of a home automation application proved to be suitable. This claim was supported by the results of the evaluation of the final interface developed which showed that applying a holistic approach to this design task produced a good, usable, responsive and interactive interface from the users’ perspectives. Taking into consideration the positive results of the evaluation of the home automation interface designed and developed from the requirements derived from the data collected and analyzed using the QDA approach, a set of design guidelines were shortlisted and proposed to help developers build home automation applications that meet user, usability and functional requirements of automation systems: 1.
Having a universal, reusable and technology independent interface makes it easier for Endusers to understand the UI
2.
The different interfaces of the HAS have different layouts and interaction styles for each different manufacturer’s brand of device
3.
Display meaningful information by making sense of the large amount of sensor data
4.
Technical metaphors and descriptions are very often used in the interface
5.
Users should be able to personalize the HAS and to adjust the scheduling and customization of automation tasks as well as specifying the level of autonomy to be delegated to the system
6.
Users are frustrated by the complexity of the interaction with the device
7.
Different device interfaces and control systems add to the cost of ownership
8.
The ease of use should be increased to make it faster to learn about the interface
9.
Satisfaction from acceptability of the interface from the users’ point of view
10. The interface should be able to adapt to different end-target devices These guidelines are crucial for designing an effective user-interface for HAS systems that is usable, and leads most probably to an increased uptake of those technologies.
VII. CONCLUSION This paper presented the Qualitative Data Analysis design approach to design a user-friendly, interactive and responsive user interface for a home automation system. The outcomes of the document review and literature study done at the data collection stage of the QDA confirmed the idea that developing a UI for a HAS was a multi-disciplinary task that involved the automation field, the HCI field and on the user-centered study field. Therefore, applying a design methodology that incorporated the design challenges and requirements from all these research areas was important to build a good interface. Developing prototypes that were evaluated through heuristics analysis tests ensured that usability problems could be caught during the early stages of the development process and that the design of the final interface was already improved and validated at an early stage by the users directly. Finally, the experience that users can derive from using the interface can be evaluated by measuring the success rate and satisfaction level when conducting a set of tasks on the final interface. The choice of the home energy scenario exemplified the contribution that home automation technologies could bring to increase awareness amongst people about their energy consumption habits. It was argued that the more usable the home automation interface was, the more users were going to be motivated to use it into their everyday lives to achieve cost and energy savings. ACKNOWLEDGEMENTS This research was fully supported and funded by the PERCCOM Erasmus Mundus Program (Klimakova, 2016) of the European Union. We would also like to express our gratitude and thanks to all the partner institutions: Université de Lorraine, Lappeenranta University of Technology and Luleå University of Technology, sponsors and researchers of PERCCOM program for their support and insights when conducting this research work. REFERENCES EC
(2016), European Commission, 22 May 2016-last update, Energy, Buildings. Available: https://ec.europa.eu/energy/en/topics/energy-efficiency/buildings Eggen, B., van den Hoven, E., Terken, J., (2014) "Human-Centered Design and Smart Homes: How to Study and Design for the Home Experience?" Living Reference Work Entry: Handbook of Smart Homes, Health Care and Well-Being, pp. 1-9 Saizmaa, T., Kim, H., (2008) "A holistic understanding of HCI perspectives on smart home", pp. 59-65. Granzer, W., Kastner, W., (2012) "Information modeling in heterogeneous building automation systems," in Factory Communication Systems (WFCS), 2012 9th IEEE International Workshop On, pp. 291-300. Weng, T., Nwokafor, A., Agarwal, Y., (2013) "BuildingDepot 2.0: An integrated management system for building analysis and control," in Proceedings of the 5th ACM Workshop on Embedded Systems for Energy-Efficient Buildings, Roma, Italy, pp. 7:1-7:8. Usabilitynet (2006), January 2006-last update, International standards for HCI and usability. Available: http://www.usabilitynet.org/tools/r_international.htm (2016, March) Ceccacci, S., Germani, M. , Mengoni, M., (2013) "A Method to Design a Smart Home Interface," Smart Product Engineering: Proceedings of the 23rd CIRP Design Conference, Bochum, Germany, March 11th - 13th, pp. 915-925 Penner, R., Steinmetz, E., (2002) "Model-based automation of the design of user interfaces to digital control systems," Systems, Man and Cybernetics, Part A: Systems and Humans, IEEE Transactions On, vol. 32, pp. 41-49 Brush, A., Lee, B., Mahajan, R., Agarwal, S., Saroiu, S., Dixon, C., (2011) "Home automation in the wild: Challenges and opportunities," in Proceedings of the SIGCHI Conference on Human Factors in Computing Systems, Vancouver, BC, Canada, pp. 2115-2124 Mennicken, S., Hofer, J., Dey, A., Huang, E., (2014) "Casalendar: A temporal interface for automated homes," in CHI '14 Extended Abstracts on Human Factors in Computing Systems, Toronto, Ontario, Canada, pp. 2161-2166 Calvary, G., Coutaz, J., Thevenin, D., Limbourg, Q., Bouillon, L., Vanderdonckt, J., (2003) "A Unifying Reference Framework for multi-target user interfaces," Interact Comput, vol. 15, pp. 289-308 Takayama, L., Pantofaru, C., Robson, D., Soto, B., Barry, M., (2012) "Making technology homey: Finding sources of satisfaction and meaning in home automation," in Proceedings of the 2012 ACM Conference on Ubiquitous Computing, Pittsburgh, Pennsylvania, pp. 511-520 Banerjee, N., Rollins, S., Moran, K., (2011) "Automating energy management in green homes," in Proceedings of the 2Nd ACM SIGCOMM Workshop on Home Networks, Toronto, Ontario, Canada, pp. 19-24 Lennon, J., Compare JavaScript Frameworks: An overview of the frameworks that greatly enhance JavaScript development. Heitkötter, H., Majchrzak, T. A., Ruland, B., Weber, T., (2013) "Evaluating frameworks for creating mobile web apps," in 2013, pp. 209-221
Nielsen, J., Molich, R., (1990) "Heuristic evaluation of user interfaces," in Proceedings of the SIGCHI Conference on Human Factors in Computing Systems, pp. 249-256 Syromiatnikov, A., Weyns, D., (2014) "A journey through the land of model-view-design patterns," in Software Architecture (WICSA), 2014 IEEE/IFIP Conference On, pp. 21-30 Klimova, A., Rondeau, E., Andersson, K., Porras, J., Rybin, A., Zaslavsky, A., (2016) "An international Master's program in green ICT as a contribution to sustainable development," J. Clean. Prod. Drögehorn, O., Porras, J., Sangogboye, F., (2016) “HomeAutomation - Using OpenSource to fulfill EU-Directives - “, Proc. of the 17th International Conference on Internet Computing; LasVegas Nevada, USA