Keywords: HEP analysis optimization, DSVQL, Domain specific Visual Query ... the field do not always agree in relevant matters concerning the analysis ...
A Domain Specific Visual Query Language for High Energy physicists Vasco Amaral, Sven Helmer, Guido Moerkotte Fakult¨at f¨ur Mathematik und Informatik Universit¨at Mannheim {amaral,helmer,moer}@pi3.informatik.uni-mannheim.de Abstract— This paper presents Pheasant, a framework for analyzing data collected during high energy physics experiments. Our approach features a visual query language especially adapted to the needs of the physicists analyzing the data. We also provide interfaces to the currently applied tools, so that users can still do the same work as before, but on a higher level of abstraction. This helps users to concentrate on their actual job by hiding the intricacies. Although Pheasant is domain-specific, we introduce enough extensibility to enable it to meet future demands. Keywords: HEP analysis optimization, DSVQL, Domain specific Visual Query languages
I. I NTRODUCTION
The process of manipulating analysis data in high energy physics (HEP) experiments is a time consuming and cumbersome chore. Although many different tools exist, most of them were written for a specifical purpose in an ad-hoc manner and then extended and patched to meet growing and changing demands. Consequently, using these tools makes the analyzing process unnecessarily complex – by times even cumbersome – because users need a lot of knowledge about the intrinsics. For example, users are forced to combine disperse utility libraries that follow different programming paradigms (procedural, object-oriented, etc.). Usually learning the different programming languages for the various tools is the first obstacle. However, improper programming styles will have a direct impact on the quality of the resulting code in terms of understandability and efficiency. Furthermore, presently there is a lack of transparency, i.e. users have to know the physical layout of the data. Having to learn many details that are completely unrelated to physics distracts the scientists from their real work. This motivated us to develop a prototype of a framework tailored to the needs of physicists analyzing experimental data, giving us the chance to learn about the domain. Physics analysis in this environment is complex and takes deep physics knowledge to fully understand the process. The multiplicity of library tools available together with the lack of proper documentation implies a difficult engineering task while looking for a solution for this environment. The experts in the field do not always agree in relevant matters concerning the analysis requirements, so as a first step we had to conduct a requirements analysis to determine the demands as thoroughly as possible. Having done this we proceeded by modeling the environment in which our framework would be employed. In developing the framework, we had to keep important requisites in mind. The main goal was to significantly reduce the programming and other non-physics related effort of the user. For that reason we decided to supply a simple-to-use interface in the form of a visual query language (VQL). In this way allow the use of the current tools, albeit on a more abstract level. The results of our efforts is Pheasant, a framework for analyzing data from HEP experiments. Our achievement goes beyond mere theoretical thoughts on the subject, as we have implemented a prototype of the framework that will soon be tested by physicists involved in the HERA-B experiment at DESY1 . In the following section, we will give a brief description of high energy physics and its requirements concerning an analysis framework. Section III.discusses visual query languages in the context of physics and covers related work. In Section IV., the main focus of this paper, we describe the basis of our data model and the visual query language. We also take a quick glance at implementation aspects in Section V.In Section VI.we give a summary and an outlook. 1
Deutsches Elektronen Synchroton in Hamburg
II. A S HORT OVERVIEW
ON
H IGH E NERGY P HYSICS (HEP)
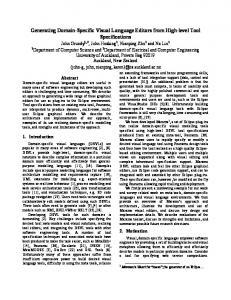
An in depth review of HEP is beyound the scope of this paper. A good introduction to the subject can be found in [16] and [15]. Generally speaking, physicists discover new, short-lived particles and their properties in order to develop a model of the real world at a subatomic level. Using large accelerators in which particles are brouth into collision. They do this with the help of large accelerators in which particles collide with other particles. An accelerator supplies the particles, which are grouped into bunches, with energy taking them close to the speed of light. As soon as the system stabilizes, a period of data acquisition, a so called run begins. The time span during which two bunches collide is called an event. Large detectors record the results of these events. Unfortunately,in any currentbig experiment like LHC[23],CDF[24],HERA-B[22], it is technically infeasible to gather all information of all collisions (due to the sheer volume of data), so the physicists filter the data with several levels of triggers. The resulting data is initially stored on tape. The reconstruction and investigation of decays and decay chains of short-lived particles is one of the main tasks of the data analysis after collecting the data. Physicists have to reconstruct segments of the trajectories of particles, match them with other segments to reproduce full tracks, extract further properties and deduce complete decay chains. We were able to identify the major requirements of a HEP analysis framework. They are listed in the following (further reading on the general requirements from the HEP community can be found in [15]): The framework should be flexible. Users should be able to extend it with new algorithms. Furthermore, it should not only allow retrieval of previously stored objects, but should be able to compute new objects to represent a decay chain more precisely. • Physicists describe the results of their analysis statistically, so the output of our framework should support several types of histogramming. • Queries can be computationally expensive. So the framework should not just translate queries in a straightforward fashion, but also be able to optimize the queries. For example, intermediate results that are used repeatedly can be cached and we can exploit the fact that we have almost exclusively read accesses. • At the moment, many different frameworks are used to analyze the data from different experiments (for some examples, see the lower part of figure 1, more technical details can be found in [1]). This makes the lives of physicists unnecessarily difficult, as the users are rarely experienced IT professionals. •
VQL Pheasant g1 g2 g3 g4 g5
Fortran
C++
C,C++,Fortran
C++
SQL
PAW
ROOT
ARTE
BEE
relational database
Figure 1: Unified framework
Our goal is to provide an unified framework with an intuitive interface that models the world as a physicist sees it (see the upper part of figure 1). The interfaces of this framework consist of a visual query language (VQL) interface and several code generation modules (marked with gi in Figure 1) that connect Pheasant to the existing tools. Here we will focus on the VQL interface; the code generation modules are beyond the scope of this paper.
III. D ISCUSSION
OF
V ISUAL Q UERY L ANGUAGES
AND
R ELATED W ORK
Visual Languages (VL) are usually easier to use than text-based interfaces. Thus they make it possible for inexperienced or untrained users to use information systems. An important subset of VL are the visual query languages (VQL), whose purpose is to extract information from stored data. Experience shows that many VLs and VQLs lack formality. This is one of the reasons why complete surveys with thorough comparisons are rare [8]. In our opinion this is a severe drawback, as a query language should allow no ambiguities. We lean toward diagrammatic and graph-based languages as they are easier to formalize [3] than other approaches like metaphorbased, form-based, or iconic-based. They are also better suited to object-oriented or semantic data models [9]. However, metaphor-based approaches should not be dismissed from the outset, as they are usually closer to the user’s perception of the world. Therefore we opted to enrich a graph-based language with elements of metaphor-based concepts, i.e., we avoided to just create a visual layer for an existing textual interface. Our next design decision concerned the specificity of the language. The question was whether to develop a general purpose or a domain specific language. There are advantages and disadvantages for each approach. General purpose languages are very flexible and easier to design, as it is not necessary to consider details of specific domains, but work with more general concepts. However, this comes at a price. The language will be harder to learn and to master, especially for inexperienced computer users. Moreover, the user has to adapt his way of thinking to this general framework, which might employ paradigms totally different from the domain. A domain specific language, on the other hand, utilizes terminology that is familiar to the end-user. Thus it is easier to learn for people acquainted with the domain, but not with computers. There are also disadvantages. First of all, the language is limited to the specific domain, it will be difficult to apply it in a totally different environment. It is also harder to design, as the designer has to have a computer science background as well as knowledge of the domain. We have decided to go ahead with a domain specific language, as we wanted to avoid exactly those problems illustrated for general purpose languages. Our language is used exclusively for HEP data analysis. This leaves us with the problem of balancing the domain specificity and the generality of the language [7]. If the language is too general, we will experience the same problems as with general purpose languages. If it is too specific, no one will use it, as potential users may not be able to formulate their queries. Since it is very difficult to get this balance exactly right, we lean toward specificity, but introduce extendibility into our approach to be able to meet future demands. Examples of visual domain specific languages (VDSL) can be found in areas such as robot control [10], VLSI design [4, 13], CASE tools [18] , languages for software modeling design like UML [6], and GIS [17]. An interesting description of Domain-Specific Languages can be found in[7]. To our knowledge no VDSL exists for analyzing data collected in physics experiments, and our paper aims to present what we believe to be a new area of application of DSVL concepts. IV. DATA M ODEL
AND
L ANGUAGE
In designing a consistent VQL, we took into account – based on previous works in the area of VL – that it should satisfy three major user activities: understanding the structure of the data, query formulation and result set visualization. In HEP analysis the conceptual structure of the data does not change much, so we refrained from explicitly showing the whole domain as in other VLs. We hide the metadata to avoid a confusing layout of the interface, as we expect the users to be very familiar with the structure. Via the operators the corresponding parts of the metadata can be accessed. Furthermore, we did not limit ourselves to retrieving a subset of existing data or selective zooming in on the data, but also allow the computation of new objects at run-time. A query has a tree-like structure and its result can be visualized with the help of different histogram layouts, which is the usual approach in physics to handle statistical data.
A. Data Model
We have modeled the HEP analysis data in an ER diagram that is depicted in Figure 2. It consists of three major entities: Run, Event and Particle. The attributes of the entity Run define the parameters of the experiment, e.g. the setup of the detectors, the time span during which data acquisition took place and general quality issues. As events can only exist within a run, they are modeled as a weak entity (dependent on the entity Run). Its attributes describe properties of particle bunches involved in an event. The remainder of the diagram consists of various entities for describing particles. We have particles that actually leave traces in the detector. These are described by their tracks. Particles reconstructed by computations, i.e. whose existence has been derived from the data, are called vertices. We have to be able to store simulation results as well as experimental data results from Monte Carlo simulation algorithms.With the data gained from simulations the plausibility of the measured results is verified.
Figure 2: Patterned ER model of the HEP analysis data,which excludes detector related data B. Query Pattern
When observing the analysis process, we found a common pattern in the way physicists queried their experimental data. Generally speaking, we can distinguish three different steps. In the first step they select parts of all runs and events supplying predicates for extracting interesting data (e.g. run periods or certain configurations of detectors). The second step involves using data collected in the first step to reconstruct decay chains. However, they are not interested in all decays that took place, but want to sort out data that is irrelevant to their current investigations. This also involves computing and caching intermediate results. The third and last step consists of visualizing the results (in form of histograms, tree-like structures, n-tuples, etc.). Querying does not necessarily stop here: users can go back to the second or even the first step and reformulate their query. B.1. Syntax and Semantics of Our VQL
We are going to introduce the basic building blocks of our language with the help of a running example. Let us start with the theoretical thoughts of a physicist doing analysis. Figure 3 shows the schematics of a typical decay chain that can be the center of an investigation. Particle D + (on the left hand side) eventually decays into particles Π+ and Π− (on the right hand side). A typical query of medium complexity is to find the D+ particle with the highest energy level for each event.2 The particles on the right hand side are the ones whose presence is directly recorded by 2
We will make use of the notation D+(D+ ) Pi+(Π+ ) Pi-(Π− ) from now on
K D
Π
0
+
Π Π
+
−
+
Figure 3: Example of D+ decay schematics
a detector. Physicists use these as a starting point to search for the original particles, which are too short-lived to be detected. We are now going to translate these thoughts into a query. First of all we have to decide which run and event data to use. This is the task of the collection operator, which is represented by a small disk symbol (see Figure 4). Associated with this operator is a list of attributes and a list of filter predicates. Assume for a moment that we are only interested in the data from the third run, so in a first step, we have a collection operator that selects this data for us. Collections can be combined using the standard set operators ∩, ∪, and \. 1D
2D
3D
#
Figure 4: From left to right operators: Collection,Selection, Aggregation, Transformation and Result Set Specification symbols for 1D,2D,3D and Value Result
For the second step we need three more operators: Selection, Aggregation, and Transformation (see Figure 4 for their symbols). Selection works on the data retrieved by a collection operator and selects actual particles detected during these runs and events according to predicates that refer to particles. Aggregation and Transformation operators work on the results of selection operators. An aggregation sums up information on particles per event, i.e. we get one result for each event. Transformation combines the results of two (or more) selections according to predicates that refer to attributes of all participating selections. Usually this results in the construction of a particle higher up in the decay chain. So, the transformation operator creates new particle objects with the data from previous selections. We now need a way to connect the objects. For this we use a simple line with an arrow that describes the data flow from one operator to another. And last, but not least, we have to describe how to visualize the result of the query in the third step. We provide four different operators for the description of the result (see Figure 4): three operators to create one-, two-, and three-dimensional histograms, and one operator to output numeric values. Figure 5(a) shows the complete query. The two operators in the upper part of Figure 5(a) tell the system that we are interested in the data from the third run and want an one-dimensional histogram output of the result. We begin on the right hand side with extracting all Π + and Π− particles from the events of the third run. With the help of a transformation operator (T1 ) we reconstruct a K 0 particle. Another transformation operator (T2 ) helps us find D+ particles. Finally, an aggregation operation filters out the particles with the maximal energy level for each event. B.2. The graph grammar
In this section we introduce a BNF-like grammar of our visual query language (see Figure 6). Let us give some explanatory notes. First of all, we decided to use the symbols of the language itself as terminals in the grammar, so there is no problem to recognize the components introduced in the last section. Non-terminals have a grayish background, while for the terminals the regular background is used. Associated with each operator is some additional data, like attribute lists and condition lists. During query construction this information is hidden most of the time. Therefore we describe this hidden data associated with each operator with the symbol ::∝. Furthermore, we distinguish between two different collection types: run collections and event collections. When no collections are given in a query, the query considers all available data. If
run3
1D Pi+ K0
D+
A1
T1 Pi−
T2 Pi+
(a)
(b) Figure 5: Complete query layout
ASG ::= Collections Query Result Collections ::= CollR CollE CollR ::= ⊥ | | CollR −→ CCOP ←− CollR | R
1
2
CollR −→ NCOP ←− CollR CollE ::= ⊥ | | CollE −→ CCOP ←− CollE | R
1
2
CollE −→ NCOP ←− CollE CCOP ::= | NCOP ::= ::∝ AttributeList ConditionList AttributeList ::= Attribute ∗ Attribute ::= ( Label, Type ) ConditionList ::= Condition ∗ Condition ::= expr CompOP expr U
U \
expr ::= expr AOP expr | Ar Ar ::= Const | Attribute
CompOP ::= > | < | >= |