for the edges (e.g.: pointing downward), show few edge crossings, make the edges as ... Section 4. Section 5 draws our conclusions. 2. Interactive Framework.
A FOCUS AND CONSTRAINT-BASED GENETIC ALGORITHM FOR INTERACTIVE DIRECTED GRAPH DRAWING TECHNICAL REPORT NUMBER 533 SEPTEMBER 2002 Hugo A D do Nascimento and Peter Eades
School of Information Technologies University of Sydney NSW 2006 ISBN 1 86487 512 7
A Focus and Constraint-Based Genetic Algorithm for Interactive Directed Graph Drawing *,†
*
Hugo A. D. do Nascimento and Peter Eades [hadn,peter]@it.usyd.edu.au School of Information Technologies University of Sydney - Australia
Abstract. This paper presents a user-driven genetic algorithm for directed graph drawing. An interactive framework is considered where users can focus the algorithm on regions of the drawing that need major improvement, or include domain knowledge as layout constraints. The paper describes how focus and user constraints are managed by the genetic algorithm. The combination of user’s skills with automatic tools allows a more flexible and efficient optimization method, when compared to traditional non-interactive genetic algorithms. Issues regarding memory usage, processing time, solution representation and convergence are discussed here.
1. Introduction 1
Drawings of directed graphs appear in many different medias and applications, including science books, magazines, technical manuals, and software for designing, managing and exploring diagrams for simulation and tutoring purposes. When a graph contains only a few vertices and edges, it can be drawn easily by hand. However, as the number of vertices and edges increases, a manual drawing approach becomes very time consuming and difficult to manage. The solution to this problem is to make use of automatic techniques, which embed some user-desirable aesthetic criteria and apply a search method to find aesthetically pleasing drawings. A comprehensive study about aesthetic criteria and techniques for graph drawing is presented in [1]. For drawing of directed graphs, the most famous approach is the method of Sugiyama et al. [3], which consists of a four-step process involving several heuristics. There are also some approaches using meta-heuristics, in particular the genetic algorithms developed by [4] and [5]. In both cases, a directed graph is drawn as a hierarchy of horizontal lines called layers. The vertices of the graph are positioned in the layers so that a number of aesthetic criteria are satisfied. The criteria include: show a uniform orientation for the edges (e.g.: pointing downward), show few edge crossings, make the edges as straight as possible, and producing a drawing that is not too wide or tall.
*
Supported by the Australian Research Council. Lecturer of UFG-Brazil. PhD Scholarship from CAPES-Brazil. 1 A graph G=(V,E) describes a set V of entities, called vertices or nodes, and a set E of edges e=(u,v) representing relationships between pairs of vertices of V. A graph is directed when its edges are oriented; (u,v) and (v,u) denote different oriented edges. We say that an edge e=(u,v) is connected to u and v, and also that u and v are the ending points of e. For a complete terminology of Graph Theory, see [2]. †
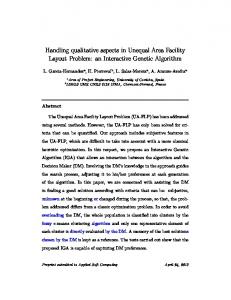
Unfortunately, the satisfaction of these criteria involves several NP-hard problems, and only approximate solutions can be expected for many practical and interesting graphs. As an example, the heuristics developed by Sugiyama result in good drawings [1,3], but still with many edge crossings that could be easily removed. Genetic algorithm methods provide superior results, but their effectiveness decreases rapidly as the size of the graph grows [5]. For large graphs, genetic algorithms may also demand excessive processing time and, therefore, would not be suitable for interactive applications. When automatic methods, even complex ones, fail in producing satisfactory drawings of graphs, no other alternative is left than to bring the human element back into consideration. In fact, many graph-drawing tasks are performed in two stages: an initial drawing is generated using some automatic tool, and then the user improves the drawing manually. Here, we are interested in a more effective way of combining an automatic graph drawing method with human skills. Our aim is to allow a stronger interaction where the capabilities of both the human and the automatic method can be exploited. On one hand, automatic methods are usually fast; they can quickly explorer several combinations of layouts and compute qualitative measures. On the other hand, users have subjective knowledge about aesthetics of diagrams, and seem to be good in visually identifying regions of a drawing with poor quality. In this research, we introduce a genetic algorithm for drawing directed graphs that can be driven by a user. The user and the algorithm are integrated in an interactive framework that allows focus on particular regions of the drawing for major improvement, inclusion of domain knowledge as layout constraints, and direct manipulation of the drawings. The main goal is to generate high quality drawings in less time. This research is a natural continuation of our previous work [6], where we presented a version of the Sugiyama method modified for supporting focus and constraints. Experiments with the system showed that users could significantly improve automatically generated drawings of directed graphs, by reapplying the modified method. The remainder of this paper is organized as follows: Section 2 describes our interactive framework for graph drawing and the system developed in our previous work. Section 3 presents the genetic algorithm with support for focus and layout constraints. Some issues regarding processing time, memory usage and convergence are discussed in Section 4. Section 5 draws our conclusions. 2. Interactive Framework We draw a directed graph on an infinite rectangular grid of integer X-Y coordinates. The Y coordinates represent layers, while the X coordinates are called columns. Layers and columns are labeled with integer numbers. The labels start with any value, and increase continually from the bottom-most to the top-most layers, and from left-most to right-most column. A drawing of a directed graph G is created by assigning X-Y coordinates of the grid to all vertices of G. When an edge intersects one or more layers, it is said to be long. We insert a special vertex in each intersection point of an edge and a layer. This special vertex is called dummy vertex or dummy node. For differentiating the original vertices of the graph from dummy vertices, we call the former real vertices or real nodes. See Figure 1 for an example of a drawing of a graph on a grid. Real vertices are represented by rectangular boxes. Edges are shown as arrows connecting boxes. Dummy nodes are represented by small circles. Formally, a drawing D=(V,E,M,δ) consists of a directed graph G=(V,E), a list M of dummy vertices, and a function δ that assigns X-Y coordinates of the grid to every vertex v in V∪ M. Every dummy vertex is related to a particular edge e in E, and uniquely identifies the intersection of e with a particular layer. We use the notations v.l and v.x to refer to the Y
coordinate and the X coordinate, respectively, of a vertex v in V∪ M. If, for an edge e=(u,v) in E, |v.l-u.l|>1, then e is long and has |v.l-u.l|-1 dummy vertices.
Figure 1: drawing of a directed graph on a grid.
The graph-drawing problem is to produce drawings that satisfy some aesthetic criteria such as those mentioned in the previous section. We consider an interactive framework where the user plays a very active role by helping an optimization method to improve an initial drawing of a directed graph. The interaction with the optimization method involves the user supplying hints, which are adjustments that may overcome a local minimum, reduce the space of solutions to be explored, or avoid ambiguity when there is more than one optimal solution. We consider three basic types of hints: •
Focus. The idea of focus is to identify regions of the drawing that need major improvement and concentrate the optimization method only on these. Since the complexity of managing a sub-problem is, in general, smaller than that of dealing with the entire problem, much processing effort may be saved. Focus is implemented by allowing the user to choose a group of vertices for redrawing. If a vertex is chosen, we call it selected; otherwise, it is called fixed. We focus the optimization method by redrawing the selected vertices, while preserving the XY coordinates of the fixed ones. The selection status of every vertex of the drawing D is kept in the drawing structure itself.
•
Constraints. Constraints are useful for inserting domain knowledge into the problem after the optimization processing has been started. This is a common situation when the problem is dynamic and the user’s preferences are subjective and hard to code. Constraints also allow solving ambiguity by restricting the structure of all feasible solutions. We use two types of constraints: Top-Down and Left-Right. They are modeled as special edges that define an ordering for a pair of real vertices of the drawing. A Top-Down constraint c=(u,v) means that a vertex u has to appear above a vertex v in the drawing. Similarly, a Left-Right constraint c=(u,v) means that u has to appear on the left-hand side of v. The user can add new constraints and remove existing ones.
•
Manual changes. All optimization problems that are not solved by constraints and focus are managed in the framework by manual changes. In this case, the user directly changes the position of some vertices of the drawing. Such an operation is useful when the user visualizes changes that may lead to significant improvement of the drawing, but the optimization method does not implement it.
The interactive framework was implemented as a system called GDHints, where users can give hints in an intuitive way through a graphical interface. The system contains a visualization module that provides feedback the users about the quality of the current drawing being improved. The genetic algorithm presented in the next section is a graph-
drawing optimization method that works in this environment. For more details about the GDHints system, see [6].
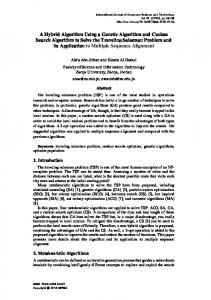
3. The Genetic Algorithm The selected vertices of a drawing of a graph are the only elements that can be repositioned. The layout of the remaining part of the drawing must be preserved. At first glance, this may suggest isolating the selected vertices from the fixed nodes and redrawing only the selection. However, there is a strong dependency between these two groups of vertices, mainly due to by edges connecting them. This situation is illustrated in Figure 2. Figure 2(a) is an initial drawing; vertices d, e and f are selected. Figure 2(b) is an improved drawing where the selected vertices were moved to a different position. The edges (e,a) and (a,d) forced these vertices to jump over the fixed vertex c, so that they could be placed on the left-hand side of the drawing, in a clearer configuration. Moreover, the fixed vertices limited the layout of the drawing since their positions could not be used by the selected vertices (assuming that vertex overlapping is not allowed). The total number of edge crossings was also taken into consideration when moving the selected vertices: it was given preference to a layout that minimizes edge crossings. Due to the dependency between fixed and selected vertices, we cannot separate them completely. Therefore, another way of managing these elements is necessary. Next, we outline how the selected and the fixed elements of a graph drawing are divided and represented in our genetic algorithm.
(a)
(b)
Figure 2: redrawn of selected vertices.
3.1 Individuals Let D be a drawing of a graph G. Let also v.selected be a Boolean attribute that indicates, for any real or dummy vertex v in D, whether v is selected or not. We extend here the concept of selection in order to include edges: an edge e in D is selected if at least one of its ending points or dummy vertices (if they exist) is selected. This condition is indicated by e.selected. The genetic algorithm manipulates a drawing of the whole graph, a list of layout constraints and individuals. An individual contains information about only the selected vertices and the selected edges, and it can be used to reconstruct the selected area of the drawing. The genetic algorithm can have several individuals each possibly describing a different layout for the selected area. A group of individuals generated in an iteration of the genetic algorithm is called population. Figure 3 shows the structure of an individual. It consists of three main parts: 1. REALV: a fixed-length vector with the X-Y coordinates of all selected real vertices; 2. EDGES: a vector with one position for each selected edge of the drawing. Each position holds a list of all dummy vertices associated to its related edge. The list
is sorted such that the dummy vertices are in the same order as they appear when following the edge’s orientation. Every dummy vertex in EDGES contains its XY coordinate position, whether this node is selected or not, and a reference to the edge to which it is related. 3. DUMMYV: a variable-length vector with references to the selected dummy vertices in EDGES. DUMMYV is used for quickly accessing the selected vertices only. EDGES
REALV X1,Y1 X2,Y2
...
Xn,Yn
Edge1
Edge2
...
Edgem
DUMMYV dummy1_ref dummy2_ref
...
dummyp_ref
Figure 3: representation of an individual. Selected dummy vertices are gray.
Note that an individual holds information about fixed dummy vertices as well as selected dummy vertices of a selected edge. In Figure 3, fixed dummy vertices are represented by ellipses in white color, while the selected ones are highlighted in gray. Although fixed dummy vertices should not be redrawn, they have to be included in the individual since they can be deleted if the length of their edges is shortened. Consider that the user has selected the ending points of a long edge e, but not its dummy vertices. If the Y-coordinate (saved in REALV) of any of the ending points of e is changed, the length of the edge can be reduced and some of its (fixed) dummy vertices will not reflect a correct layout any more. If that is the case, these dummy vertices need to be removed. On the other hand, if the edge length is increased, then new dummy vertices have to be created. All new dummy nodes created with this process are marked as selected. For simplicity, we refer to a real and a dummy vertex in an individual using the same notation for vertices in a drawing, introduced in Section 2. We use v.x and v.l to represent the X and the Y-coordinates of a vertex v, respectively, in an individual I. If v is a real vertex, we are referring to coordinates in the vector REALV of I. If v is a dummy vertex, we refer to coordinates saved in the vector EDGES. An individual can be produced directly from a drawing D of the whole graph containing a selected set of vertices. We call this operation Extraction and we use the notation Extract (D) to indicate the new individual extracted from D. As an example of Extraction, the drawing in Figure 2(a) would result in an individual with REALV containing coordinates for vertices d, e and f. The vector EDGES would have six positions – representing the selected edges (a,d), (e,a), (b,d), (d,f), (e,f) and (f,g), each with empty lists, since there are no dummy vertices in these edges. The vector DUMMYV would be zero-length. It is possible to combine a drawing of the whole graph with an individual; we name this operation Merge. The notation Merge (I,D) represents the drawing D merged with the individual I. The merge operation updates the sequence of dummy vertices and the coordinates of all selected vertices of D according to the information in I. Note that D may already have a layout for the select elements, which is over placed by the information in the individual. Extraction and Merge are used by the genetic algorithm in several stages of the graph drawing improvement. For instance, the first individual produced is extracted from an initial drawing inputted to the genetic algorithm. Later, new individuals are merged with
this drawing in order to create a complete layout for evaluation. More details about the application of Extraction and Merge are given in the next sections. 3.2 Quality Evaluation We define an evaluation function Q(D,R)= that measures aesthetic aspects of a drawing D, and the degree to which D satisfies a list R of constraints. This function results in a cost vector, whose parameters are as follows: • q1: number of violated Top-Down and Left-Right constraints; • q2: number of horizontal and upward edges; • q3: number of edge crossings; • q4: number of dummy vertices; • q5: number of edge bends (a bend occurs when a edges turns to a different direction on a dummy vertex); • q6: the area of the drawing (the number of layers multiplied by the number of columns used by the drawing); and • q7: the sum of all edge lengths. A priority order is defined such that q i is more important than qi+1 for all i=1,2,..,6. Minimizing the number of edge crossings, bends, the area of the drawing and other aspects is a common approach for improving drawings of directed graphs. In general, low cost vectors result in aesthetically pleasing drawings and, therefore, in solutions of high quality. Every individual produced by the system is assigned a cost vector. The cost vector measures only the selected elements of the drawing and their relation with the fixed elements. This is obtained by firstly merging the individual with an existing drawing of the whole graph, and then computing q 1, q2, ..., q7 for the selected vertices and edges. For instance, when computing q3 we need to count the number of edge crossings between only selected edges and between a selected and a non-selected edge. The crossings between nonselected edges do not have to be considered for the cost vector, since they are an invariant in the problem. Given two individuals I1 and I2 with assigned cost vectors Q1=(q11, q 21, ..., q71) and 2 2 Q =(q1 , q22, ..., q72) respectively, we say that I1 is better than I2, denoted by I1