Computer and Information Science Department, University of Florida, PO Box ... and it is necessary to use low levels of X-ray energy to obtain high contrast in ...
A framework for contrast enhancement by dyadic wavelet analysis Andrew Laine, Jian Fan and Sergio Schuler Computer and Information Science Department, University of Florida, PO Box 116120, Gainesville, FL 32611-6120, USA
ABSTRACT
This paper introduces a method for accomplishing mammographic feature analysis by multiresolution representations of the dyadic wavelet transform. Our approach consists of the application of non-linear enhancing functions E (z) within levels of a multiresolution representation. We show that there exists a simple constraint for E (z) such that image enhancement is guaranteed. Furthermore, a simple case in which the enhancement operator is a constant multiplier is mathematically equivalent to traditional unsharp masking. We show quantitatively that transform coe�cients, modi ed within each level by non-linear operators, can make more obvious unseen or barely seen features of mammography without requiring additional radiation. Our results are compared with traditional image enhancement techniques by measuring the local contrast of known mammographic features.
INTRODUCTION Many cancers escape detection due to the density of surrounding breast tissue. For example, di�erences in attenuation of the various soft tissue structures in the female breast are small, and it is necessary to use low levels of X-ray energy to obtain high contrast in mammographic lm. Since contrast between the soft tissues of the breast is inherently low and because relatively minor changes in mammary structure can signify the presence of a malignant breast tumor, the detection is more di�cult in mammography than in most other forms of radiography. The radiologist must search for malignancy in mammographic features such as microcalci cations, dominate and stellate masses, as well as textures of brous tissues ( broglandular patterns). A primary breast carcinoma can metastasize when it consists of a relatively small number of cells, far below our present threshold of detection. The importance of diagnosis of breast cancer at an early stage is critical to patient survival. Despite advances and improvements in mammography and mammographic screening programs, the detection of minimal breast cancer (those cancers 1.0 cm or less in diameter) remains di�cult. At present, mammography is capable of detecting some cases through indirect signs, particularly through the presence of characteristic microcalci cations. It has been suggested that as normally viewed, mammograms display only about 3% of the information they detect! [1]. The inability to detect these small tumors motivates the multiscale imaging technique presented in this paper. Digital image processing techniques have been applied previously to mammography. The focus of past investigations has been to enhance mammographic features while reducing the enhancement of noise. Gordon and Rangayyan [9] used adaptive neighborhood image processing to enhance the contrast of features relevant to mammography. This method enhanced the contrast of mammographic features as well as noise and digitization e�ects. Dhawan et al. [6, 7, 8] have made signi cant contributions towards solving problems encountered in mammographic image enhancement. They developed an adaptive neighborhoodbased image processing technique that utilized low-level analysis and knowledge about a 1
desired feature in the design of a contrast enhancement function to improve the contrast of speci c features. Recently, Tahoces et al. [19] developed a method for the enhancement of chest and breast radiographs by automatic spatial ltering. In their method, they used a linear combination of an original image and two smoothed images obtained from the original image by applying di�erent spatial masks. The process was completed by nonlinear contrast stretching. This spatial ltering enhanced edges while minimally amplifying noise. Methods of feature enhancement have been key to the success of classi cation algorithms. Lai et al. [10] compared several image enhancement methods for detecting circumscribed masses in mammograms. They compared an edge-preserving smoothing function [17], a halfneighborhood method [18], k-nearest neighborhood, directional smoothing [5] and median ltering [2], and in addition proposed a method of selective median ltering. In the elds of image processing and computer vision, transforms such as the windowed Fourier transforms that can decompose a signal into a set of frequency intervals of constant size have been used in many applications, including image compression and texture analysis. Because the spatial and frequency resolution of these transforms are constant, the information provided by such decompositions is not localized in the spatial domain. A wavelet transform [3, 4, 15] is a decomposition of an image onto a family of functions called a wavelet family. In comparison to a windowed Fourier transform, the resolution of a wavelet transform varies with a scale parameter, decomposing an image into a set of frequency channels of constant bandwidth on a logarithmic scale. This variation of resolution enables the wavelet transform to \zoom" into the irregularities of an image and characterize them locally. In this paper we accomplish mammographic feature enhancement through a dyadic multiresolution representation [11, 12, 13]. By using a multiresolution representation, we decompose an image into a multiresolution hierarchy of localized information at di�erent spatial frequencies. Our approach for mammographic feature enhancement consists of the application of non-linear operators for image enhancement within levels of a redundant multiresolution representation. We show preliminary results that suggest our method can emphasize signi cant features in mammography for improved visualization of breast pathology.
ONE-DIMENSIONAL DYADIC WAVELET TRANSFORM The one-dimensional dyadic wavelet transform of a continuous function f (x) at scale 2k and position x is de ned by the convolution of f and as follows [14] W2k f (x) = f (x) � 2k (x); (1) 1 f (u)g (x ? u)du and k (x) = 1 ( x ) where f � g is de ned as f (x) � g(x) = ?1 2 � � �=2k is the dilation of a mother wavelet (x). A function f (x) 2 R2 can then be expressed in term of its wavelet transform as follows
R
f (x) =
1
X
k=?1
W2k f (x) � �2k (x) =
1
X
k=?1
f (x) �
2k (x) � �2k (x);
(2)
where wavelets (x) and �(x) satisfy the condition 8!; 1k=?1 (2k !)�(2k !) = 1; and (!) and �(!) are the Fourier transform of (x) and �(x), respectively. For the construction of wavelets, a scaling function �(x) was introduced and de ned k k by j�(!)j2 = 1 k=1 (2 ! )�(2 ! ); where �(! ) is the Fourier transform of �(x). A scaling function shall satisfy the dilation equation (3) �(!) = H !2 � !2 ; P
b
b
b
P
b
b
b
�
�
�
b
b
2
�
b
b
.
j ^ ψ( 2 ω )
. . A
A
^χ ( 2 j ω )
K(ω)
G(ω)
^χ ( 2 j-1ω )
j-1 ^ ψ( 2 ω )
A
f(x)
G(2ω)
K(2ω)
. . .
H* (ω)
H(ω) A
H(2ω)
H* (2ω)
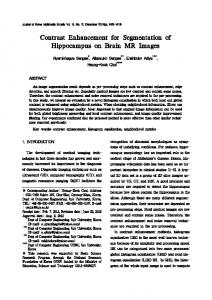
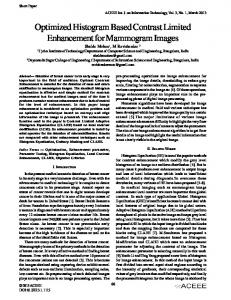
(a) (b) Figure 1: (a) Structure of the dyadic wavelet transform. (b) A two-level discrete dyadic wavelet transform. where H (!) is the discrete Fourier transform of a discrete lter hl: Functions (x) and �(x) can then be constructed from a scaling function �(x) and discrete lters G(!) and K (!) as follows (4) (!) = G !2 � !2 ; �(!) = K !2 � !2 : Figure 1(a) shows a lter-based implementation of the dyadic wavelet transform. For enhancement purposes, we considered a special class of wavelets which satis ed d2� ; (x) = dx (5) 2 or in the frequency domain (!) = ?!2�(!). We further required that �(x) be a low-pass function with �(0) 6= 0, and lim!!1 �(!) = 0: A class of wavelet satisfying (5) can be constructed from the following discrete lters [14] 2n?1 2 2n 2 2l H (!) = cos !2 cos !2 : ; G(!) = ?4 sin !2 ; K (!) = 1 ?GjH(!()!)j = ? 41 l=0 (6) Using Equations (3), (4) and (6) one can show that 2n 2n+2 sin( != 4) 1 sin( != 2) 2 ; (!) = ?! 4 (!=4) = ?!2�(!); �(!) = (!=2) (7) 2n 2n?1 2l 1 sin( != 4) ! �(!) = ? 4 (!=4) cos 4 = ? (!): �
�
�
�
�
�
�
b
b
b
b
b
�
�
�
b
b
b
��
�
��
�
X
#
"
"
�
��
#
b
b
�
b
"
#
b
X
�
�
��
b
l=0
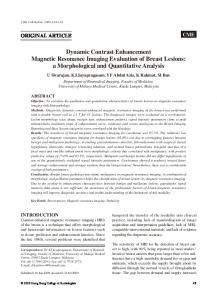
where the lter frequency responses !=4) 2n+2 ; (!) = 1 sin(!=4) 2n 2n?1 cos ! 2l �(!) = 14 sin( (8) (!=4) 4 (!=4) 4 l=0 are low-pass, zero-phase, symmetric and positive. Figure 2 shows 4�(!) and n2 (!). Note that both functions (!) and �(!) are close to a Gaussian function. For this speci c class of wavelets, Equation (1) can be written as d2 [f (x) � � k (x)] : W2k f (x) = 2k dx 2 2 "
#
b
"
b
b
b
#
X
b
3
�
��
�
b
1
1
1
0.9
0.9
0.9
0.8
0.8
0.8
0.7
0.7
0.7
0.6
: n=1
0.6
: n=1
0.6
: n=1 Theta
0.5
: n=2
0.5
: n=2
0.5
: n=1 Beta
0.4
: n=3
0.4
: n=3
0.4
: Gaussian
0.3
0.3
0.3
0.2
0.2
0.2
0.1
0.1
0.1
0 0
5
10
15
20
25
0 0
5
10
15
20
0 0
25
2
4
6
8
10
12
14
16
18
20
(a) (b) (c) Figure 2: (a) 4�(!), (b) n2 (!), and (c) Overlayed plots of 4�(!), n2 (!) and Gaussian e?0:055!2 . b
b
b
b
ENHANCEMENT TECHNIQUES Linear enhancement
We now consider a linear enhancement operator which multiplies transform coe�cients of a single channel m 2 Z by a constant Cm 2 R. In this case, the output of channel m is d2 [f (x) � � m (x) � m (x)] ; CmW2m f (x) � �2m (x) = ?2mCm dx 2 2 2 and the \enhanced" function f~(x) is d2 [f (x) � � m (x) � m (x)] : f~(x) = f (x) ? 2m (Cm ? 1) dx 2 2 2 In the frequency domain, this is equivalent to a linear system with a transfer function T (!) = 1 + 2m (Cm ? 1)!2�(2m !) (2m !): Note that �(!) and (!) in Equation (8) are real, positive and symmetric. Therefore, such an operator is guaranteed to enhance a speci c range of the frequency domain. Here, we point out a special case for which a single channel m is enhanced by Cm > 1, and the bandwidth B m of lter (2m!) satis es B m � Bf : (9) where Bf is the bandwidth of the input signal. For such a case, f~(x) = f (x) ? 2m (Cm ? 00 1)f (x): In general, more than one channel may be enhanced (suppressed). Therefore, in its most general form, the system frequency response may be written as b
b
b
b
b
T (!) = 1 +
1
X
m=?1
2m (Cm ? 1)!2�(2m !) (2m !): b
b
(10)
Since each channel introduces no phase shifting, the whole system is still guaranteed to be zero-phase, and its frequency response is completely determined by the set fCmg. We call this linear enhancement technique Multiscale Unsharp Masking. A single channel linear enhancement is exactly equivalent to traditional Unsharp Masking. 4
Non-linear enhancement
Although linear enhancement methods are traditionally used, non-linear methods are more appealing mainly due to the limited display range [0 ? 255] in imaging systems. A nonlinear enhancement method can be viewed in two aspects. From the point of dynamic range compression, such a method attempts to bring up features previously di�cult to see. From the feature selection point of view, such a method tries to enhance features having certain properties. In the previous sections, we used Fourier analysis tools to analyze system properties. Unfortunately, for a non-linear enhancement system, such tools can no longer be used. Instead, we need to work directly in the time domain. For non-linear enhancement, we place an enhancement function (operator) on point A of Figure 1(a). In general, the output of such a system is
f~(x) =
1
X
k=?1
E [W2k f (x)] � �2k (x) =
1
X
k=?1
E
"
2k
d2 [f (x) � � k (x)] � � k (x): 2 2 dx2 #
Consider rst a simple case in which a single channel p is enhanced. In this case, we can write the output as d2 [f (x) � � k (x)] � � k (x) + E 2p d2 [f (x) � � p (x)] � � p (x) (11) f~(x) = 2k dx 2 2 2 2 2 dx2 k6=p 2 2 = f (x) + E 2p d 2 [f (x) � �2p (x)] ? 2p d 2 [f (x) � �2p (x)] � �2p (x) dx dx X
"
#
(
#
"
"
#
)
We further assume that Equation (9) is valid for channel p. Then, we can simplify the above expression as follows 2 2 (12) f~(x) = f (x) ? E 2p ddxf2 ? 2p ddxf2 !
"
#
Next, consider a soft edge modeled by the function f (x) = 1+e1?�x . Notice that its second derivative f 00 (x) = ?(�=2)2 sinh(�x=2)(cosh(�x=2))?3 is antisymmetric. Therefore, an enhancement function E (x) shall meet the following constraints � Monotonicity, in order not to change the position of local extrema. � Antisymmetry, E (?x) = ?E (x), in order not to add a DC component to a band-pass channel output, and to boost edges. � Continuity, in order to avoid any discontinuities. We observed that d2 f , the edge is enhanced. 1. For points x where E 2p ddx2 f2 > 2p dx 2 �
�
�
�
�
�
d2 f = 2p d2 f , the edge is unchanged. 2. For points x where E 2p dx 2 dx2 d2 f , the edge is eroded. 3. For points x where E 2p ddx2 f2 < 2p dx 2
5
Linear enhancement,Discrete
Non-linear enhancement,Discrete
1.4
1.4
1.2
1.2
1
1 :Enhanced
:Enhanced
0.8
0.8 :Original
:Original
0.6
0.6
0.4
0.4
0.2
0.2
0
0
-0.2
50
100
150
200
250
300
350
400
450
-0.2
500
50
100
150
200
250
300
350
400
450
500
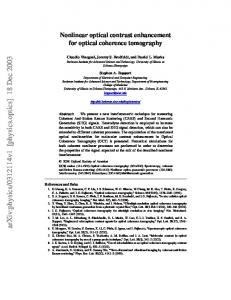
(a) (b) Figure 3: Four-level dyadic edge enhancement by (a) linear operator E (x) = 2:3x and (b) non-linear operator E (x) with T = 0:2 max[w(n)] and k = 5. For enhancement purposes, case 3 above shall be avoided. Thus, we add an additional constraint to the enhancement function, E (x) � x. Experimentally, we found the following simple function useful for enhancement x ? (k ? 1)T; if x < ?T , E (x) = kx; if jxj < T , x + (k ? 1)T; if x > T , where k > 1. A complete theoretical analysis for a more general case remains to be carried out. 8 > < > :
DISCRETE ALGORITHMS 1-D discrete algorithm
A discrete algorithm can be readily obtained using discrete lters H (!), G(!) and K (!) [14]. Figure 1(b) shows the structure for a two-level discrete dyadic wavelet transform. Note that lter g[n] = f1; ?2; 1g is a discrete second derivative operator, and G(2k !)K (2k !) = 2 1 ? H (2k !) is also real, positive and symmetric for all frequencies !. Therefore, all previous conclusions for continuous systems shall also be valid for the discrete case. Figure 3 shows multi-level edge enhancement results of four-level discrete dyadic wavelet transform using linear and non-linear methods. The parameters for the non-linear enhancement were T = 0:2 max[w(n)] and k = 5. The gain for linear enhancement was k = 2:3.
2-D discrete algorithm
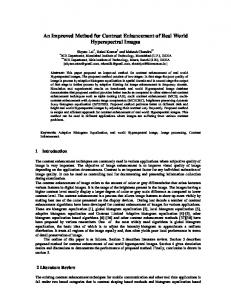
Mallat and Zhong [14] showed that a two-dimensional dyadic wavelet transform can be easily constructed from one-dimensional wavelets. A two-dimensional discrete dyadic wavelet transform can be implemented using one dimensional dimensional lters H , G, K and L as in Figure 4(a), where lter L satis es L(!) = (1 + jH (!)j2)=2: Figure 4(b) displays the magnitude of the equivalent channel lters for levels 1, 2, and 3, and clearly shows that for the dyadic wavelet transform, orientations are partitioned into horizontal and vertical bands. 6
A K(ωx ) L(ω y )
G(ω x ) A G(ω y )
K(ω y ) L(ωx )
H(ω x) H(ω y)
* * H(ω x) H(ω y)
A
A
(a)
(b) Figure 4: (a) A two-level two-dimensional discrete dyadic wavelet transform, (b) Analyzing lters (n = 1) used in the 2-D dyadic wavelet transform.
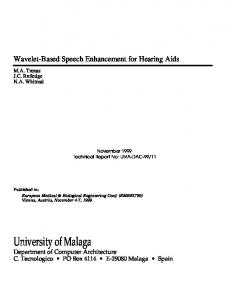
EXPERIMENTAL RESULTS AND DISCUSSION Preliminary results have shown that the multiscale processing technique described above, can make more obvious unseen or barely seen features of a mammogram without requiring additional radiation. Our study suggests that the analyzing functions presented in this paper can improve the visualization of features of importance to mammography and assist the radiologist in the early detection of breast cancer. In our study, lm radiographs of the breast were digitized using a sampling distance of 200 microns, on a Kodak laser lm digitizer, with 10-bit quantization (contrast resolution). Each digital image was cropped to a matrix size of 512 � 512 before processing. Mathematical models of phantoms were constructed to validate our enhancement technique against false positives arising from possible artifacts introduced by the analyzing functions and to compare our methods against traditional image processing techniques of improving contrast. Our models included features of regular and irregular shapes and sizes of interest in mammographic imaging, such as microcalci cations, cylindrical and spicular objects and conventional masses. Techniques for \blending" a normal mammogram with the images of mathematical models were developed. The purpose of these experiments was to test the performance of our processing technique on inputs known \a priori" using mammograms where the objects of interest were deliberately obscured by normal breast tissues. The \imaging" justi cation for \blending" is readily apparent; a cancer is visible in a mammogram because of its (slightly) higher X-ray attenuation which causes a lower radiation exposure on the lm in the appropriate region of a projected image. Our blended mammogram was constructed by adding the amplitude of the mathematical phantom image to a cancer free mammogram followed by local smoothing of the combined image. Figure 5(a) shows the result after processing the blended mammogram with unsharp masking. Figure 5(b) was obtained after reconstructing the blended mammogram from dyadic wavelet transform coe�cients modi ed by the non-linear enhancing function described in Section 3. Figure 6 shows enlarged areas containing each feature in the processed mammogram for each method of contrast enhancement. Non-linear multiscale enhancement of dyadic wavelet coe�cients provided a signi cant improvement in local contrast for each 7
Table 1: Contrast values and CII for enhancement by unsharp masking (UNS) and non-linear multiscale enhancement of dyadic wavelet (DYA) coe�cients. Feature Minute microcalci cation cluster Microcalci cation cluster Spicular lesion Circular (arterial) calci cation Well-circumscribed mass
COriginal 0.0217 0.0192 0.0295 0.0204 0.0277
CUNS 0.0312 0.0239 0.0351 0.0266 0.0280
CDYA 0.1219 0.1225 0.1295 0.1219 0.0983
CIIUNS 1.4347 1.2424 1.1866 1.3017 1.0101
CIIDYA 5.6093 6.3623 4.3833 5.9658 3.5501
feature included in the blended mammogram. A quantitative measure of contrast improvement can be de ned by a Contrast Improve; where CProcessed and COriginal are the contrasts for a region ment Index (CII), CII = CCProcessed Original of interest in the processed and original images, respectively. In this paper we adopt a version of the optical de nition of contrast introduced by Morrow et al. [16]. The contrast C of an object is de ned by C = ff ?+bb ; where f is the mean gray-level value of a particular object in the image, called the foreground, and b is the mean gray-level value of a surrounding region called the background. This de nition of contrast has the advantage of being independent of the actual range of gray levels in the image. With the aid of the mathematical phantom we computed local masks to separate the foreground and background regions of each feature included in the blended mammogram. Table 1 shows the contrast values and CII for the mammographic features shown in Figure 6. Note that nonlinear enhancement of dyadic wavelet coe�cient performed signi cantly better than unsharp masking and consistently improved the contrast of each feature. In all cases contrast was improved while preserving the overall shape of each feature pro le.
SUMMARY We have presented a methodology for accomplishing contrast enhancement by multiscale representations. We have demonstrated that features extracted from multiresolution representations can provide for local emphasis of salient and subtle features of importance to mammography. We have compared these techniques to a traditional standard for image enhancement and described a mathematical framework connecting the two methods. The improved contrast of mammographic features make our technique appealing for computed aided diagnosis and screening mammography.
REFERENCES [1] I. Brodie, R.A. Gutcheck. Radiographic information theory and application to mammography, Medical Physics, Vol. 9, 79, 1982. [2] A.C. Bovik, T.S. Huang, D.C. Munson. The e�ect of median ltering on edge estimation and detection. IEEE Transactions on Pattern Analysis and Machine Intelligence. Vol. PAMI-9: 181{194, 1987. [3] I. Daubechies. Orthonormal bases of compactly supported wavelets.Communications on Pure and Applied Mathematics. Vol. 41: 909-996, 1988. [4] I. Daubechies. The wavelet transform, time-frequency localization and signal analysis. IEEE Transactions on Information Theory. Vol. 36(5): 961{1005, 1990.
8
[5] L.S. Davis, A. Rosen eld. Noise cleaning by iterated local averaging. IEEE Transactions on Systems, Man and Cybernetics. Vol. SMC-8: 705{710, 1978. [6] A.P. Dhawan, G. Buelloni, R. Gordon. Enhancement of mammographic feature by optimal adaptive neighborhood image processing. IEEE Transactions on Medical Imaging. Vol. MI-5:8, 1986. [7] A.P. Dhawan, R. Gordon. Reply to comments on enhancement of mammographic feature by optimal adaptive neighborhood image processing. IEEE Transactions on Medical Imaging. Vol. MI-6:82, 1987. [8] A.P. Dhawan, E. Le Royer. Mammographic feature enhancement by computerized image processing. Computer Methods and Programs in Biomedicine, Vol. 27: 23, 1988. [9] R. Gordon, R.M. Rangayyan. Feature enhancement of lm mammograms using xed and adaptive neighborhoods. Applied Optics. Vol. 23:560, 1984. [10] S.M. Lai, X. Li, W.F. Bischof. On techniques for detecting circumscribed masses in mammograms. IEEE Transactions on Medical Imaging. Vol. MI-8(4), 1989. [11] A. Laine. Multiscale wavelet representations for mammographic feature analysis. In Image Enhancement [12] [13] [14] [15]
Techniques: Computer Science, National Cancer Institute Breast Imaging Workshop: State-of-the-Art and New Technologies, Bethesda, MD, September 1991. A. Laine, S. Song. Multiscale wavelet representations for mammographic feature analysis. In Proceedings of SPIE: Conference on Mathematical Methods in Medical Imaging, San Diego, CA, July 23{25, 1992. A. Laine, S. Song. Wavelet processing techniques for digital mammography. In Proceedings of SPIE: Conference on Visualization in Biomedical Computing, Chapel Hill, NC, October 13{16, 1992. S. Mallat, S. Zhong. Characterization of signals from multiscale edges. IEE Transactions on Pattern Analysis and Machine Intelligence. Vol. 14, No. 7, 1992. S. Mallat. A Theory for Multiresolution Signal Decomposition: The Wavelet Representation. IEEE Transactions on Pattern Analysis and Machine Intelligence. Vol. 11(7): 674{693, 1989.
[16] W.M. Morrow, R.B. Paranjape, R.M. Rangayyan, J.E.L. Desautels. Regio-based contrast enhancement of mammograms. IEEE Transactions on Medical Imaging. Vol. 11(3): 392{406, 1992. [17] M. Nagao, T. Matsuyama. Edge preserving smoothing. Computer Graphics and Image Processing. Vol. 9: 394{407, 1979. [18] A. Scheer, F.R.D. Velasco, A. Rosen led. Some new image smoothing techniques. IEEE Transactions on Systems, Man and Cybernetics. Vol. SMC-10(3): 153{158, 1980. [19] P.G. Tahoces, J. Correa, M. Souto, C. Gonzalez, L. Gomez, J. Vidal. Enhancement of chest and breast radiographs by automatic spatial ltering. IEEE Transaction on Medical Imaging. Vol. MI-10(3): 330335, 1991.
Acknowledgments: This work was sponsored in part by the Whitaker Foundation, and the U.S. Army Medical Research and Development Command, Grant number DAMD17-93-J-3003. The authors wish to thank Doctors Edward Staab, Janice Honeyman, Barbara Steinbach and Walter Huda, of the Department of Radiology, University of Florida, for their support and encouragement.
9
(a)
(a)
(b)
Figure 6: Contrast enhancement for features in blended mammogram. (a) Enhancement (b) by unsharp masking. (b) Non-linear multiscale enhancement of dyadic wavelet transFigure 5: Blended mammogram: (a) En- form coe�cients. Phantom mammographic hancement by unsharp masking. (b) Non- features from top to bottom: minute microlinear multiscale enhancement of dyadic calci cation cluster, microcalci cation cluswavelet transform coe�cients. ter, spicular lesion, circular (arterial) calci cation, and a well-circumscribed mass. 10