Trauma Mon. 2017 January; 22(1):e26117.
doi: 10.5812/traumamon.26117.
Published online 2016 April 24.
Research Article
A Framework for the Calculation of Direct and Indirect Costs of Accidents and Its Application to Incidents Occurring in Iran’s Construction Industry in 2013 Javad Vatani,1 Gebraeil Nasl Saraji,1,* Abolghasem Pourreza,2 Mahmood Salesi,3 Iraj Mohammadfam,4 and Seyed Abolfazl Zakerian1 1
Department of Occupational Health, School of Public Health, International Campus, Tehran University of Medical Sciences, Tehran, IR Iran Department of Health Management and Economics, School of Public Health, Tehran University of Medical Sciences, Tehran, IR Iran 3 Trauma Research Center, Baqiyatallah University of Medical Sciences, Tehran, IR Iran 4 Department of Occupational Health, School of Public Health, Hamedan University of Medical Sciences, Hamedan, IR Iran 2
*
Corresponding author: Gebraeil Nasl Saraji, Department of Occupational Health, School of Public Health, International Campus, Tehran University of Medical Sciences, Tehran, IR Iran. Tel: +98-9121182069, Fax: +98-2188951390, E-mail:
[email protected]
Received 2014 December 25; Revised 2015 January 28; Accepted 2015 February 03.
Abstract Background: Occupational accidents represent one of the major problems in developing and developed countries. Deaths caused by occupational accidents result in loss of life, lost working hours, and related costs. These accidents create a lot of waste for the community and labor organizations. Moreover, they result in socioeconomic losses such as disability, loss of work time, and increased medical care expenses. Objectives: Despite the existence of extensive studies, a practical method for calculating the cost of accidents is still not clear; consequently, the aim of the present study is to provide a new framework for the calculation of the (direct and indirect) costs of accidents in construction. Materials and Methods: In this paper, the cost of accidents in the construction industry in Tehran, Iran in 2013 were calculated using a new, structured, six-step approach. First, the results were classified into five groups according to the intensity of accident, as follows: 1, short-term absences; 2, long-term absence; 3, small inability; 4, total disability; and 5, death. Moreover, the six following groups of imposed costs were identified: 1, production disturbance costs; 2, human capital costs; 3, medical costs; 4, administrative costs; 5, transfer costs; and 6. other costs. These groups were classified according to the direct or indirect costs resulting from the incident and the costs imposed on workers, employers, and society. Finally, the data were analyzed using statistical tests. Results: Significant proportions of the cost of construction accidents involve production disturbance costs, human capital costs, medical costs, administrative costs, transfer costs, and other costs. The highest cost is imposed on the community and employee, with the least being imposed on employers. Much of the cost of accidents relates to total disability ($ 4,260,000) and partial disability ($ 3,270,000); meanwhile, the lowest costs are associated with death ($ 1,800,000), long-term absences ($ 1,960,000), and short-term absences ($ 840,000). A significant difference was seen between the type of cost (e.g., production disturbance cost, human capital costs; P = 0.0001). Statistical analysis of the direct and indirect costs of accidents indicated a significant difference (P = 0.019). Moreover, a significant difference was seen between the cost of accidents resulting (P = 0.005). Conclusions: Accidents resulting in death, total disability, and partial disability impose a huge cost burden on society, whereas the employer will bear a relatively low cost. This is because of society’s health, treatment, and welfare systems available for treatment and rehabilitation of injured employees and their families.
Keywords: Accidents, Direct Costs of Accidents, Indirect Costs of Accidents, Construction
1. Background Occupational accidents represent a major problem in both developing and developed countries. The most important part of these costs are human costs. Deaths caused by occupational accidents result in the loss of life and years of work, as well as related costs (1, 2). Every year, millions of occupational accidents occurs worldwide; some are fatal, while others leads to temporary and permanent disabil-
ity (3). Human contemporary history has recorded several disasters with multi-billion-dollar financial losses and human casualties, including the explosion of the Challenger shuttle (1986), the nuclear reactor explosion at Chernobyl (1986), the accident in Mexico (1985), and the Bhopal plant accident in India (1981) (4). Each year, approximately 120 million occupational accidents and more than 200,000 deaths caused by accidents occur worldwide (3). In India, there are 120 million workers; 7.7 million occupational
Copyright © 2016, Trauma Monthly. This is an open-access article distributed under the terms of the Creative Commons Attribution-NonCommercial 4.0 International License (http://creativecommons.org/licenses/by-nc/4.0/) which permits copy and redistribute the material just in noncommercial usages, provided the original work is properly cited.
Vatani J et al.
accidents are reported annually, representing a loss of 3.25 working days for the occurrence of any accident (5). In 2007, the number of occupational accidents involving more than 3 days’ absence from work in manufacturing companies in 15 European countries was about 942,000 (6). Various industries play an important role in the economies of countries around the world; the construction industry is particularly important in the United Kingdom, this industry represents with 10% of the gross domestic product (GDP) and more than 1.5 million (7). In the United States, occupational accidents in the construction industry resulted in the deaths of about 17.29 workers out of 100,000 between 1980 and 1992 (8). Accidents in the transportation industry also represent a major cause of morbidity and mortality of youth worldwide; in developing countries such as Iran, there is a high rate of deaths due to accidents in the transport sector, at 25.8 deaths per 100,000 people, whereas in developed countries, this rate is 19.9 deaths (9, 10). Occupational accidents have brought about great losses and related costs for the community, organizations, and workers, along with adverse effects on economic indicators at the national and household levels. Such accidents represent obstacles to obtaining predetermined objectives. Currently, the worst consequence of occupational accidents is premature mortality in the labor force (1, 7). Workrelated injuries are an important health problem worldwide, and about 14 deaths per 100,000 are due to occupational accidents. Such accidents also cause socioeconomic losses such as disability, reductions in working time, and increased healthcare costs (1). The annual human cost per foot is 3.36 billion dollars, and the total human cost of occupational accidents resulting in death represents 3% of the GDP (2, 11, 12). Bahrampour et al. studied on the building workers of Yazd, Iran and showed that if the current trend in accidents continues, the number accidents will increase dramatically after several years; the major cause of such accidents will be falls from a height (11). One of the most dangerous occupations is working the construction industry, but along with the accidents leading to death and total disability at an international level, its risks and losses remains somewhat unclear (12-18).
2. Objectives Unlike many studies on the costs of accidents, there is still no clear and scientific method to calculate the cost of accidents; those that are available have some blind spots, the ultimate aim of the present study is to provide a new 2
structure in the cost calculation of accidents (direct and indirect) and calculate the costs imposed on society, the employer and the injured person and required analyses. 3. Materials and Methods In this paper, the cost of accidents was calculated using a new, structured, six-step approach. First, the results were classified into five groups according to the intensity of accident, as follows: 1, short-term absences; 2, long-term absence; 3, small inability; 4, total disability; and 5, death. Moreover, the six following groups of imposed costs were identified: 1, production disturbance costs; 2, human capital costs; 3, medical costs; 4, administrative costs; 5, transfer costs; and 6, other costs. Finally, using the developed formulas the direct and indirect costs of accidents and the imposed costs on employees, employers, and the community were measured. The steps of the procedure are described in detail below: 3.1. Step 1 In order to calculate the cost of accidents, first, the results were classified into five groups according to the intensity of accident, as follows: 1, short-term absences; 2, long-term absence; 3, small inability; 4, total disability; and 5, death (19, 20). The types of accident, levels of intensity, and definitions are presented in Table 1. 3.2. Step 2 The accident is classified into one of six groups, as follows: 1, production disturbance costs; 2, human capital costs; 3, medical costs; 4, administrative costs; 5, transfer costs; and 6 other costs. The following definitions are used to determine the cost groups of an accident: Production disturbance costs (PDC): costs incurred in the short term until the product reaches its pre-accident level. Human capital costs (HCC): long-term costs and the potential reduction of production after a restructuring of the production level that existed before the accident occurred. Medical costs (MEDC): costs incurred by the workers and the community during the medical treatment for workers injured in work-related accidents. Administrative costs (ADMINC): costs incurred in the implementation of indemnification projects, accident investigations, and legal fees. Transfer costs (TRANC): deadweight losses associated with the administration of tax and welfare. Other costs (OTC): includes costs not classified elsewhere, such as costs related to employees’ careers, assistance changes, and renovations (19, 20). Trauma Mon. 2017; 22(1):e26117.
Vatani J et al.
Table 1. Definition of Accidents Based on the Severity of the Outcome
Type of Accident
Intensity level
Definition
S1
Short-term absence
Under 5 working days
A minor injury or work-related illness where the employee is absent for under 5 working days or is unable to complete normal and routine tasks, and the employee is able to continue his work after recovery
S2
Long-term absence
Five working days or more of rest and returning to work on regular duty
A minor injury or illness related to work, which consists 5 or more working days but less than 6 months off work, after which the worker is able to continue working and has completely recovered
S3
Partial disability
Five or more days of rest and return to work with short-term tasks or low income
Work-related injury or illness resulting in the return of worker for the first time after leaving work with more than 6 months of absenteeism
S4
Total disability
Permanently disability and inability to return to work
Work-related injury or illness to the employee causing permanent inability to perform his or her tasks
S5
Death
Death
Work-related injury or illness that leads to death
3.3. Step 3 Each cost group is divided using a more detailed classification and a code is allocated to each of the cost sections. 3.4. Step 4 All of the accidents are classified into direct (D) and indirect (= I) sections, then analyzed based on the cost imposed on the employer, the employee, or society (19-21). Table 2 summarizes the cases mentioned above. 3.5. Step 5 Using the provided formulas, the cost of the accident and its direct and indirect costs can be measured, including the costs imposed on the employee, employer, and society (19-21): Calculation of the total cost of the accident: Total cost of accident: (PDC1 + PDC2+ PDC3 + PDC4 + PDC5 + PDC6) + (HCC1 + HCC2 + HCC3) + (MEDC1 + MEDC2 + MEDC3 + MEDC4) + (ADMINC1 + ADMINC2 + ADMINC3 + ADMINC4 + ADMINC5 + ADMINC6 + ADMINC7) + (TRANC1) + (OTC1 + OTC2) Calculation of the direct cost of the accident: Direct cost of accident: (PDC3) + (HCC3) + (MEDC1 + MEDC3 + MEDC4) + (ADMINC1 + ADMINC5 + ADMINC6 + ADMINC7) + (TRANC1) Calculation of the indirect costs of the accident: Indirect cost of accident: (PDC1+ PDC2 + PDC4 + PDC5 + PDC6) + (HCC1 + HCC2) + (MEDC2) + (ADMINC2 + ADMINC3 + ADMINC4) + (OTC1 + OTC2) Calculation of the accident costs imposed on the employer: Cost to employer: (PDC1 + PDC2 + PDC3 + PDC4) + (MEDC1) + (ADMINC1 + ADMINC2) Calculation of the accident costs imposed on the worker: Trauma Mon. 2017; 22(1):e26117.
Costs to worker: (PDC5) + (HCC1) + (MEDC2) + (ADMINC3 + ADMINC4 + ADMINC5) + (OTC1 + OTC2) Calculation of the accident costs imposed on society: Costs to society: (PDC6) + (HCC2 + HCC3) + (MEDC3 + MEDC4) + (ADMINC6 + ADMINC7) + (TRANC1) 3.6. Step 6 For statistical analysis, cost data are entered into SPSS 16 statistical software and analyzed via statistical tests. In this study, first, the Kolmogorov-Smirnov test was used to determine the normality of the accident cost data. In the case of the normality of the cost variable, two-way analysis of variance (ANOVA) was used to determine the significance of the cost differences between the types of accidents (PDC, HCC, MEDC, ADMINC, TRANC, and OCT) in relation to the outcomes (death, total disability, partial disability, and long-term and short-term absence), accident costs (direct and indirect), and imposed costs on workers, employers, and the community. The level of significance was P < 0.05.
4. Results 4.1. Practical Example of Calculating Costs in the Construction Industry To clarify the calculation of the amount of costs in accordance with the described steps, a construction project in Tehran, Iran, was examined in 2013. In this project, which aimed to build 30 million units of residential buildings over 5 years with an investment of $100 million, the number of accidents that occurred and the costs associated with the accidents were calculated. In this project, 220 accidents occurred, of which 10 were fatal accidents, 20 resulted in total disability, 30 resulted in partial disability, 40 3
Vatani J et al.
Table 2. Summary of the Classification of Accidents in Terms of Group, Intensity of the Result, and Direct or Indirect Accident
Cost Group
Cases of Cost
Imposed on a Person or Accident
Direct or Indirect Costs
Intensity Result of the Accident
PDC1
Overtime costs
Employer
Indirect
-
PDC2
Additional payments to employer
Employer
Indirect
-
PDC3
Cost of employee turnover
Employer
Direct costs
-
PDC4
Employee training and retraining costs
Employer
Indirect
S3, S4, S5
PDC5
Loss of current income
Worker
Indirect
-
PDC6
Indemnification
Society
Indirect
S3, S4, S5, S2
HCC1
Loss of future earnings
Worker
Indirect
S3, S4, S5
HCC2
Loss of governmental revenue
Society
Indirect
S3, S4, S5, S2-
HCC3
Social welfare payments for lost earning capacity
Society
Direct costs
MEDC1
Threshold of medical payments
Employer
Direct costs
-
MEDC2
Medical and rehabilitation costs
Worker
Indirect
-
MEDC3
Rehabilitation
Society
Direct costs
-
MEDC4
Health care costs
Society
Direct costs
-
Fines and legal sanctions
Employer
Direct costs
-
ADMINC2
Study costs
Employer
Indirect
-
ADMINC3
Travel costs
Worker
Indirect
-
PDC: production disturbance costs
HCC: human capital costs
MEDC: medical costs
ADMINC: administrative costs ADMINC1
ADMINC4
Legal costs
Worker
Indirect
S4, S5
ADMINC5
Cost of death (funeral)
Working
Direct costs
-
ADMINC6
Inspection and examination costs
Society
Direct costs
-
ADMINC7
All travel privileges for workers with total inabilities
Society
Direct costs
-
Welfare costs of welfare payments and tax losses
Society
Direct costs
-
OTC1
Care costs
Worker
Indirect
S4
OTC2
Help and changes
Worker
Indirect
S4
TRANC: transfer costs TRANC1
OTC: other costs
resulted in long-term absence, and 120 resulted in shortterm and minor injuries. The Kolmogorov–Smirnov test indicated the normality of the accident cost data (P = 0.604).
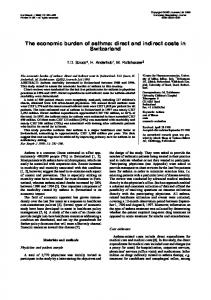
total disability, partial disability, and long-term and shortterm absences. Meanwhile, the lowest costs were MEDC, ADMINC, TRANC, and OTC.
The results in Figure 1 show that the most expensive costs were PDC and HCC in the accidents resulting in death,
Figure 2 shows that most of the costs of accidents resulting in death were imposed on society ($860,000) and
4
Trauma Mon. 2017; 22(1):e26117.
Vatani J et al.
type Deat Total Disability Partial Disability Long - Term Absence Short - Term Absence
Estimated Marginal Means
1500000.00
1000000.00
500000.00
.00
PDC
HCC MEDC ADMNC TRANC OTC
Figure 1. The Cost of Accidents Based on Type and Outcome
Deat Total disability Partial Disability Long - term absence Short - term absence
Estimated Marginal Means
2000000.00
1500000.00
1000000.00
500000.00
.00
4,670,000), while the lowest costs were related to MEDC ($1,390,000, min: 867,000 and max: 1,687,540), ADMINC ($980,000, min: 643,000 and max: 1,340,000), TRANC ($150,000, min: 75,000 and max: 234,000), and OTC ($980,000, min: 543,000 and max: 1,450,000). The differences were statistically significant (P = 0.0001). Statistical analysis for the expression of the difference between the imposed cost of accidents on society, employers, and employees did not show statistically significance (P = 0.511); that is, the highest accident costs are imposed on society, but statistically, no significant differences were detected. A significant difference was observed between the cost of accidents resulting in death, total disability, partial disability, and long-term and short-term absences (P = 0.005), which indicates that the highest costs were related to accidents resulting in total disability ($4,260,000) and partial disability ($3,270,000), and the lowest costs were related to fatal accidents ($1,800,000), long-term absences ($1,960,000), and short-term absences ($840,000). Statistical analysis of the direct and indirect costs of accidents indicated a significant difference (P = 0.019). In other words, the direct and indirect costs of fatal injuries ($290,000 and $1,510,000, respectively), total disability ($820,000 and $3,440,000, respectively), partial disability ($540,000 and $2,730,000, respectively), long-term absence ($480,000 and $1,480,000, respectively), and shortterm absence ($180,000 and $660,000) exhibited several significant differences. 5. Discussion
Worker
Emploter
Society
Figure 2. The Costs of Accidents in Terms of the Costs Imposed on Workers, Employers, and the Community Based on the Type of Accident
workers ($530,000) rather than employers ($410,000). In the accidents resulting in total disability, most of the costs were imposed on community ($2,060,000), followed by workers ($1,480,000) and employers ($960,000). Most of the costs of accidents resulting in partial inability were imposed on workers ($1,290,000), while less were imposed on society ($1,020,000) and employers ($960,000). However, in the accidents resulting in long-term absences, most of the costs were imposed on the community ($80,000) and employers ($760,000), while less was imposed on workers ($400,000). In the accidents resulting in short-term absences, most of the costs were imposed on employers ($480,000), while there were no costs to society. In this study, the maximum calculated costs were related to PDC ($5,680,000, min: 2,340,000 and max: 8,430,000) and HCC ($2,910,000, min: 1,340,000 and max: Trauma Mon. 2017; 22(1):e26117.
The present research considered a construction project that took place in Tehran in 2013. The purpose of this project was to construct a residential building of 30,000 units over 5 years with an investment of $100 million. The numbers of accidents occurring and incidents costs were calculated. In this project, 220 accidents occurred, 10 of which them were fatal accidents, 20 resulted in total disability, 30 resulted in partial disability, 40 resulted in long-term absence, and 120 resulted in shortterm absences and minor injuries. Most of the cost of accidents in construction projects relate to PDC and HCC, while the lowest costs relate to MEDC, ADMINC, TRANC, and OTC; this indicates that, generally, the costs arising from accidents involve loss of work, reduced income, and additional payments, including overtime costs, employee training and retraining costs, loss of current income, indemnification for loss of future earnings, and other costs. Most of the costs arising from accidents resulting in death, total disability, and long-term absences are imposed on society, while the lowest costs are imposed on the employer. However, the maximum cost of the accidents leading to 5
Vatani J et al.
Table 3. Analysis of the Calculated Costs of Accidents in the Construction Industry (in Dollars)a
Cost Group
Death (N = 10)
Total Disability (N = 20)
Partial Disability (N = 30)
Long-Term Absence (N = 40)
Short-Term Absence (N = 120)
Sum of Code’s Costs
PDC: production disturbance costs PDC1
180000
260000
390000
360000
120000
1310000
PDC2
20000
40000
60000
80000
120000
320000
PDC3
10000
20000
30000
40000
60000
160000
PDC4
100000
200000
300000
120000
0
720000
PDC5
50000
200000
600000
400000
120000
1370000
PDC6
500000
1000000
300000
0
0
1800000
HCC: human capital costs HCC1
300000
600000
300000
80000
0
1280000
HCC2
200000
400000
300000
200000
0
1100000
HCC3
100000
200000
150000
80000
0
530000
MEDC1
100000
60000
40000
120000
370000
MEDC2
400000
90000
0
0
490000
MEDC3
100000
0
40000
0
140000
MEDC4
200000
150000
40000
0
390000
MEDC: medical costs
ADMINC: administrative costs ADMINC1
20000
40000
30000
120000
0
210000
ADMINC2
30000
60000
90000
0
120000
300000
ADMINC3
0
20000
0
40000
0
60000
ADMINC4
20000
40000
30000
0
0
90000
ADMINC5
50000
0
0
80000
0
130000
ADMINC6
30000
60000
60000
0
0
150000
ADMINC7
0
40000
0
0
0
40000
30000
60000
60000
0
0
150000
OTC1
10000
20000
30000
40000
0
100000
OTC2
100000
200000
240000
160000
180000
880000
530000
1480000
1290000
400000
300000
4000000
Overall Code’s Costs
P Value
5680000
0.0001
2910000
0.0001
1390000
0.0001
980000
0.0001
0.0001
TRANC: transfer costs TRANC1
150000 980000
OTC: other costs
0.511
Cost imposed on Employee
4000000
Employer
410000
720000
960000
760000
480000
3330000
3330000
Community
860000
2060000
1020000
800000
0
4740000
4740000
290000
820000
540000
480000
180000
2310000
2310000
0.019
Type of cost Direct Indirect
1510000
3440000
2730000
1480000
660000
9820000
9820000
Total
1800000
4260000
3270000
196000
840000
12130000
12130000
a Comparison of accident result P Value is 0.005.
partial disability are imposed on the worker and the lowest is incurred by the employer. Furthermore, in accidents leading to short-term absence, most of the cost is imposed on employers and there is no cost to the community. In other words, accidents with serious consequences such as death and total and partial disability impose a huge cost burden on society, while the employer’s burden is relatively low. This is due to payments for health, treatment, and the welfare system on the part of the community for the treatment and rehabilitation of injured employ-
6
ees and their family. Only in low-impact accidents with milder results, such as short-term absence, are more costs imposed on the employer as additional wage and health payments must be made to the injured worker; in longterm absences, in contrast, a high cost is shouldered by the worker because of the reduced salary. High-cost accidents are those resulting in total inability ($4,260,000$) and partial inability ($3,270,000$), while the accidents with the lowest cost are those resulting in death ($1,800,000), long-term absences ($1,960,000), and short-term absences
Trauma Mon. 2017; 22(1):e26117.
Vatani J et al.
($840,000). This indicates that the adverse effects and the high cost of accidents can cause total and partial disability in the construction industry. The direct and indirect costs of in fatal injuries were $290,000 and $1,510,000; those of total disability were $820,000 and $3,440,000; those of partial disability were $540,000 and $2,730,000$; those of long-term absence were $480,000 and $1,480,000; and those of short-term absence were $180,000 and $660,000, respectively. This shows that the indirect costs of accidents are much greater than the direct costs; moreover, indirect costs mostly influence society and the injured person, and they have irreversible effects on society. According to the present study, the amount of accidents leading to total disability, partial disability, and death are high due to the failure to observe basic safety rules and guidelines. In addition, the high costs of PDC and HCC in the construction industry are due to indemnifications, the cost of training new workers, loss of efficiency and current profits, as so on. In addition to the high incidence of accidents leading to total and partial disability and death in the construction industry, the greatest financial and mental burden is primarily imposed on the community, followed by the family and the injured worker, as this causes increasing financial pressure. It is suggested that new studies should be conducted to provide a control strategy to reduce the number of incidents occurring in the construction industry, as well as to reduce the indirect costs and costs imposed on the community and workers with the aim of increasing welfare and public health. Acknowledgments The authors of this paper would like to take the opportunity to express their gratitude to the research deputy of Tehran University of Medical Sciences, who sponsored this study in the framework of the research plan reg. no: D/93/MB/2792. Footnotes Authors’ Contribution: Javad Vatani, Gebraeil Nasl Saraji, and Mahmood Salesi, writing the first draft and contributing to the final draft and analysis; Abolghasem Pourreza, design of the study, data collection, contributing to the final draft; Iraj Mohammad Fam and Seyed Abolfazl Zakerian, data collection, supervision of the group, contributing to the first draft and final draft, and supervision of the data analysis. Funding/Support: This study was supported by a grant from Tehran University of Medical Sciences, Tehran, Iran.
Trauma Mon. 2017; 22(1):e26117.
References 1. Bakhtiyari M, Delpisheh A, Riahi SM, Latifi A, Zayeri F, Salehi M, et al. Epidemiology of occupational accidents among Iranian insured workers. Safety Sci. 2012;50(7):1480–4. doi: 10.1016/j.ssci.2012.01.015. 2. Mehrdad R, Seifmanesh S, Chavoshi F, Aminian O, Izadi N. Epidemiology of occupational accidents in iran based on social security organization database. Iran Red Crescent Med J. 2014;16(1):ee10359. doi: 10.5812/ircmj.10359. [PubMed: 24719699]. 3. Lopez Arquillos A, Rubio Romero JC, Gibb A. Analysis of construction accidents in Spain, 2003-2008. J Safety Res. 2012;43(5-6):381–8. doi: 10.1016/j.jsr.2012.07.005. [PubMed: 23206511]. 4. Cox SJ, Tait NR. Safety, Reliability and Risk Management: an integrated approach. Butterworth-Heinemann; 1998. 5. Nag PK, Patel VG. Work accidents among shiftworkers in industry. Int J Ind Ergonom. 1998;21(3):275–81. 6. Sanna N. Fatal workplace accidents in outsourced operations in the manufacturing industry. Safety Sci. 2011;49;:1394–403. 7. Ikpe E, Hammond F, Proverbs D. A COST-BENEFIT ANALYSIS (CBA) OF CONSTRUCTION HEALTH AND SAFETY MANAGEMENT: A THEORETICAL DISCUSSION. Management. 2008;1035:1043. 8. Lopez M, Ritzel DO, Fontaneda I, Alcantara O. Construction industry accidents in Spain. Safety Res. 2008;39(5):497–507. 9. Moharamzad Y, Taghipour H, Firoozabadi N, Firoozabadi A, Hashemzadeh M, Mirjalili M, et al. Mortality pattern according to autopsy findings among traffic accident victims in Yazd, Iran. CJT. 2008;11(6):329–34. doi: 10.1016/s1008-1275(08)60067-x. 10. Rasouli MR, Nouri M, Zarei M, Saadat S, Rahimi-Movaghar V. Comparison of road traffic fatalities and injuries in Iran with other countries. CJT. 2008;11(3):131–4. 11. Bahrampour A, Nodoushan R, Shoaa J. Five-year epidemiological study and estimation of accidents distribution in construction industry workers in yazd city by the year 2011 by applying time series model. JKUMS. 2009;16(2):156–64. 12. Vatani S, Salasi M, Bahrampour A, Raei M, Asadi M, Jafari N, et al. An epidemiological study of accidents among construction workers in Kerman. 2011 ;5(4):32–6. 13. Schoenfisch AL, Lipscomb HJ, Shishlov K, Myers DJ. Nonfatal construction industry-related injuries treated in hospital emergency departments in the United States, 1998–2005. Am J Ind Med. 2010;53(6):570– 80. 14. Snashall D. Occupational health in the construction industry. Scand J Work Environ Health. 2005;31 Suppl 2:5–10. [PubMed: 16363441]. 15. Lingard H, Rowlinson S. Behavior-based safety management in Hong Kong’s construction industry. Safety Res. 1998;28(4):243–56. 16. Lowery JT, Glazner J, Borgerding JA, Bondy J, Lezotte DC, Kreiss K. Analysis of construction injury burden by type of work. Am J Ind Med. 2000;37(4):390–9. [PubMed: 10706751]. 17. Aaltonen M, Miettinen J. Computer-aided calculation of accident costs. Hum factors ergon manuf. 1997;7(2):67–78. 18. Dong X, Men Y, Ringen K. Work-related injuries among Hispanic construction workers-Evidence from the Medical Expenditure Panel Survey. Am J Ind Med. 2010 doi: 10.1002/ajim.20799. 19. Teo E, Feng Y. The indirect effect of safety investment on safety performance for building projects. Arch Sci Rev. 2011;54(1):65–80. doi: 10.3763/asre.2009.0090. 20. Feng Y. Effect of safety investments on safety performance of building projects. Safety Sci. 2013;59:28–45. doi: 10.1016/j.ssci.2013.04.004. 21. Jallon R, Imbeau D, de Marcellis-Warin N. Development of an indirect-cost calculation model suitable for workplace use. Safety Res. 2011;42(3):149–64. doi: 10.1016/j.jsr.2011.05.006.
7