ability of resources in a P2P system can be highly variable and unpredictable. ...
derway to develop P2P systems for various applications. [1, 2, 8, 9, 10, 11].
A Game Theoretic Framework for Incentives in P2P Systems Chiranjeeb Buragohain, Divyakant Agrawal, Subhash Suri Computer Science Department University of California Santa Barbara, CA 93106 {chiran,agrawal,suri}@cs.ucsb.edu
Abstract
data in the system might be unavailable for large periods of time—the hosts with those data are offline. Short uptiPeer-To-Peer (P2P) networks are self-organizing, dis- mes also hurt system performance because there are fewer tributed systems, with no centralized authority or infras- servers to download files from. Similarly, as a growing tructure. Because of the voluntary participation, the avail- number of users become free riders, the system starts to ability of resources in a P2P system can be highly variable lose its peer-to-peer spirit, and begins to resemble a more and unpredictable. In this paper, we use ideas from Game traditional client-server system. Theory to study the interaction of strategic and rational If the P2P systems are to become a reliable platform peers, and propose a differential service-based incentive for distributed resource-sharing (storage, computing, data scheme to improve the system’s performance. etc), then they must provide a predictable level of service, both in content and performance. A necessary step towards that goal is to develop mechanisms by which con1 Introduction tributions of individual peers can be solicited and predicted. In a system of autonomous but rational particiPeer-To-Peer (P2P) systems are self-organizing, dis- pants, a reasonable assumption is that the peers can be tributed resource-sharing networks. They differ from tra- incentivized using economic principles. Two forms of inditional distributed computing systems in that no central centives have been considered in the past [4]: (1) monauthority controls or manages the various components; etary payments (one pays to consume resources and is instead, nodes form a dynamically changing and self- paid to contribute resources), and (2) differential service organizing network. By pooling together the resources (peers that contribute more get better quality of service). of many autonomous machines, P2P systems are able The monetary payment scheme involves a fictitious curto provide an inexpensive platform for distributed com- rency, and requires an accounting infrastructure to track puting, storage, or data-sharing that is highly scalable, various resource transactions, and charges for them using available, fault tolerant and robust. As a result, a large micropayments. While the monetary scheme provides a number of academic and commercial projects are un- clean economic model, it seems highly impractical. For derway to develop P2P systems for various applications instance, see [5] for arguments against such a scheme for [1, 2, 8, 9, 10, 11]. network pricing. The democratic (or anarchic) nature of P2P systems, The differential service seems more promising as an inwhich is responsible for their popularity and scalability, centive model, and that is the direction we follow. There also has serious potential drawbacks. There is no cen- are many different ways to differentiate among the users. tral authority to mandate or coordinate the resources that For instance, one could define a reputation index for the each peer should contribute. Because of the voluntary peers, where the reputation reflects a user’s overall contriparticipation, the system’s resources can be highly vari- bution to the system. In fact, a reputation based mechaable and unpredictable. Indeed, in a recent experimen- nism is already used by the KaZaA [2] file sharing system; tal study of Napster and Gnutella, Saroiu et al. [3] found in that system, it’s called the participation level. Quantithat many users are simply consumers, and do not con- fying a user’s reputation and prevention of faked reputatribute much to the system. In particular, they found that tions, however, are thorny problems. (1) user sessions are relatively short; 50% of the sessions In general, since the nodes in a P2P systems are strateare shorter than 1 hour, and (2) many users are free riders; gic players, they are likely to manipulate any incentive that is, they contribute little or nothing. For example, in system. As a result, we argue that a correct tool for modthe Gnutella system, 25% of the users share no files at all. eling the interaction of peers is game theory [6]. We inShort sessions mean that a significant portion of the troduce a formal model of incentives through differential 1
service in P2P systems, and use the game theoretic notion of Nash Equilibrium to analyze the strategic choices by different peers. We treat each peer in the system as a rational, strategic player, who wants to maximize his utility by participating in the P2P system. The utility of a peer depends on his benefit (the resources of the system he can use) and his cost (his contribution). Our differential service model links the benefit any peer can draw from the system to his contribution—the benefit is a monotonically increasing function of a peer’s contribution. Thus, this is a non-cooperative game among the peers: each wants to maximize his utility. The classical concept of Nash Equilibrium points a way out of the endless cycle of speculation and counter-speculation as to what strategies the other peers will use. An equilibrium point is a locally optimum set of strategies (contribution levels in our case), where no peer can improve his utility by deviating from the strategy. While Nash equilibrium is a powerful concept, computing these equilibria is not trivial. In fact, no polynomial time algorithm is known for finding the Nash equilibrium of a general N person game. We first consider a simplified setting, homogeneous peers, where we assume that all peers derive equal benefit from everybody else (homogeneity of peers). In this case, we show (1) there are exactly two Nash equilibria, and (2) there are closed-form analytic formulae for these equilibria. We also investigate the stability properties of these equilibria, and show that in a repeated game setting, the equilibrium with the better system welfare will be realized. We next consider the case of heterogeneous peers, where the interaction matrix is an arbitrary N × N matrix. That is, we allow an arbitrary benefit function for each pair of peers. No closed form solution is possible for this setting, and so we study this using simulation. We use the homogeneous case as a benchmark to see how well the simulation tracks the theoretical prediction. Our main findings are that the qualitative properties of the Nash equilibrium are impervious to (1) exact form of the probability function used to implement differential service, (2) perturbations like users leaving and joining the system, (3) non-strategic or non-rational players, who do not play according to the rules, etc. Finally, we discuss practical ways of implementing a differential service incentive scheme in a P2P system.
2 2.1
pete with each other or try to subvert the system. A P2P systems, on the other hand, consists of autonomous components: users compete for shared but limited resources (e.g. download bandwidth from popular servers) and, at the same time, they can restrict the download from their own server by denying access or not contributing any resources. As such, the interaction of the various peers in a P2P system is best modeled as a non-cooperative game among rational and strategic players. The players are rational because they wish to maximize their own gain, and they are strategic because they can choose their actions (e.g. resources contributed) that influence the system. The behavior that a player adopts while interacting with other players is known as that player’s strategy. In our setting, a peer’s strategy is his level of contribution. The player derives a benefit from his interaction with other players which is termed as a payoff or utility. Interesting economic behavior occurs when the utility of a player depends not only on his own strategy, but on everybody else’s strategy as well. The most popular way of characterizing this dynamics is in terms of Nash equilibrium. Since the utility or payoff of a player is dependent on his strategy, he might decide to unilaterally switch his strategy to improve his utility. This switch in strategy will affect other players by changing their utility and they might decide to switch their strategy as well. The collection of players is said to be at Nash equilibrium if no player can improve his utility by unilaterally switching his strategy. In general, a system can have multiple equilibria.
2.2 Incentives and Strategies in P2P System We assume that there are N users (peers) in the system, P1 , P2 , . . . , PN . We will denote the utility function of the ith peer as Ui . This utility depends on several parameters which we shall discuss below one by one. 2.2.1
Measuring the Contribution
We will use a single number Di to denote the contribution of Pi . The precise definition of Di is immaterial as long as it can be quantified and treated as a continuous variable. For concreteness, we will take Di to be the cumulative disk space: disk space contribution integrated over a fixed period of time, say a week. One can also use other metrics such as number of downloads served by this peer to other peers. For each unit of resource contributed, the peer incurs a cost ci (measured in dollars). So the total cost of Pi for participating in the system is ci Di . We shall find it convenient to define a dimensionless contribution
Our Incentive Model Strategy and Nash Equilibrium
di ≡ Di /D0 ,
A traditional distributed system assumes that all participants in the system work together cooperatively; the participants in the system share a common goal, do not com-
(1)
where D0 is an absolute measure of contribution (say 20MB/week). D0 is a constant that the system architect 2
1
is free to set—our incentive scheme will strive to ensure that all peers make a contribution at least D0 .
0.9 0.8 0.7
The Benefit Matrix
0.6
p(d)
2.2.2
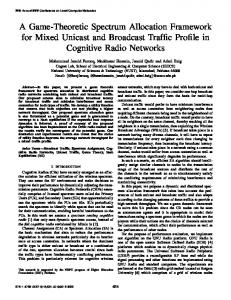
0.5 Each peer’s contribution to the system potentially benefits 0.4 all other peers, but perhaps to varying degrees. We encode 0.3 this benefit using a N × N matrix B, where Bij denotes 0.2 α=1/2 how much the contribution made by Pj is worth to Pi α=1 0.1 α=4 (measured in dollars). For instance, if Pi is not interested α=10 0 0 0.5 1 1.5 2 2.5 3 3.5 4 in Pj ’s contribution, then Bij = 0. In general, Bij ≥ 0, d and we assume that Bii = 0, for all i. Again, we define a set of dimensionless parameters corresponding to Bij by Figure 1: p(d) plotted as a function of d for values of α 1/2, 1, 4 and 10. X X 1 bi (2) bij = Bij /ci , bi = bij , bav = N i j step, requests have high probability of rejection; and for bi is the total benefit that Pi can derive from the system contribution above the step, requests have high probabilif all other users make unit contribution each. bi will turn ity of acceptance. out to be an important parameter in determining whether it is worthwhile for Pi to join the system. We shall show 2.2.4 The Utility Function that there exists a critical value of benefit bc such that if bi < bc , then Pi is better off not joining the system. bav is With these cost and benefit parameters, the total utility Ui simply the average of bi for the whole system. that Pi will derive by joining the system is X Ui = −ci Di + p(di ) Bij Dj , Bii ≡ 0 (4) 2.2.3 Probability as Service Differentiator
j
The differential service is a game of expectations: a peer rewards other peers in proportion to their contribution. A simple scheme to implement this idea is as follows: peer Pj accepts a request for a file from peer Pi with probability p(di ), and rejects it with probability 1 − p(di ). Thus, if Pi ’s contribution is small, its request is more likely to be rejected. There are many enhancements and improvements to this simple idea. One could, for example, curtail the search capabilities of a peer depending on his contribution. In the Napster model, one could return only a fraction p(di ) of the total results found. We also assume that every request from peer Pi is tagged with his contribution di as metadata. We will discuss some of these enhancements and implementation issues in Section 5. It turns out that the choice of the exact probability function does not affect the qualitative nature of our results. Any reasonable probability function that is a monotonically increasing function of the contribution should do. In our analysis, we have chosen the following natural form:
The first term is the cost to join the system, while the second term is the total expected benefit from joining the system. In terms of the dimensionless parameter ui =
Ui ci D0
(5)
X
(6)
we rewrite the utility as ui = −di + p(di )
bij dj , bii ≡ 0
j
The −di term is simply Pi ’s cost to join the system and it increases linearly as Pi contributes more disk/bandwidth to the system. Pi ’s benefit depends on how much the other peers are contributing to the system (dj ), what that contribution is worth to him (bij ), and how probable it is that he will be able to download that content (p(di )). Using the fact that p(0) = 0 and p(∞) = 1, we can find the two limits of the utility function :
dα , α > 0. (3) 1 + dα lim ui = 0, lim ui = −∞. (7) di →0 di →∞ It has the desirable properties that p(0) = 0, and p(d) → 1 as d gets large. The choice of the exponent α determines how “step-function-like” the probability function Thus, neither extreme maximizes a peer’s utility. The is. See Figure 1. For small values, say α = 1, the func- value of an intermediate strategy depends on the contrition is rather smooth; but for larger values, say α = 10, bution of other users and the worth of those contributions. the function has a steep step; for contribution below the See Figure 2 for a graphical representation of a possible p(d) =
3
the peers not to join. The question to ask at this point is whether a Nash equilibrium exists for large enough values of benefits where both peers can derive non-zero utility from their interaction. This model is very similar to the Cournot duopoly model [6] and we can analyze it using similar methodology. Suppose P2 decides to make a contribution d2 to the system. Given this contribution d2 , naturally the best thing for P1 to do is to tune his d1 such that it maximize his utility u1 . Maximizing u1 with respect to d1 , we immediately find that the best response d1 is given by p r1 (d2 ) ≡ d1 = b12 d2 − 1, (10)
Utility
Low benefit Critical benefit High Benefit
0
0
Contribution
Figure 2: A qualitative plot of utility vs. the contribution/strategy; the scales on X and Y axes are arbitrary. Unless there is a critical level of benefit bc , the utility for where r1 (d2 ) is known as the reaction function for P1 . This is the best reaction for P1 , given a fixed strategy for the peer is always less than 0. P2 . Since P2 knows that P1 is going to respond in this fashion, his own reaction function to 1’s strategy is p utility function for different levels of benefit bi . If bi exr2 (d1 ) ≡ d2 = b21 d1 − 1. (11) ceeds a critical value bc , then it is possible for the utility function to have a maximum and only then the peer would Nash equilibrium 1 exists if there is a set of (d∗1 , d∗2 ), such want to join the system. that they form a fixed point for equations 10 and 11, i.e. In the next Section we start with the discussion of Nash the fixed points satisfy equilibrium for the model that we have just described. p d∗1 = b12 d∗2 − 1, p ∗ d2 = b21 d∗1 − 1. (12) 3 Nash Equilibrium in the Homoge-
neous System of Peers
Finding the fixed point is much easier if we assume b12 = b21 = b (this is the homogeneous peer system). In that case d∗1 = d∗2 = d∗ and the solution of equation 12 is
We define a homogeneous system of peers to be a system where bij = b for all i 6= j; in other words in this �1/2 system all peers derive equal benefit from everybody else. d∗ = (b/2 − 1) ± (b/2 − 1)2 − 1 (13) This simplified system allows us to study the problem in an idealized setting, and gain insights that can be applied A solution to this equation exists only if b ≥ 4 ≡ bc . 2 to the more complex heterogeneous system. In the homo- Thus, bc = 4 is the critical value of benefit illustrated in geneous system, the model of equation 6 reduces to Figure 2 below which it is not profitable for a peer to join the system. Note that this critical value 4 is an artifact of u = −d + (N − 1)bdp(d). (8) the form of the p(d) we chose. For different choices of bi = bav = b(N − 1) for all peers Pi . By symmetry, p(d), this constant bc will change, but will always be a therefore, the problem reduces to a 2-person game, which constant independent of the number of∗peers ∗in the system. For b = bc , the only solution is d1 = d2 = 1. For we analyze below. b > bc , there are two solutions
3.1
The Two Player Game
d∗1 = d∗2 = d∗lo < 1, and d∗1 = d∗2 = d∗hi > 1.
In a homogeneous system of two players, Equation 6 reduces to u1 u2
= −d1 + b12 d2 p(d1 ) = −d2 + b21 d1 p(d2 )
(15)
which are plotted in Figure 3 1 For readers versed in game theory, we want to say that we are only interested in pure strategy Nash equilibrium. A mixed strategy will correspond to a peer probabilistically choosing a contribution. Such a scenario is inadmissible and and we shall not discuss it any further 2 For general values of α,
(9)
For algebraic simplicity, let us also assume that α = 1, i.e. p(d) = d/(1 + d). As discussed in Section 2.2, we expect that if the benefits that the peers derive from each other, i.e. b12 and b21 are too small then it will be best for
d∗ =
�
(bα/2 − 1) ± (bα/2 − 1)2 − 1
A solution to this equation exists only if bα ≥ 4.
4
�1/2 �1/α
(14)
4
r1(d 2)
d*hi d*lo
r2(d 1)
3.5
Stable 3
d*
2.5
d2
2
1.5
1
Unstable 0.5
0 0
0.1
0.2
0.3
0.4
0.5
(b−bc)/bc
d1
Figure 3: The Nash equilibrium contributions for the two peer system plotted as a function of scaled benefit (b − bc )/bc . For b < bc , there are no equilibria. For all b > bc there are two possible equilibria
3.2
Figure 4: The Cournot learning process near the vicinity of the two fixed points. Here we have plotted the reaction functions from equations 10,11. For any starting value of d2 > d∗lo (d∗lo is the unstable fixed point), the learning process converges to the stable fixed point. If the starting point is too close to the origin, then the iteration moves away from the unstable fixed point and eventually ends up at 0.
The N Player Game
At this point we can come back to the homogeneous system of peers of equation 8. A comparison of equations 8 and 9 shows that for the homogeneous system of peers, the fixed point equations 12 are now The learning process and convergence is graphically outlined in Figure 4. From the figure we see that under this p d∗ = b(N − 1)d∗ − 1, (16) learning process, either the peers will quit the game (zero utility) or they will converge to the equilibrium d∗hi . Note or in other words that this iterative procedure gives us an algorithm to find � the stable Nash equilibrium of a game and we shall make 1/2 d∗ = (b(N − 1)/2 − 1) ± (b(N − 1)/2 − 1)2 − 1 . use of it in Section 4. The fixed point d∗hi (d∗lo ) is locally (17) stable(unstable), i.e. if the two peers start near the fixed So, with the replacement of b by b(N − 1), the results point, under iteration of the mappings, they will move for the two peer system are exactly applicable for the N closer to (away from) the fixed point. It is gratifying to player system as well. Although the homogeneous peer see that the stable Nash equilibrium d∗hi is also the desirsystem is not realistic, we shall see that the average propable equilibrium for the performance of the system. erties of the Nash equilibria for the heterogeneous system The stability of the fixed points can be estimated by closely follow the homogeneous case. linearizing the mappings r1 and r2 near the fixed point [7]. Consider a point (d∗1 + δd1 , d∗2 + δd2 ) close to the fixed 3.3 Stability of the Nash Equilibria point (d∗1 , d∗2 ). Expanding equation 12 around the fixed Since our system has two possible Nash equilibria, the point, we find that after one iteration, the new deviations natural question arises which equilibrium will be chosen are given by by the system in practice. There is a natural learning scenario between peers which can help us answer this question. Suppose the user P2 sets his contribution to some d2 to start with. In this situation, P1 can use the reaction function r1 (d2 ) to set his optimum contribution at d1 . Seeing this contribution P2 adjusts his own contribution and thus each peer takes turns in setting their contribution. If this process converges, then naturally that level of contribution for P1 and P2 will constitute a Nash equilibrium, i.e. d∗1 d∗2
= r1 (r1 (r1 (r1 (.....(d2 ))))) = r2 (r2 (r2 (r2 (.....(d1 ))))).
�
δd01 δd02
�
�
0 (d∗1 + 1)/(2d∗2 ) (d∗2 + 1)/(2d∗1 ) 0
��
δd1 = δd2 (19) The new deviation will be smaller in magnitude than the p old deviation provided the maximum eigenvalue (d∗1 + 1)(d∗2 + 1)/(4d∗1 d∗2 ) of the matrix on the RHS is smaller than 1. For b > bc , the fixed point (d∗hi > 1), is stable and the other fixed point (d∗lo ) is unstable. For b = bc , the two fixed points collapse into one. The eigenvalues of the matrix are exactly equal to one and the deviations neither increase, nor decrease in magnitude, i.e. (18) the fixed point is neutral. 5
� .
Nash Equilibrium in the Heterogeneous System of Peers
1600
In a heterogeneous system, we need to deal with the full complexity of the model. The fixed point equations for α = 1 can be immediately derived in analogy with the two player game (equation 12) as
1000
1400
1200
Frequency
4
800
600
400
200
1/2 X bij d∗j − 1. d∗i =
0 0
(20)
0.25
0.5
0.75
1
1.25
5
6
1.5
Benefit 70
j6=i
60
Since it is not possible to solve this set of equations analytically, we use an iterative learning model to solve this system of equations.
4.1
Frequency
50
The Learning Model and Simulation Results
40
30
20
10
Let us consider the interaction of users in a real P2P system. Any particular peer Pi interacts only with a limited set of all possible peers — these are the peers who serve files of interest to Pi . As it interacts with these peers, Pi learns of the contributions made by them and to maximize its utility adjusts its own contribution. Obviously this contribution that Pi makes is not globally optimal because it is based only on information from a limited set of peers. But after Pi has set its own contributions, this information will be propagated to the peers it interacts with and those peers will adjust their own contribution. In this way the actions of any peer Pi will eventually reach all possible peers. The reaction of the peers to Pi ’s contribution will affect Pi itself and it will find that perhaps it will be better off by adjusting its contribution once more. In this way, every peer will go through an iterative process of setting its contribution. If and when this process converges, the resulting contributions will constitute a Nash equilibrium. The iterative learning algorithm that we have chosen to solve equation 20 mimics this learning process. To start with, all the peers have some random set of contributions. In a single iteration of the algorithm, every peer Pi determines the optimal value of di that it should contribute given the values of d for other peers and the values of bij . At the end of the iteration the peers update their contribution to their new optimal values. Since now the contributions di are all different, the peers need to recompute their optimal values of di and we can start the next iteration. When this iterative process converges to a stable point, we reach a Nash equilibrium. In the following numerical experiments we demonstrate that for heterogeneous system of peers, the iterative learning process does converge to the desirable Nash equilibrium d∗hi and we compare the results with the analytic results for the system of homogeneous peers.
0 1
2
3
4
7
Contribution
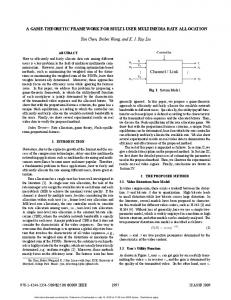
Figure 5: Distributions of benefit and resulting contribution for 1000 peers. The histogram for benefits is the distribution of bij for bij 6= 0. Corresponding bav = P 1 b is 6.0. For contribution, the average is 3.68. ij ij N 4.1.1
Choice of Parameters
We choose the number of peers N to be from 500-1000. Since a peer Pi interacts only with a small subset of its peers, bij is non-zero only for a few values of j. We also assume that the peers for which bij is non-zero are picked randomly from all possible peers. Note that this subset is not the set of neighbors in the overlay network sense, but the set of other peers with whom it exchanges files. The size of the set for which bij 6= 0 is chosen to be 2% of N . In general for smaller value of this fraction, the algorithm takes longer to reach the Nash equilibrium, but the equilibrium itself does not change. The values of bij do not evolve in time and we choose them from a Gamma distribution. The choice of Gamma distribution was arbitrary, we have experimented with Gaussian distribution as well. We choose the initial values of di from a Gaussian distribution. The distribution di evolves at every iteration and eventually converges to the Nash equilibrium distribution. The value of α for all our results is 1.0 unless otherwise specified. 4.1.2
Convergence to Nash Equilibrium
In Figure 5 we show the distribution of bij and di for N = 1000 peers. The values of bij were chosen from a 6
6
10
5.5
9
Average Contribution (d*av)
Average Contribution (d*av)
5 4.5 4 3.5 3 2.5
heterogeneous(500) hetergeneous(1000) homogeneous
1.5
0.1
0.2
0.3
0.4
0.5
0.6
0.7
Scaled Benefit (bav/bc−1)
2.8
0.8
0.9
6 5 4
1 0
1
2.4
2
1.6 1.4 1.2 1
30
40
50
60
70
0.3
0.4
0.5
0.6
0.7
In Figure 7 we show the approach to convergence for the learning algorithm. The two data sets correspond to different values of average bav . Higher the average value of bav , faster is the convergence to equilibrium. As the value of bav approach the critical value bc , approach to equilibrium becomes slower and slower. This is to be expected since we have argued in Section 3.3 that near the critical point, any deviation dies out very slowly. We have observed that for a wide set of initial conditions for di , the process always converges to a unique Nash equilibrium. For very small initial values of di , we are close to the unstable Nash equilibrium and the iteration converges to zero, i.e. the contribution by all peers vanish and the system collapses. The data for system collapse is not shown, but Figure 4 illustrates the situation.
1.8
20
0.2
Figure 8: Average contribution at Nash equilibrium plotted against fraction of peers alive. Total number of peers is 1000. The solid lines are predictions from the homogeneous system model (equation 13).
2.2
10
0.1
Fraction of Failed Peers
b /b −1= 0.30, N=500 av c b /b −1=0.30, N = 1000 av c b /b −1=0.05, N = 500 av c bav/bc−1=0.05, N = 1000
2.6
Average Contribution (d*av)
7
2
Figure 6: Average contribution at Nash equilibrium plotted against average benefit for 500 and 1000 peers. The solid line is the prediction from the homogeneous system (equation 13).
0.8 0
homogeneous homogeneous homogeneous
8
3
2
1 0
bav/bc−1 = 0.5 bav/bc−1 = 1.0 bav/bc−1 = 2.0
80
90
100
Number of Iterations
Figure 7: Average contribution at Nash equilibrium plotted against number of steps required to reach Nash equilibrium for 500 and 1000 peers. We assumed convergence was reached when the average contribution per peer differed no more than one part in a million. The average initial value of contribution per peer is 1.0. The values of average benefit are scaled as usual.
4.1.3
Inactive or Uncooperative Peers
In Figure 8, we show the effect of some peers leaving the system. Intuitively one would think that if some peers leave the system, the benefit per peer would be reduced and we should be seeing pretty much the same behavior as in Figure 6. Our simulations confirm this intuition. As the fraction of active peers dwindle, the contribution from each of the peers decrease and at some point, the benefits are too low for the peers and the whole system collapses. The system can be pretty robust for high benefits : for a benefit level of (bav − bc )/bc = 2.0, the system can survive until 2/3 of the peers leave the system. In contrast to traditionally fragile distributed systems, we see that for P2P systems robustness increase with size : as the system grows bigger and bigger, benefits for each peer increases and the system becomes more robust to random fluctuations. In Figure 9 we explore the effect of having peers which behave uncooperatively, i.e. they refuse to adjust their contribution and simply make a constant contribution.
Gamma distribution such that bav = 6.0. The equilibrium values d∗i distribute themselves in a bell shaped distribution with mean d∗av = 3.68. If the system was completely homogeneous, than the distribution of bij would consist of a single peak at b = bav /(N − 1) and the corresponding value of d∗hi from equation 17 would be 3.73 which is less than 1.5% away from the value of d∗av . In Figure 6 we show the equilibrium average contribution by the peers as a function of average benefit. The solid line is the solution from the homogeneous system. As expected, the equilibrium contribution increases monotonically with increasing benefit. For average benefit bav < bc , the iterative algorithm converges to di = 0. Note that the two sets of results for 500 and 1000 peers almost coincide with each other. So our results are essentially independent of system size. 7
4
3.5
Average Contribution (dav)
for a small duration of time. In our discussion we have assumed that the function p(d) is same for all users, i.e. it is part of the system architecture which can not be modified by users. For greater flexibility, it is possible to allow individual peers to configure p(d), but the effects on overall system performance is not clear. The contribution is measured in terms of uptime and disk space. When a peer makes a request for a file, the contribution information can be attached as an extra header to the request. In fact, the current Gnutella protocol already sends metadata like shared disk space and uptime with its request messages. New users can be given a default value of contribution for a limited period of time so that they can start using the system at a reasonable level. There is incentive for peers to misreport contributions so that they can reap the benefit of the system while making no contribution. To prevent such misuse, it is possible to implement a neighbor audit scheme. Such a scheme is especially attractive in a fixed network topology such as the CAN [9] or Chord [10] system. Every peer will continually monitor the uptime and disk space of its neighbor. If any doubt exists about the accuracy of the information reported by a peer, the information can be verified from its neighbor.
d = 2.0 av dav = 1.0 d = 0.75 av dav = 0.50
3
2.5
2
1.5
1
0.5 0
0.2
0.4
0.6
0.8
1
Fraction of Uncooperative Peers
Figure 9: Average contribution at Nash equilibrium plotted against fraction of uncooperative peers. Total number of peers is 1000. The labels specify the average contribution of uncooperative peers. Average benefit is bav /bc − 1 = 0.5.
The effect of such non-cooperative peers is clear. If they constitute 100% of the peers, of course the average contribution is equal to their contribution. Otherwise their effect is to bias the equilibrium contribution value toward them.
5 Discussion
5.2
In this paper we have proposed a differential service based incentive mechanism for P2P systems to eliminate free riding and increase overall availability of the system. We have shown that a system with differential incentives will eventually operate at Nash equilibrium. The strategy of a peer Pi wishing to join the system depends on a single parameter bi which is the benefit that Pi can derive from the system. If the benefit bi is larger than a critical benefit bc , then the peer’s best option is to join the system and operate at the Nash equilibrium value of contribution. If on the other hand bi < bc , the peer is better off not joining the system. When bi = bc , the peer is indifferent between these two options. These properties are robust and do not depend on the details of the particular incentive mechanism that is used.
5.1
Alternative Metrics for Contribution and Incentive
We have touched upon only a handful of questions that are relevant to building a reliable P2P architecture with incentives. There are many unresolved issues which will have to be addressed in future by system architects. For example, what is the best metric for the contribution of a user? A popular metric is the number of uploads provided by a peer. So the peers that provide the most popular files and have the highest bandwidth are deemed to contribute the most. Our metric, which simply integrates disk-space over time does not discriminate against low bandwidth peers or peers which provide file which are not very popular. Such a metric is very appropriate for a project like Freenet [11] which aspires to be an anonymous publishing system regardless of the popularity of the documents published. The metric that is in practical use by KaZaA is called participation level and is given by
Implications for System Architecture
The incentive policy that we have discussed can be implemented with minor modifications to current P2P systems. Let us look at some of the modifications required. Current P2P architectures do not restrict download in any way except by enforcing queues and maximum number of possible open connections. Our incentive scheme is easily implemented by accepting requests from peers with a probability p(d). To prevent rapid fire requests from the same peer, it will be necessary to keep record of a request
participation level =
uploads in MB × 100. (21) downloads in MB
The participation level is capped at a maximum of 1000. Our analysis of incentives relied on the peers being rational and trustworthy. Trust is not easy to enforce. The neighbor audit scheme will deter individual misbehavior, but collusion among a set of peers is still possible. Another trust related problem involves malicious peers who 8
contribute fake files. The idea of EigenTrust [12] is a sig[8] A. Rowstron and P. Druschel, Pastry: Scalable, disnificant step in this direction which also protects against tributed object location and routing for large-scale collusion among malicious peers. peer-to-peer systems. IFIP/ACM International ConThe incentive scheme we have outlined is through seference on Distributed Systems Platforms (Middlelective denial of requests. There are other ways to impleware), 2001 ment incentives. For example one could implement differential service for Pi by restricting the download band- [9] S. Ratnasamy, P. Francis, M. Handley, R. Karp, and S. Shenker A scalable content-addressable network. width to a fraction p(di ) of the total bandwidth available. Proc. of the 2001 conference on applications, techKaZaA’s participation level operates on a similar princinologies, architectures, and protocols for computer ple: if more than one peer requests the same file, the peer communications, ACM Press, 2001. with smaller participation level is pushed to the back of the queue. [10] I. Stoica, R. Morris, D. Karger, M. Frans Kaashoek, Instead of implementing incentives on download level, and H. Balakrishnan, Chord: A Scalable Peer-toone could also restrict the search capabilities of a peer. peer Lookup Service for Internet Applications, Proc. The basic idea is to reduce the number of peers to which of the 2001 conference on applications, technoloqueries are propagated. In Gnutella, a peer forwards a gies, architectures, and protocols for computer comquery to its neighbors based on the Time To Live (TTL) munications, ACM Press, 2001. field. By reducing the TTL of the query or by forwarding the query only to a fraction of the total neighbors, the [11] The Free Network Project, search space for the query can be restricted. http://freenet.sourceforge.net (22) [12] S. D. Kamvar, M. T. Schlosser, H. Garcia-Molina, The EigenTrust Algorithm for Reputation ManageWe note that the effect of restricting search using a funcment in P2P Networks Proc. of the Twelfth Internation p(d) is not equivalent to restricting download using tional World Wide Web Conference, May, 2003 the same function. Network topology will have a significant role to play in determining the actual set of files that a user has access to. Regardless of the actual implementation of incentives, our conclusions concerning existence and properties of the Nash equilibrium in the system will remain qualitatively unchanged. scaled TTL for Pi = dp(di ) × initial TTLe
References [1] Gnutella, http://gnutella.wego.com [2] KaZaA, http://www.kazaa.com [3] S. Saroiu, P. K. Gummadi, S. D. Gribble, A Measurement Study of Peer-to-Peer File Sharing Systems, Proc. of Multimedia Computing and Networking 2002 (MMCN ’02) [4] P. Golle, K. Leyton-Brown, I. Mironov, M. Lillibridge, Incentives for Sharing in Peer-to-Peer Networks, Proc. of the 2001 ACM Conference on Electronic Commerce. [5] A. M. Odlyzko, The history of communications and its implications for the internet, http://www.research.att.com/∼amo/ [6] D. Fudenberg and J. Tirole, Game Theory, MIT press, Cambridge MA (1991). [7] H. Moulin, Game Theory for Social Sciences, NYU Press, New York, NY (1986). 9