A GENERAL PURPOSE SILICON BASED ELECTROCHEMICAL SENSOR - DEVELOPMENT AND CHARACTERIZATION 1
2
Marcelo B. A. Fontes , Rogério Furlan , Jorge J. Santiago-Avilés 3† and Koiti Araki4‡ Laboratório de Sistemas Integráveis (LSI) Escola Politécnica da Universidade de São Paulo São Paulo, SP, Brasil, 05508-900 Tel. +55 11 818 5657, Fax. +55 11 818 5665 ‡
Instituto de Química da Universidade de São Paulo †
University of Pennsylvania (USA)
1
[email protected],
[email protected],
[email protected],
[email protected]
ABSTRACT An array of microelectrodes based on silicon planar technology was developed, composing a general purpose electrochemical sensor. This work describes the design, process sequence and electrochemical characterization of the sensor using well known chemicals - K3[Fe(CN)] 6 and K4[Fe(CN)] 6. Typical dimensions of the sensor are: a length of 10 mm and a width of 3 mm. It contains 8 gold working electrodes (10 µm x 10 µm), a Ag/AgCl reference electrode and a gold counter electrode (2 mm x 0.5 mm). This array can perform multichannel recording at different positions in static measurements as well as in flow injection analysis (FIA). The electrode structures were analyzed by SEM and AFM. Electrochemical measurements were performed to evaluate the continuity of the lines, the cleanness of the electrodes surface and relative electrode areas. The obtained results reveal the importance of electrodes surface cleanness in the sensor response. The application of simple electrochemical experiments to characterize the sensor was also shown.
INTRODUCTION Electrochemical sensors have had a tremendous development in many different applications1-2 from pH determination, gas sensing and analysis of complex biological molecules. Microelectrode based electrochemical sensors present many advantages such as3-4: small size, possibility of in situ measurements and require small amount of the samples. There are many different ways to produce microelectrodes5 including extrusion made glass micropipets, carbon flame polished fiber, and silicon based processing. Microelectronics technology have been used to produce microelectrodes6-8 because of its well known characteristics, including: batch fabrication of many electrodes, easy shape definition by computer designed photomasks, high reproducibility and low cost. We have developed a general purpose silicon based electrochemical sensor composed of an array of microelectrodes. Electrochemical experiments were performed to evaluate the sensor assembly, electrodes cleanness and relative electrodes area. Our final goal is the detection of the activity of biologically important molecules such as nitric oxide (NO). This is vital in many studies in 4, 9-11 vitro, and in vivo as well as in the diagnostic and therapy .
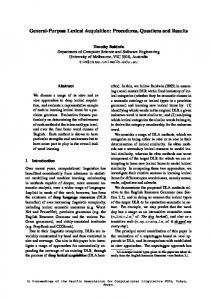
SENSOR DESIGN AND FABRICATION The sensor is composed of a silver/silver chloride reference electrode, a gold counter electrode (2 mm x 0.5 mm) and 8 gold working electrodes (10 µm x 10 µm). In order to reduce the electrolyte resistance in the electrochemical measurements, the reference electrode was placed as close as possible to the working electrodes. The counter electrode was placed relatively far from them, to minimize the interference of the chemical species generated on it. One feature that has to be pointed out is related to the counter electrode area. It has to be at least 10 times larger than the working electrodes12. In our case this factor is about 10,000. Figure 1 shows SEM images of the fabricated sensor where the contact pads and the working, reference and counter electrodes can be seen. 7
6
5
8
4
9
3
10
2
11
1
Si3N4
SENSOR 3 x 10 mm
Working Au 10 x 10 µm
Contacts Pads Au
Reference
0.5 x 0.5 mm
Ag/AgCl
Counter Au 2 x 0.5 mm
Lines 20 µm
Figure 1 - SEM image of the sensor front side and details. The devices were fabricated using a planar silicon technology, according to the sequence schematically represented in Figure 2:
Figure 2 - Sensor fabrication steps, showing the cross section of the working electrodes.
a)Wet oxidation of 2" silicon wafers (p type, orientation: , resistivity 1 - 10 Ωcm) to obtain at least 1 µm of SiO2; b)NiCr e-gun evaporation (adhesive material); c)Gold film e-gun evaporation (300 nm); d)Gold and NiCr electrode lines (20 µm wide), contact pads (500 µm x 500 µm), reference (68,800 µm2) and counter (2,000 µm x 500 µm) electrode areas, patterning with mask 1; e)Si3N4 deposition by sputtering (~300 nm); f)Si3N4 plasma etching (CF4+O2) over contacts, working, counter and reference areas, defined by mask 2, using a negative photoresist as a etching mask; g)Scribing to individuals sensors; q)Wiring bonding to a carrier; r)Selective silver electrodeposition and silver chloride formation by chemical reaction, on the reference electrode. ANALYSIS PROCEDURES Surface structures and electrode roughness were analyzed with Scanning Electron Microscopy (SEM) - PhillipsTM - and Atomic Force Microscope (AFM) - NanoScope®. Electrochemical experiments were performed to check the continuity of the lines, electrode surface cleanness and relative electrode areas. A simple potentiometric technique3,12 was used to evaluate the continuity of lines from the carrier contact to the open areas of the electrodes. For this purpose the electrodes were immersed in a solution of well known chemicals: 10 mM of K3[Fe(CN)]6 plus 10 mM of K4[Fe(CN)]6.H2O, using 0.1 M KCl as the electrolyte and an external Ag/AgCl reference electrode. A difference in potential between the sensor electrodes and the reference was measured by a standard digital voltammeter. This potential is governed by the Nernst equation12:
E = E0 +
[OX ] RT ln nF [ RED]
(1)
where E is the potential difference related to a given reference, E0 is the standard redox potential, R is the gas constant, T is the temperature, n is the number of electrons in the redox reaction, F is the Faraday constant, and [OX]/[RED] is the ratio of oxidant and reductant concentration. Since we have the same concentration of reductant and oxidant - Fe(CN)6-3 and Fe(CN)6-4 respectively, the measured potential difference given by equation 1 is only due to E0, which is very well known and has a value of +0.356 V against a hydrogen reference electrode or 0.136 V against a silver/silver chloride. Therefore the measured potentials indicate the continuity of the interconnection lines and window openings of the electrodes. However if the sensor lines present short circuits or there is some opening in the silicon nitride other than expected, we still can record the same potential since it is not dependent on the size of the exposed area. All the eleven contacts were analyzed before and after a cleaning step. At this point the sensor reference electrode was not covered with silver and silver chloride. In order to verify the microelectrodes relative areas and its cleanness, we used other technique called cyclic voltammetry3,12, performed by a computer controlled electrochemical workstation EG&G 283 PAR®. This experiment is based on a redox process of an ion, produced by sweeping the electrode potential and recording the current (I) generated from the electrons exchanged between the electrode and the ion. For a constant sweeping rate, this current is directly proportional to the electrodes exposed area (A) and to the redox species concentration (C)3,12, equation 2. Ipeak represents the diffusion current.
I peak α A C
or
I peak = k C
(2)
The cleaning process was performed by sweeping the potential from - 800 mV to 1 V related to silver/silver chloride at 500 mV/s, in 0.1 M KCl solution. This procedure promotes essentially two events: the oxidation of water and chloride ions around 1 V, which may attack the organic materials adsorbed on the electrode surface, also gold may dissolve exposing a fresh and clean surface. In order to determine the relative electrode area, the sweep rate was kept constant (0.1 V/s) and the K3[Fe(CN)]6 concentration was varied from 1mM to 10 mM (2.5 mM step). From equation 2 a linear relationship between the peak current and the concentration is expected. This proportionality factor is related to the electrode area. This procedure was performed to all the eight working electrodes and an external reference electrode was used. Figure 3 presents photos of the system used for the potentiometric and cyclic voltammetry experiments.
a) Electrochemical Workstation EG&G 283
Electrode connections
PC Sensor
c)
b)
K3[Fe(CN)]6 solution External reference electrode
Sensor carrier
Figure 3 - Photos of the experimental apparatus: a) the electrochemical workstation used for the cyclic voltammetry experiments; b) detail of the sensor immersed in the solution and the external reference electrode; c) assembled device.
RESULTS AND DISCUSSION The data from the potentiometry experiments indicated that all analyzed electrodes were conducting. The equilibrium potential measurements before and after the cleaning process is showed in the figure 4. Before the cleaning it was observed that both reference (contact pad number 6 - see figure 1) and counter electrodes (contact pads numbers 1 and 11) showed values around 219.5 mV and a mean value of 216.4 mV was measured for the working electrodes. After cleaning, all measured potential were around 219 mV. These results indicate that the working electrodes surfaces were contaminated and apparently the contaminants were removed by the cleaning process. It is also observed in the figure 4 that the cleaning process did not affected the measured potential of the larger electrodes, probably because some areas of them were not contaminated. The absolute values obtained are higher than the thermodynamic (136 mV), indicating that somehow the ferrocyanide / ferricyanide solution were not prepared with the expected concentration. 222
222
Before cleaning
221
221
219 218 217 216 215 214 213
219 218 217 216 215 214 213
212
212
211
211
210 0
After cleaning
220
Potential difference mV|Ag/AgCl
Potential difference mV|Ag/AgCl
220
1
2
3
4
5
6
7
8
9
10
11
12
Contact number Electrodepad number
210 0
1
2
3
4
5
6
7
8
9
10
11
12
Contact number Electrode pad number
Figure 4 - Equilibrium potential measurements of the electrodes before and after the cleaning process. The electrode response during the cleaning process is showed in the figure 5. It is clearly observed that the current keeps increasing during the fast potential sweep until it reaches a fairly constant value. At this point we assumed that the electrode was clean.
Final condition
Initial condition
Figure 5 - Evolution of the electrode response during the cleaning process.
Figure 6 shows the influence of the electrode cleanness in the sensor response for a 10 mM of the K3[Fe(CN)]6. The sensor sensitivity increased by a factor of 5 after the cleaning process and its response indicates that the electron transference in the redox reaction become faster. It was also observed a slight difference in the sensor response after a couple of hours. After a cleaning step the response returned to the previous value, indicating the importance of cleaning the surface before each experiment. It is important to note that this cleaning process represents a practical alternative where the regular mechanical polishing can not be performed. It has also the advantage of being an in situ process. -125
After cleaning
-100
Current (nA)
-75
-50
Before cleaning -25
0
25 700
500
300
100
-100
-300
-500
Potential (mV) | Ag/AgCl
Figure 6 - Influence of the electrode cleanness on the sensor response. Figure 7 presents the results for one of the working electrodes. Figure 7a displays the cyclic voltammograms. The expected linear increase of the peak current with the ferrycianade concentration was observed (figure 7b).The peak current was evaluated at -200 mV for all concentrations. 120
-140
urrent (nA)
-100
-80
1 mMmM
100
2.5 2.5mM mM 5 5 mMmM 80
7.5 7.5mM mM 10 10mM mM
Peak current (nA)
-120
Y=A+B*X --------------------------------Param. Value sd --------------------------------A -0,01429 0,52892 B 10,04176 0,09436 --------------------------------R = 0,99982 SD = 0,82175, N = 6 P = 4,6762E-8
-60
Ipeak
60
40
20
a)
b)
0 0
2
4
6
8
10
12
[ Fe(CN)6-3 ] (mM)
Figure 7 - Results for the sensor characterization: a) working electrode response in the cyclic voltammetry experiment for increasing ferricyanide concentrations; b) peak current as a function of the Fe(CN)6-3, evaluated at -200 mV.
As indicated by equation 2, the slope (k) of the current x concentration curve is proportional to the electrode area. This parameter is important to calibrate individually the electrodes. Table 1 presents a comparison between all eight electrodes. A variation of up to 31 % was observed. Previous SEM analysis showed no significant difference in the electrodes geometry. The same results were obtained by AFM, figure 8, were the measured roughness was about 4.7 nm in all electrodes. This geometric reliability is a important characteristic of the silicon planar technology used to fabricate the sensor, producing electrodes that are virtually identical. Table 1. Results for the electrode relative area. All measurements presented at least 0.99 of correlation. Contact Proportionality Difference related number* factor (k) to number 8 (A/M) x 10-6 (%) 2 8.2 18 3 9.8 2 4 9.8 2 5 7.5 25 7 6.9 31 8 10.0 0 9 7.2 28 10 9.8 2 (*) see figure 1.
Figure 8. - AFM image from one of the working electrodes. The measured roughness is about 4.7 nm. We speculated that the variations observed in the electrodes response can be attributed to some remaining surface contamination and not to problems during the microfabrication process. These results show the importance of the electrode cleanness in the sensor response and the application of a simple electrochemical experiments to characterize it.
CONCLUSION This paper described the design, fabrication and characterization of an array of microelectrodes based on silicon planar technology, composing a general purpose electrochemical sensor. It consists of 8 gold working electrodes, a Ag/AgCl reference electrode and a gold counter electrode. This device can perform multichannel recording at different positions in static measurements as well as in flow techniques. A simple potentiometric technique at equilibrium indicated continuity of the lines from the carrier contact to the open areas for all electrodes. Before the cleaning process, it was observed that large electrodes presented higher equilibrium potential. After cleaning all electrodes presented similar results. This can be explained by some surface contamination removed in the cleaning step. The sensor sensitivity increased by a factor of 5 after the cleaning step and its response indicates a faster electron transfer process in the redox reaction. The working electrodes analyzed by SEM and AFM showed a smooth surface with roughness about 4.7 nm. No significant variation was observed between them. The microelectrodes response for different ferricyanide concentrations showed slope variations up to 31% between electrodes. We speculated that these variations can only be attributed to some remaining surface contamination and not to their geometry. These result shows the important role of the electrode cleanness in the sensor response and the application of simple electrochemical experiments to characterize the sensor. We are going to use this sensor in the detection of the activity of biologically important molecules such as nitric oxide. ACKNOWLEDGMENT The authors wish to acknowledge the support offered by FAPESP (contract 96/8274-5), LME/USP for the wire bonding process, IFUSP for the AFM analysis and the facilities of the Center for Sensor Technology at UPENN. The authors also wish to special thanks all help offered by Mr. Vladimir Dominko at UPENN. REFERENCES [1] Seyama, T; Chemical Sensor Technology, vol. 1, chap. 1. Elsevier, 1988. [2] Mendelson, Y.; IEEE Engineering in Medicine and Biology, June/July 1994. [3] Montenegro, M.I at al; Microelectrodes: Theory and Applications; Proceedings of the NATO Advanced Study Institute on Microelectrodes: Theory and Applications, Alvo, Portugal, May 14-26, 1990 [4] Malinsky, T.; Taha, Z; Nitric Oxide Release from Single Cell Measured In Situ by a Porphyrinic-Based Microsensor; Nature, vol 358, August, 1992. [5] Cobbold, R.S.C; Transducers for Biomedical Measurements: Principles and Applications; John Wiley & Sons, cap. 10 (3), 1974. [6] Madou, M.J.; Morrison, S.R.; Chemical Sensing with Solid State Devices, Academic Press, 1989. [7] Takahashi, K. and Matsuo, T.; Integration of Multi-Microelectrode and Interface Circuits by Silicon Planar and Three-Dimensional Fabrication Technology; Sensors and Actuators, vol.5, no.1, pp.89-99, 1984. [8] Najafi,K.; Wise, K.D.; Muchizuki, T.; A High-Yield IC-Compatible Multichannel Recording Array, IEEE Trans. Elect. Dev., vol ED-32, No.7, July 1985. [9] Fontes, M. B. A. et. al.; Developmet of an Electrochemical Sensor Based on Silicon Technology; Proceedings of the XII Congress of the Brazilian Microelectronic Society, Caxambu , MG, Brazil, 1997. [10] Fontes, M. B. A. et. al., Detection of NO Using NI-Porphyrins and a Self-Assembled Monolayer of Hemopeptide as Modified Electrodes for a Silicon Integrated Microsensor, Electrochemical Society Proceedings Volume 95-27, 1995, 192. [11] Pilloud, D.L.; Fontes, M.B.A.,. et al, Formation of Self-Assembled Monolayer of Heme and Synthetic Hemopeptide on Gold: Interaction wiith Nitric Oxide and Carbon Monoxide. Proceedings, Eurosensors IX Transducers '95, p.863-866, 1995. [12] Brett, C.M.A. and Brett, A.M.O.; Electrochemistry - Principles, Methods, and Applications; Oxford University Press, 1994. [13] Atkins, P.W.; Beran; J.A.; General Chemistry, Scientific American Books, ed. 2, 1990.