VISUALIZING THE PROCESS A Graph-Based Approach to Enhancing System-User Knowledge Sharing
Tamara Babaian, Wendy Lucas and Heikki Topi CIS Department, Bentley College, Waltham, MA 02452, USA
[email protected],
[email protected],
[email protected]
Keywords:
User interface design methodologies, enterprise-wide systems, enterprise resource planning, usability.
Abstract:
Our research is concerned with developing design guidelines aimed at improving the usability of enterprisewide information systems by employing collaborative problem solving as a model for user-system interaction. In this paper, we present our approach to addressing a critical design issue that we identified through our field research: namely, system-to-user communication involving components of a complex process flow. This approach uses a dynamic process graph and a set of related task links that are displayed alongside the traditional ERP task interfaces. We outline the collaborative framework and position our solution within it. This solution can benefit other application areas, especially those that involve protracted processes that are not familiar to the user.
1
INTRODUCTION
Enterprise Resource Planning systems (ERPs) are organizational management systems that integrate business processes throughout the entire enterprise. These processes typically span multiple functional areas, from manufacturing to accounting to customer service and so forth. Such integration provides the key benefit of using an ERP system by ensuring consistent automation of different business functions as well as a comprehensive view of an enterprise’s resources. The benefits of using an ERP system, however, can come at a great cost. Implementation of such a system in an organization often involves realignment of the business processes to fit the system’s model. Extensive training of personnel to use a multi-module, multi-functional system for their daily operations is also required. The costs of system implementation and training typically far exceed the price of the software. Yet, despite the magnitude of the investments in both dollars and time allocated to these activities, ERP projects sometimes fail to deliver their promised benefits. This is at least partly attributable to the poor usability characteristics of the systems’ interfaces, as reported in (Gilbert, 2003; Topi et al., 2005). Our long-term goal is to demonstrate how the us-
ability of organizational systems can be improved by developing design guidelines that are based on a collaborative model of user-system interactions. In this paper, we describe a key portion of this effort. A field study (Topi et al., 2005) indicated that one of the major obstacles to the effective use of an ERP system is the user’s lack of understanding of the relationships between the individual subtasks within a business process. To address this problem, we have developed a method for improving the transparency of the system’s process model and the accessibility of its components. This method consists of augmenting the user interface with: 1. an interactive process graph, which visualizes the steps of the process and enables easy navigation and progress monitoring, and 2. a readily accessible list of links to related processes. The purpose of the process graph is to communicate the critical process flow information that is largely hidden from the users, thus improving their understanding of the process and its individual components. The graph is always displayed and is updated dynamically to reflect the user’s progress through the process. It is also useful as a navigation
123
ICEIS 2007 - International Conference on Enterprise Information Systems
tool for previewing the steps following the current task or reviewing previously completed steps. The latter feature is important for recall and diagnostic purposes, considering that the business processes are typically completed by several people over a course of days or even weeks. Related links are displayed for simplifying navigation to those subtasks that are most commonly relevant to the current process. Although these subtasks are typically accessible via menus in standard ERP systems, menu items are hidden until the user chooses to explore a particular option; by contrast, related links in our design are always on display and are therefore more noticeable and easier to access. The key contribution of this paper is a method for improving the user’s understanding of a business process implemented by a system via a graphical representation of that process. The novelty of our approach comes from embedding the process visualization as an active component within the interface. Compared to other work linking the importance of process understanding to usability, e.g. (Basu and Blanning, 2000; Lieberman and Wagner, 2003; Kobti and Sundaravadanam, 2006; Schmid and Rossi, 2004), our solution supports time-extended processes involving multiple users of a multi-module enterprise system. Following is a discussion of our use of collaboration as an informing design paradigm within the ERP system context. In Section 3, we present the findings from our field work that describes the problem and motivates our solution. We then position that solution within the collaborative design framework. Section 4 presents our solution, i.e., a process graph and related tasks links that have been incorporated into our prototype implementation of an ERP interface. An initial evaluation of this prototype is described in Section 5. Section 6 reviews the related work, while conclusions and future work are discussed in Section 7.
2
COLLABORATION AS A MODEL FOR USER INTERFACE DESIGN
An approach to interface design that is inspired by collaboration theory (Bratman, 1992) has been articulated in (Grosz, 2005; Shieber, 1996) and applied to the design of applications in several domains, e.g. (Rich et al., 2001; Babaian et al., 2002). This approach views the process of using a system as a collaboration between humans and computers involved in a problem solving effort. Compared to a more traditional view, this implies a realignment of the role
124
that the computer system plays to being a collaborative partner with its users rather than just being a repository of data and tools that can be accessed and utilized. Such a realignment can potentially lead to the design of a system that provides superior support for effective problem solving. In general terms, a collaborative approach to interface design implies, first of all, that the allocation of responsibilities between a human and a computer system must be done according to each party’s strengths. Furthermore, the parties need to be able to communicate effectively regarding their plans for the task and share any knowledge that is relevant to each other’s part in the process. The parties must also be aware of the context for such communication in order for it to be effective. Last but not least is the requirement to assist a partner in need of help. While this paradigm is appropriate for any information system design, it is particularly vital for ERP systems. These system possess a wealth of knowledge in the form of data, processes, reporting capabilities, and analysis methods that are designed to meet the needs of all of their users, thereby placing a tremendous burden upon the individual to find and utilize the subset that is relevant to her purposes. By realigning the role of the system to that of a helpful and responsive partner, it can interact with the user in a far more productive manner. In particular, it should make the user aware of the interdependencies between the data and the processes and between the different processes themselves. This is essential knowledge for becoming a competent and confident system user who can navigate the system, successfully utilize the components required for a task, and make the most of the available resources. As reported in (Topi et al., 2005) experience shows that even with extensive training and readily available documentation, a small minority of users actually achieve this level of competence in utilizing ERP systems.
3 FINDINGS FROM THE FIELD To gain some insight into the everyday experiences of ERP users, we carried out a field study in a division of a Fortune 500 company that had been using an ERP system for a little more than two years at the time. Semi-structured interviews were conducted with ten employees who ranged from production floor workers to middle and high level managers. Our analysis of those interviews revealed multiple categories of usability problems, which have been reported in (Topi et al., 2005). For this paper, we would like to focus on one of
VISUALIZING THE PROCESS - A Graph-Based Approach to Enhancing System-User Knowledge Sharing
the critical flaws we observed in the design of the ERP system, which has to do with the lack of information transparency and of information sharing between the system and the user. Each comprehensive business process consists of a series of smaller subtasks/transactions, and each user is typically involved in only a part of the overall process. To use the system most effectively, the users must understand the overall process flow and the semantic relationship between the different components, namely transactions and data items. The critical flaw is that the ERP interface presents only a fragmented view of a specific transaction or a portion of the data. Even with initial and continued training, very few users are able to reconstruct the system’s process model and use it to their advantage. What is unique about these users is that they “understand the inner workings of what’s going on.” This understanding is achieved with a great deal of effort on their part, primarily in the areas of problem resolution and system exploration. The lack of transparency of the data and process models employed by the system is responsible for multiple hardships for its users. The resulting usability problems include difficulty in determininig the next step following a transaction, inability to diagnose a system error and problems finding the information being sought. Some employees have created informal notes documenting different aspects of using the system. These notes, or “cheat-sheets,” were typically shared within groups, and some were even laminated for distribution across the organization. Users described the help screens provided by the system as ineffective and based on “programmer’s language” rather than language that is relevant to the business process. Our analysis of the content of these notes (Topi et al., 2006) provides compelling evidence about the importance of understanding the relationship between the different components of a business process and how those components are utilized by the system. As the repository of all data and processes, it is the responsibility of the system to inform the user. The lack of a capability for this type of information sharing clearly impedes users in their ability to make the most productive use of the ERP system in performing their job tasks. Furthermore, in order to cope with this deficiency, the users have taken upon themselves the process of creating documentation that focuses on the model employed by the system. This model is typically based on what they have been able to discern from their use of the system, including the semantics of transactional components and their composition and context within a larger business process. In our solution, which we present in the next section, we
address this gap by placing the burden of providing system-related information where it belongs - on the system.
4 SHARING PROCESS KNOWLEDGE WITH THE USER In this section, we describe our approach for addressing the gap between the information held by the system and what is conveyed to the user. This approach has been implemented in a prototype that will be used in laboratory experiments.
4.1 The Process Graph To improve information sharing regarding the process flow, we have augmented the typical Graphical User Interface (GUI) of an ERP system with a component that we call a process graph. Displayed alongside the standard interface, this directed graph depicts the steps involved for completing part of or an entire business process using the system. There are two types of nodes in the graph: step and conditional. Each stepnode in the graph corresponds to roughly one ERP screen within a process. The color of the steps in the graph changes to reflect the progress of the task. At each point in time, only one step in the graph is designated as active, and that is the one whose form appears in the transaction window on the right. The active node is designated with a dark border. By visualizing the process steps and their preconditions, the graph informs the user of the overall process sequence and the context and purpose of each step. In addition, it implements the following functionality: 1. Keeps track of the status of each task by marking steps according to their status: completed (green), in progress (yellow), or not yet started (red). 2. Allows a preview of any step that follows the current one without requiring the completion of all preceding steps. To preview a step, the user clicks on the appropriate graph node. The information in the current screen is then saved, and the form associated with the designated step is displayed. 3. Allows recall of any previous step, including intermediate ones, such as a step that provides default values. This feature is useful for diagnostic purposes: when things go wrong, it is often beneficial to revisit the history of the interaction with the system. To enable this kind of recall of
125
ICEIS 2007 - International Conference on Enterprise Information Systems
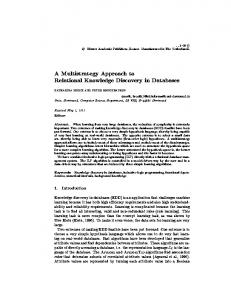
Figure 1: This screen shot of part of the Purchase Requisition transaction shows the set of related links and the process graph on the left side and the purchase requisition form on the right side. The form, which consists of purchase requisition items, must be filled in by the user. The step in the graph corresponding to the currently displayed part of the process, entitled Enter Line Item, is shown in yellow and outlined with a black border. The already completed first step of the process appears in green. The color red designates the steps that have not yet been started. Whenever the user is entering data to the Material field, the Edit/Add Material. step is displayed. The Related Pages window provides access to the most commonly co-occurring tasks.
previously completed steps, the system logs the interaction data associated with a particular transaction. Permitting the review of previously entered data that is not being altered can always be allowed, but careful consideration must be given to determining if any change to a previously completed step should be allowed and propagated forward. The steps in a graph can be shown or hidden as needed for purposes of clarity. For example, the graph in Figure 1 shows the Add/Edit Material step only when the cursor is positioned within a Material field in the form on the right hand side of the screen. This is useful because adding or editing a material is not a required step but may sometimes be necessary. While the user is in the process of entering the material, the step is displayed to remind him that if he needs to add a new material to the master in order for it to be listed in the purchase requisition, this can be accomplished by launching the interface for that step without having to exit from the purchase requisition process. The process graphs for the entire system form a hierarchy, where some graphs are expansions of a step in another process. This is illustrated in Figures 2 and
126
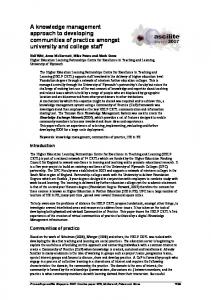
Figure 2: Purchase Order graph showing Purchase Requisition process as a component step.
1: the Purchase Order graph depicted in Figure 2 contains the Purchase Requisition step. When that step is opened, the graph from Figure 1 shows the Purchase Requisition process expanded into its component steps. Note that when the interface for the component step is invoked, both screens are displayed and are accessible to the user from different windows so
VISUALIZING THE PROCESS - A Graph-Based Approach to Enhancing System-User Knowledge Sharing
that they can be reviewed concurrently. To visualize the hierarchical relationship of the tasks depicted by the graphs, each screen is annotated with a title that corresponds to the one for the step.
4.2
Related Tasks Links
To allow for quick navigation to the tasks that are most closely related to the current activity and may be necessary for its successful completion, we have added a Related Pages window with a set of direct links to those tasks (see Figure 1). Clicking on such a link causes the interface for the related task to appear in another window, which is displayed simultaneously with the current task. In traditional ERP systems, related tasks are usually available via menu items. Given the generic titles of these menus, however, users may be unaware of the existence of these tasks or unsure of whether or not a particular task is appropriate for use in a given situation. Displaying relevant related links directly on the screen alleviates these concerns by guaranteeing that the user is aware of them and that they are relevant to the current task. This should promote greater efficiency in the use of the interface.
5
processes. Overall, the four users had positive experiences with the interfaces. While no definite conclusions can be drawn from this limited evaluation, it provides preliminary feedback that will be helpful in designing an experimental laboratory study.
INITIAL EVALUATION
We have conducted a preliminary evaluation of the process graph component of our prototype implementation. The purpose of this evaluation was to confirm the full functionality of this component and get initial feedback on differences in the user experience when the component was present versus when it was not. For this purpose, we prepared two versions of the prototype for creating a purchase requisition. Both versions included the same interface for data entry and implemented three tasks: Add Vendor, Add Material, and Create Purchase Requisition. Both versions allowed navigation to a task interface via a selection box of available options on the initial page. The difference between the two versions was that only one included the process graph. The set of related links was not included in either version. Four people participated in this evaluation. Two of them used the version of the interface that included the process graph, and the other two used the interface without it. All users were given a detailed, version-specific document describing how the interface should be used to create a purchase requisition. All users were able to complete their tasks, and those who were given the version of the interface with the graph were observed using it to navigate to the related
6 RELATED WORK Several authors have identified the need for business process visualizations from the perspective of improving process understanding. Sch¨onhage et al. (2000) demonstrate the importance and usefulness of such visualizations and compare the characteristics of 2D and 3D visualizations in a real business context. Turetken and Schuff (2002) evaluate the effects of varying and integrating process representation levels on the ability of data flow diagrams to communicate process characteristics to business users. Neither one of these studies suggests a direct link between visualization and usability support. Others have discussed the importance of process understanding in the context of usability. Lieberman and Wagner (2003) present the idea of an “ECommerce Debugging Tool” with which consumers can evaluate the history of actions that they have taken during an e-commerce transaction to resolve their errors. They identify a visualization of the process as a necessary component of the system but do not present a prototype demonstrating the idea. Kobti and Sundaravadanam (2006) recognize the importance of providing process support for the users of e-commerce systems. They stress the importance of separating representations of business processes (expressed with UML Activity Diagrams and WS-CDL) from the user interface representation, as advocated by Schmid and Rossi (2004). Our approach goes one step further by explicitly representing business processes graphically within the enterprise system context. It is important to recognize that a great deal of attention has been paid to various systems built to support cooperative work (such as research presented at the ACM CSCW conference). This research, however, typically focuses on supporting collaboration between humans; it pays little if any attention to providing support for users who are interacting with complex system processes, even in those cases where it refers to business processes, as in (Haake and Wang, 1997). Finally, we want to recognize the connection between our work and research on workflow management and analysis presented in (Basu and Blanning, 2000). That stream of research provides an excellent foundation for the modeling of processes and the for-
127
ICEIS 2007 - International Conference on Enterprise Information Systems
malization of their internal representation, but it has not, thus far, been linked to system usability.
7
CONCLUSIONS AND FUTURE WORK
Our field study with users of ERP systems confirmed that users ranging from novice to expert could benefit from design methods that support, assist, and inform them in their interactions with these system. By applying a collaborative approach to the design of the interface, we have sought to address the major shortcoming identified through our field study: namely, the lack of communication from the system to its users about the data and processes required to complete their tasks and how the different processes interact. Our solution is twofold: (1) providing a directed process graph that informs the user about tasks required for completion, the user’s progress through these tasks, and how these tasks are related to other processes in the system, and (2) providing direct access to relevant tasks the user may need for completing a process. In addition to the potential benefits of increased efficiency and effectiveness resulting from improved interaction with the system, the type of information sharing we have implemented also has implications for more effective training. For new users, they will be led through the steps required to complete a process and given visual cues concerning their progress. Experienced users will also benefit, as the current lack of transparency in existing systems often hinders their understanding of complex processes involving multiple users. Our process graphs provide these users with the same types of information they hitherto recorded in their cheat-sheets. We are planning on conducting user studies to evaluate the usability of an interface that includes a process graph and links to related tasks versus that of an interface that does not include these components. While our focus here is on the ERP domain, the proposed approach is equally well-suited for application to any large-scale system requiring the user’s involvement in complex processes. Future research will be aimed at extending our approach to other such domains and measuring the impact on user performance and system usability.
ACKNOWLEDGEMENTS We gratefully acknowledge the financial support of Bentley College, which provided a grant to fund this work, and the students who were involved in the implementation of the prototype.
REFERENCES Babaian, T., Grosz, B. J., and Shieber, S. M. (2002). A writer’s collaborative assistant. In Proceedings of Intelligent User Interfaces Conference (IUI-02), pages 7–14. ACM Press. Basu, A. and Blanning, R. (2000). A formal approach to workflow analysis. Information Systems Research, 11(1):17–36. Bratman, M. E. (1992). Shared cooperative activity. Philosophical Review, 101(2):327–341. Gilbert, A. (2003). Business apps get bad marks in usability. CNET News.com, http://news.com.com/21001017-980648.html (current 9/7/2006). Grosz, B. G. (2005). Beyond mice and menus. In Proceedings of the American Philosophical Society, pages 529–523. Haake, J. M. and Wang, W. (1997). Flexible support for business processes: extending cooperative hypermedia with process support. In GROUP ’97: Proceedings of the international ACM SIGGROUP conference on Supporting group work, pages 341–350, New York, NY, USA. ACM Press. Kobti, Z. and Sundaravadanam, M. (2006). An enhanced conceptual framework to better handle business rules in process oriented applications. In Proceedings of ICWE’06, pages 273–280. Lieberman, H. and Wagner, E. (2003). End-user debugging for e-commerce. In Proceedings of Inteligent User Interfaces Conference (IUI’03), pages 257–259, New York, NY, USA. ACM Press. Rich, C., Sidner, C. L., and Lesh, N. (2001). Collagen: applying collaborative discourse theory to humancomputer interaction. AI Magazine, 22(4):15–25. Schmid, H. A. and Rossi, G. (2004). Modeling and designing processes in e-commerce applications. Internet Computing, IEEE, 8(1):19–27. Shieber, S. (1996). A call for collaborative interfaces. ACM Computing Surveys, 28A (electronic). Topi, H., Lucas, W., and Babaian, T. (2005). Identifying usability issues with an ERP implementation. In Proceedings of the International Conference on Enterprise Information Systems (ICEIS-2005), pages 128– 133. Topi, H., Lucas, W., and Babaian, T. (2006). Using informal notes for sharing corporate technology know-how. European Journal of Information Systems, 15(5):486– 499.
128