This article has been accepted for publication in a future issue of this journal, but has not been fully edited. Content may change prior to final publication. Citation information: DOI 10.1109/TBME.2014.2320153, IEEE Transactions on Biomedical Engineering 1
A Head Impact Detection System Using SVM Classification and Proximity Sensing in an Instrumented Mouthguard Lyndia C. Wu, Livia Zarnescu, Vaibhav Nangia, Bruce Cam, and David B. Camarillo*, Member, IEEE,
Abstract—Injury from blunt head impacts causes acute neurological deficits and may lead to chronic neurodegeneration. A head impact detection device can serve both as a research tool for studying head injury mechanisms and a clinical tool for real-time trauma screening. The simplest approach is an acceleration thresholding algorithm, which may falsely detect high-acceleration spurious events such as manual manipulation of the device. We designed a head impact detection system that distinguishes head impacts from non-impacts through two subsystems. First, we use infrared proximity sensing to determine if the mouthguard is worn on the teeth to filter out all offteeth events. Second, on-teeth, non-impact events are rejected using a support vector machine classifier trained on frequency domain features of linear acceleration and rotational velocity. The remaining events are classified as head impacts. In a controlled laboratory evaluation, the present system performed substantially better than a 10g acceleration threshold in head impact detection (98% sensitivity, 99.99% specificity, 99% accuracy, and 99.98% precision, compared to 92% sensitivity, 58% specificity, 65% accuracy, and 37% precision). Once adapted for field deployment by training and validation with field data, this system has the potential to effectively detect head trauma in sports, military service, and other high-risk activities. Index Terms—impact detection, support vector machines, infrared proximity sensing, traumatic brain injury.
I. I NTRODUCTION Blunt head impacts in sports, military service, and other activities can cause traumatic brain injury [1]–[5]. Repeated trauma is shown to increase the likelihood of subsequent injury [6] and lead to chronic neurodegeneration [7]–[9]. To prevent repeat injury, legislative efforts such as the Lystedt Law require youth athletes be removed from play if suspected of sustaining head trauma [10]. However, such legislations cannot be fully enforced due to injury under-reporting in sports [11]. A more objective method of injury screening may be head impact monitoring. Previous research found statistically Manuscript received December 19, 2013; revised February 28, 2014 and April 15, 2014; accepted April 16, 2014. Asterisk indicates corresponding author. L.C. Wu and L. Zarnescu are with the Department of Bioengineering, Stanford University, Stanford, CA, 94305 USA (e-mail:
[email protected], liviaz@stanford,edu). V. Nangia and B. Cam are with the Department of Mechanical Engineering, Stanford University, Stanford, CA, 94305 USA (e-mail:
[email protected],
[email protected]). *D.B. Camarillo is with the Department of Bioengineering, Stanford University, Stanford, CA, 94305 USA (e-mail:
[email protected]). Copyright (c) 2013 IEEE. Personal use of this material is permitted. However, permission to use this material for any other purposes must be obtained from the IEEE by sending an email to
[email protected].
Head Impacts
Insertion/ Removal
Clenching
Chewing
Drinking/ Spitting
Non-impact Events
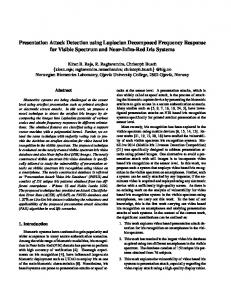
Fig. 1. Head Impacts and Non-impact Events Registered by the Instrumented Mouthguard. On the field, both head impacts (left column) and non-impact events involving spurious mouthguard activities (center and right columns) may trigger event registration on an instrumented mouthguard. Some nonimpact events are generated when the mouthguard is not worn on the teeth (center column) and some when it is worn (right column).
significant correlation between the number of head impacts and the resulting neurophysiological deficit [12]. In football players, a greater number of head impacts with high impact kinematics were more likely to lead to concussions [13]. Furthermore, repeated subconcussive impacts have also been associated with blood-brain barrier disruption and diffusion tensor imaging changes, indicating elevated risks for cognitive deficits [14]. Thus technologies for detecting and recording head impacts may not only serve as research tools to help investigate head injury mechanisms, but also as clinical tools for on-field injury screening. The Head Impact Telemetry (HIT) system [15]–[17], which achieves inertial sensing through helmet-embedded accelerometers, has been used to record and characterize head impact kinematics in youth and collegiate populations across multiple sports [18]–[21]. Injury tolerance findings based on HIT system data [22], [23] confirm the potential of such head impact measurement technology to be used for injury prediction. However, helmet-mounted sensing systems such as the HIT system may dislocate from the head in some impact conditions, causing measurement error [24]. In addition, impact detection performance of these systems has not been reported. As a low-cost alternative, instrumented mouthguards [25] are well-suited for head impact detection since they can
0018-9294 (c) 2013 IEEE. Personal use is permitted, but republication/redistribution requires IEEE permission. See http://www.ieee.org/publications_standards/publications/rights/index.html for more information.
This article has been accepted for publication in a future issue of this journal, but has not been fully edited. Content may change prior to final publication. Citation information: DOI 10.1109/TBME.2014.2320153, IEEE Transactions on Biomedical Engineering 2
AL
z
Record-Impacts
z
x y
Linear Acceleration
Rotational Velocity
Proximity to Teeth
Classify-as Off,teethEvents
qL-Reject-Off,teeth Events-with-Proximity Subsystem
Classify-as On,teethEvents Classify-as Non,impactEvents
Power
2L-Reject-Non,impactEvents-with-SVM Subsystem
y x
Frequency
Classify-as Head-Impacts
Power
Frequency
NOTHead-Impacts
Save-on,teethV-SVM, filtered-events-ashead-impactsL--
Head-Impacts
BL
Triaxial Gyroscope Battery Triaxial Accel Proximity Sensor Microcontroller
mm
Sensor-Board
24L4
mm
qFLq
be custom-fit to tightly couple to the upper jaw and directly measure skull kinematics. In this paper, we present the design and evaluate the performance of a head impact detection system that uses an instrumented mouthguard. A first-order simple impact detection algorithm is to record all events above a pre-defined linear acceleration threshold. However, this approach may falsely detect many spurious high-acceleration non-impact events (Fig. 1). For example, some non-impacts could be generated by manual manipulation of the device, and some could come from device placement or removal. These misclassified events will skew conclusions when studying head injury mechanisms and raise false positives when screening for head trauma. In a head impact detection system, we want most head impacts detected (high sensitivity) with few non-impact false positive events (high precision). Due to frequent incidence of non-impact events from normal motions on the field, using a linear acceleration threshold will likely detect a large number of false positives and have poor precision in head impact detection. Increasing the acceleration threshold could help improve precision but will sacrifice sensitivity. We need to better distinguish between non-impact events and head impacts for improved sensitivity and precision in head impact detection. Since the mouthguard only measures head motion when coupled to the teeth, events where the mouthguard is not worn should be rejected. When the mouthguard is worn, differences in dynamic signature may be used to distinguish between head impacts and non-impact events. With these design considerations, we hypothesize that a classification system combining mouthguard proximity detection and signal classification will have better sensitivity and precision in head impact detection compared to simple acceleration thresholding. II. M ETHODS ¶Our head impact detection system distinguishes head impacts from non-impacts through 2 classification subsystems (Fig. 2A). First, we use infrared (IR) proximity sensing to determine if the mouthguard is worn on the teeth. All offteeth events are filtered out at this step. Second, on-teeth, non-impact events are rejected using a support vector machine (SVM) classifier trained on frequency-domain features of linear acceleration and rotational velocity. The remaining events are classified as head impacts. A. Instrument Design Signals used in the classification system are collected using an instrumented mouthguard (Fig. 2B, left). A tight fit is achieved by forming ethylene vinyl acetate (EVA) material around a dental mold with a mouthguard pressure former (Great Lakes Orthodontics, Tonawanda, NY). Each mouthguard contains a sensor board and a battery sealed between 2 layers of EVA material. For kinematic and proximity sensing, the sensor board (Figure 2B, right) is equipped with a 3-axis high range accelerometer (ST H3LIS331), a 3-axis high range gyroscope (Invensense ITG-3500A), and a digital proximity sensing module packaged with an infrared emitter-receiver pair
Fig. 2. Impact Detection System Illustration and Instrumented Mouthguard Design. The head impact detection system contains 2 subsystems (A). First the proximity signal is used to filter out events where the mouthguard is not worn on the teeth. The remaining events are passed through the support vector machine (SVM) classifier trained to distinguish between head impacts and non-impacts. Proximity and kinematic signals are measured using an instrumented mouthguard (B).
for near-field proximity sensing (AMS TMD2771). In addition, a microprocessor (ST STM32L151) and a flash memory chip (ST M25P16) allow wireless processing and recording. Kinematic accuracy of this instrumented mouthguard has been validated in lab using an anthropomorphic test device [25]. To screen for potential head impacts, the mouthguard records all events with linear acceleration exceeding 7g. This triggering acceleration threshold is tuned to be lower than published systems with 10-15g thresholds [26], [27] to decrease the likelihood of missing events of interest. Linear acceleration and rotational velocity samples are obtained for 10ms pre-trigger and 90ms post-trigger, with accelerometer sampling rate of 900-1000Hz and gyroscope sampling rate of 800-900Hz. A 10-bit resolution IR reading is obtained at the end of the 100ms kinematic recording for each registered
0018-9294 (c) 2013 IEEE. Personal use is permitted, but republication/redistribution requires IEEE permission. See http://www.ieee.org/publications_standards/publications/rights/index.html for more information.
This article has been accepted for publication in a future issue of this journal, but has not been fully edited. Content may change prior to final publication. Citation information: DOI 10.1109/TBME.2014.2320153, IEEE Transactions on Biomedical Engineering 3
Buccal Direction
linear actuator
E D
t d
E: emitter, D: detector
composite tooth model
B
linear actuator
composite tooth model
Occlusal Direction
A
E D
h t
Fig. 3. In vitro Proximity Characterization. The proximity output versus distance relationship was characterized in 2 dimensions: movement of the sensor in (A) the buccal direction and that in (B) the occlusal direction.
event. B. IR Proximity Sensing and SVM Classifier Design ¶Signals collected by the proximity and kinematic sensors are used as inputs to the two classification subsystems. To optimize the system for head impact detection, we designed and trained each subsystem in a controlled laboratory setting. 1) Proximity sensing optimized to detect mouthguard dislocation: Optical and capacitive proximity sensors have been widely employed to sense relative positioning of objects such as mobile phones and the user’s hand [28] or robots and obstacles [29]. For our impact detection system, we tuned an IR proximity sensor to help reject off-teeth non-impact events. With the IR proximity module configured for near-field detection, we characterized in vitro sensing behavior by unittesting a sensor component. We used a synthetic-resin composite tooth model that has matching optical properties as human teeth (Puche Dental Lab, Torrance, CA). Since a mouthguard can move perpendicular or parallel to the tooth surface, we measured sensor output in one perpendicular direction and one parallel direction: away from the tooth surface (buccal) and towards the bite plane (occlusal). To simulate 1-D motion of the sensor in each direction, we attached the sensor to a linear actuator (Firgelli Technologies L12-50-100-12-P) to move away from a stationary tooth in steps of 0.5 mm (Fig. 3). Movement in the buccal direction was measured from the surface of the tooth to the surface of the sensor, and movement in the occlusal direction was from the bottom of the tooth to the bottom of the sensor package. To investigate effects of EVA material, we varied material thickness between the sensor and the mouthguard from 0 to 3mm. Based on sensor response characteristics, we chose the sensor position and material thickness that allowed the embedded proximity sensor to detect mouthguard dislocation. After unit-testing the sensor component, we built a full mouthguard to characterize in vivo sensing behavior and determine an on-teeth/off-teeth threshold. A human subject performed a range of on-teeth and off-teeth events with a mouthguard. On-teeth events included talking, shouting, biting and chewing; off-teeth events included mouthguard manual manipulation, dropping, and helmet insertion. The proximity readings from on-teeth and off-teeth events were each fit to a normal distribution. From these distributions a proximity
threshold was chosen to maximize the likelihood of detecting all on-teeth events while rejecting all off-teeth events. The chosen on-teeth/off-teeth proximity threshold was verified by measuring the corresponding amount of in vivo mouthguard dislocation. In this experiment, the subject was asked to put on and take off the mouthguard while mouthguard movement was tracked using the Ascension 3D guidance trakSTAR system (Ascension Technology Corporation, Shelburne, VT). We used 2 small 6 degree-of-freedom electromagnetic sensors with one sensor fixed on the mouthguard and the other on the subject’s head. The change in distance between these two markers was tracked and recorded as the mouthguard dislocation distance. Proximity readings were obtained continuously during mouthguard movement and time-synchronized with the tracked distances. To control for error, we conducted the experiment in a metal-free environment and characterized the Ascension system to have approximately 1mm offset error in our measurement range (less than previously reported [30]), which we accounted for in all distance measurements. 2) SVM classifier trained to reject non-impacts: The support vector machine (SVM) method is a well-established statistical pattern recognition method [31]. SVM classifiers have been shown to be effective at recognizing human motion [32]– [35]. We trained an SVM classifier with frequency-domain features of linear and rotational motion to help distinguish between head impacts and non-impact events. For training the SVM classifier and evaluating overall system performance, a labeled data set containing both head impacts and non-impact events simulating field conditions was obtained. Head impacts were reconstructed using a springdriven impactor and a dummy headform mounted on a flexible Hybrid III neck (Humanetics Innovative Solutions, Plymouth, MI), which was anchored at the base of the neck (Fig. 4A). The impactor piston head was made of ultra-high molecular weight polyethylene, with a diameter of 127 mm and a radiusof-curvature of 72 mm. Impacts at 5 different orientations and 8 velocities ranging from 2.1-8.5 m/s were reconstructed [25] (Table I). An instrumented mouthguard firmly clamped onto the upper jaw of the headform recorded the reconstructed head impacts. For non-impact reconstruction (Fig. 4B), we observed videos of multiple football practices and a game to identify a comprehensive set of non-impact sources (Table I). Two subjects wore instrumented mouthguards and simulated all types of non-impacts. The lab-reconstructed events were partitioned into a training portion for training the SVM classifier, and a testing portion to evaluate overall system performance. Raw data included x, y, z linear acceleration and rotational velocity. From this data we extracted frequency-domain features rather than time domain features, since impact and non-impact events were expected to involve orders-of-magnitude differences in colliding masses and therefore different dynamics. Thus we computed power spectral density (PSD) features from the raw kinematic data (Fig. 4C). PSD magnitudes of the signals were calculated between 15Hz and 400Hz. 15Hz was the minimum frequency chosen due to the limited time window for data sampling, and 400Hz was the maximum since it was below the Nyquist frequency for all raw data vectors. The accelerometer chip
0018-9294 (c) 2013 IEEE. Personal use is permitted, but republication/redistribution requires IEEE permission. See http://www.ieee.org/publications_standards/publications/rights/index.html for more information.
This article has been accepted for publication in a future issue of this journal, but has not been fully edited. Content may change prior to final publication. Citation information: DOI 10.1109/TBME.2014.2320153, IEEE Transactions on Biomedical Engineering 4
TABLE I T YPES AND NUMBERS OF LAB - RECONSTRUCTED EVENTS
Total
169 136
85 - 253 254 - 389
136
390 - 525
84
526 - 609
89 72 770
610 - 698 699 - 770
has a bandwidth of 500Hz, which encompasses the full PSD range. For the gyroscope chip, the bandwidth is 184Hz for the chosen sampling rate, and PSD above this frequency was discarded. All of the PSD information was combined into a single preliminary feature vector for SVM training. The PSD vectors in x, y, and z were interpolated to a common frequency vector due to different sampling rates in different chips. The common frequency vector contained 100 frequencies evenly spaced between 15 and 400 Hz for linear acceleration and 50 frequencies evenly spaced between 15 and 180 Hz for rotational velocity. PSD magnitudes were concatenated into a 150-element preliminary feature vector containing both linear acceleration and rotational velocity PSD magnitude vectors for each event (Fig. 4C, bottom). From the preliminary feature vector, a subset of features that optimized classifier performance was chosen. First, features were selected to minimize misclassification of events in the training data. Feature selection was performed using information from training data only to avoid bias. The Pearson correlation coefficients between all 150 features in the preliminary feature vector and the class labels (impact or non-impact) were calculated for events in training data [36]. Features were selected in a sequential process, starting with those that have high correlation to the class labels but low correlation to other already selected features. This selected subset of features was used to train an SVM classifier with a radial basis function kernel. In order to find the best SVM decision boundary, the ”patternsearch” function in the Matlab optimization toolbox was used to minimize the misclassification rate within the training data. A decision boundary was chosen to have sensitivity > 95% and also to maximize the F-measure (harmonic mean of sensitivity and precision) [37]. C. System Evaluation We evaluated the performance of the combined classification system on a testing partition of lab-reconstructed data. In
C
Linear)Acceleration)Raw)Data
X Y Z
p3 N3 3 −N3
B
p3
C3 63 Time)RmsX
83
N33
Linear)Acceleration)PSD
p N 3 N5
N33 p33 B33 Frequency)RHzX
C33
Rotational)Velocity)RradZsX
1 - 84
Power)Spectral)Density
Manual manipulation (out-of-mouth) or striking mouthguard against object Off-teeth biting or chewing Dropping mouthguard on the ground Inserting mouthguard into helmet Putting on/taking off mouthguard On-teeth biting or chewing Shouting, talking, suction
Event Number -
Linear)Acceleration)RgX
Front Front Boss Rear Boss Rear Front Face Guard
Number Simulated 16 32 32 32 16 128 84
Power)Spectral)Density
Total Spurious Non-impact Event
Description
Rotational)Velocity)Raw)Data
X Y Z
p3 N3 3 −N3
p3
C3 63 Time)RmsX
83
N33
Rotational)Velocity)PSD B
discard)data above)gyro bandwidth
p N 3 N5
N33 p33 B33 Frequency)RHzX
C33
Preliminary)Feature)Vector:)Frequency)Domain)Features B Feature)Value
Event Class Head Impact
B
A
p
Linear Rotational Acceleration Velocity PSD PSD RN5)/)C33)HzX)))))))))))))))))))))))))))))))))))))RN5)/)N83)HzX
N
3
p3
C3
63 83 N33 Feature)Number
Np3
NC3
Fig. 4. Impact and Non-impact Data Acquisition and Processing. Impacts were simulated with a spring-driven impactor (A) and non-impact events were simulated with human subjects (B). In (C), we illustrate the kinematic data processing method. From the raw data, the power spectral density (PSD) magnitude was used to construct a 150-element-long preliminary feature vector for each event. The sample traces shown are from an impact event.
order to measure system performance, we used our classification system to classify events in the testing data as either impacts or non-impacts, and compared our predictions to a priori labeled ground truth information. First, events in the testing data with proximity readings below the onteeth/off-teeth proximity threshold were rejected as off-teeth non-impact events, while events with proximity readings above the threshold remained unclassified as potential impacts. The same features used for SVM training were then extracted from the unclassified events, and classified using the SVM decision boundary determined during training. After classification, the
0018-9294 (c) 2013 IEEE. Personal use is permitted, but republication/redistribution requires IEEE permission. See http://www.ieee.org/publications_standards/publications/rights/index.html for more information.
This article has been accepted for publication in a future issue of this journal, but has not been fully edited. Content may change prior to final publication. Citation information: DOI 10.1109/TBME.2014.2320153, IEEE Transactions on Biomedical Engineering 5
Buccal5Direction
linear E actuator D
0.8
t d
0.6 Material5Thickness t5=50mm t5=51mm5A0.8mmM t5=52mm5A1.2mmM t5=53mm5A1.9mmM
0.4 0.2 0 0
5
10 15 Buccal5Movement5d5AmmM
20
0.8 0.6
E D
h
t Material5Thickness
0.4
t5=50mm t5=51mm5A0.8mmM t5=52mm5A1.3mmM t5=53mm5A1.9mmM
0.2 0
25 composite tooth5model
output5saturates
1 Occlusal5Direction
B
composite tooth5model
output5saturates
1
linear actuator
Normalized5Proximity5Output
TP (1) sensitivity = TP + FN TP precision = (2) TP + FP TN (3) specif icity = TN + FP TP + TN accuracy = (4) TP + FP + TN + FN The main measures used to evaluate system performance were sensitivity and precision. Sensitivity is important since the impact detection system should not reject head impact events. Precision is also an important factor since we do not want to classify non-impact events as head impacts and detect a large number of false positives. In fact, precision is preferred over specificity as a performance measure, since we expect a large number of true negatives on the field, which can give high specificity even with a substantial amount of false positives. Furthermore, since sensitivity and precision vary based on decision threshold, the area under the ROC curve was also used as a measure of classifier performance [38], [39]. Because there is variability in data partitioning, we conducted 100 Monte Carlo simulations [40] of 5-fold crossvalidation [41] to obtain an unbiased estimate of our classification system’s average performance. At the beginning of each cross-validation cycle, the set of all impact and nonimpact events was randomly partitioned into 5 approximately equal portions. For each pass of the cross-validation, four portions were used to perform feature selection and SVM classifier training, and the remaining portion was used to evaluate classification performance. The sensitivity, precision, specificity, accuracy, and area under the ROC curve were recorded for each pass of the cross-validation and averaged at the end of all simulations to estimate the true performance of the classification system. To compare our system with simple acceleration thresholding and verify how each classification subsystem helped, we evaluated the performance of 4 classification methods 1) Peak linear acceleration thresholding. In this classification method, all events with peak linear acceleration magnitude greater than a predetermined threshold (10g) are classified as impacts . 2) Peak linear acceleration thresholding (10g) with the proximity classification subsystem, to show value of proximity sensing. 3) Classification using an SVM classifier only, to demonstrate its standalone performance. 4) Combined SVM and proximity classification to show overall performance. ¶All human subject experiments have been approved by the Stanford Institutional Review Board (IRB No. 21304), and informed consent was obtained from the subjects.
A
Normalized5Proximity5Output
numbers of true positives (TP), false positives (FP), true negatives (TN), and false negatives (FN) were calculated. We computed sensitivity, precision, specificity and accuracy as the classification performance measures, which are defined below.
0
1
2 3 4 5 Occlusal5Movement5h5AmmM
6
7
Fig. 5. In vitro Proximity Sensor Characterization. Proximity output with respect to (A) buccal movement of the sensor and (B) occlusal movement of the sensor are shown with different thicknesses of EVA medium material. Three trials were performed for each material thickness and error bars show 95% confidence intervals. Pressure-forming led to thinning of EVA material and post-form thicknesses are displayed in brackets. We chose 2mm as the optimal material thickness to maximize output range and provide sufficient thickness for teeth protection. Sensor position inside the mouthguard was optimized to account for the saturation bands.
III. R ESULTS A. IR Proximity Sensing and SVM Classifier Design 1) Sensor Positioning in Mouthguard and On-Teeth Threshold Choice: In vitro IR proximity sensor output monotonically decreases with increasing buccal or occlusal movement from a tooth (Fig. 5). Thus by embedding a sensor in the mouthguard to face the teeth, we can use the IR signal drop to detect mouthguard dislocation. The transparent mouthguard material thickness between sensor and teeth was chosen to be 2mm, since thicker material led to increased signal backscattering and much higher output at large displacements (Fig. 5, yellow). Also, for teeth-protection, we did not choose material thinner than 2mm to maintain sufficient overall mouthguard thickness with two layers of material [42]. Even when configured with the lowest available emitter signal strength for near-field sensing, the sensor saturated at close proximity to a tooth in both the occlusal and buccal directions (Fig. 5, saturation bands). In these saturation re-
0018-9294 (c) 2013 IEEE. Personal use is permitted, but republication/redistribution requires IEEE permission. See http://www.ieee.org/publications_standards/publications/rights/index.html for more information.
This article has been accepted for publication in a future issue of this journal, but has not been fully edited. Content may change prior to final publication. Citation information: DOI 10.1109/TBME.2014.2320153, IEEE Transactions on Biomedical Engineering 6
C6) C4) C2)
Off−teeth Distribution µ =F)cC7 σ =F)c)22
On−teeth Distribution µ =F)c94 σ =F)c)26
Count
C)) On−teeth(Off−teeth ThresholdF=F)c8C
8) 6) 4) 2) )
)c2
)c4 )c6 )c8 NormalizedFProximityFOutput
NormalizedFProximityFOutput
B )c8
10
−1
10
20 30 NumberAofAFeatures
10
B
ON−TEETH
C
8AfeaturesAusedAforAoptimalA performance
0
C
50
40
Impacts NonAImpacts
ThresholdF=F)c8C
FeatureAValue
)
A NumberAofAFalseAPositivesA perA1000ANon-ImpactAEvents
A
OFF−TEETH
)c6 )c4
0
10
)c2 ) 3c7mm )
5
C) C5 Off-TeethFDistanceFPmmx
2)
Fig. 6. In vivo Proximity Sensor Characterization. On-teeth and off-teeth proximity output values are fit to normal distributions (A). We chose a threshold of 0.81 to maximize rejection of off-teeth and transition events while minimizing the misclassification of on-teeth events. Proximity output with respect to mouthguard distance off-teeth (B) was used to verify the threshold. The plot displays average output from 5 take-off and 5 put-on trials, with error bars showing standard deviation in distances corresponding to each proximity value.
gions, changes in displacement are not detected by the sensor. With the chosen 2mm material thickness, we cannot fully avoid the 6mm saturation band in the buccal direction (Fig. 5A). However, we can avoid the 1mm occlusal saturation band (Fig. 5B) by offsetting the edge of the sensor package 1mm below the edge of the tooth, so any movement in the occlusal direction should cause a drop in proximity output. All mouthguards used in subsequent in vivo experiments were constructed with the 2mm material thickness and 1mm offset in sensor position. Figure 6 shows in vivo experimental results to determine and verify an on-teeth/off-teeth threshold. On-teeth and offteeth IR proximity output distributions are shown in Fig. 6A. We chose a threshold at 5 standard deviations below the on-teeth mean (normalized proximity value = 0.81), which corresponds to a probability of misclassifying 1 in 3 million on-teeth events. This threshold is also 29 standard deviations above the off-teeth mean, which maximizes the rejection of off-teeth events. At the same time, we can reject the majority of events that may have IR output between the on-teeth and
1
2
3
4
5
6
7
8
FeatureARank Fig. 7. Feature Selection for Optimal Classification Performance. (A) The optimal number of features was chosen to minimize the number of false positives. The exact features chosen are listed in Table II. (B) shows feature values of the optimal set of 8 features ordered by feature rank. The lines display the median value for each feature, and the error bars represent the upper and lower quartiles. The y-axis is shown in log scale because values have approximately log-normal distributions.
off-teeth distributions, such as transition events during which the mouthguard is put on or taken off the teeth. The average in vivo mouthguard off-teeth distance corresponding to the chosen threshold is 3.7mm ± 2.2 mm standard deviation (Fig. 6B). The standard deviation may have resulted from slightly different 3D mouthguard trajectories in each trial. Considering that maxillary (upper) teeth are 5-10mm tall [43], this off-teeth distance is less than a tooth length. 2) SVM Feature Selection: Features were ranked using our sequential feature selection process, with the top features having high correlations to the class labels and low correlations to one another. The optimal number of features was chosen by monitoring classification performance while varying the number of features used (Fig. 7A). We chose an optimal set of 8 features (Table II) to minimize false positive rate, although anywhere from 6-11 features produced nearly the same result. Feature values had log-normal distributions, with median and interquartile range (IQR) shown in Table II. The highest ranked features had very different values between impacts and nonimpacts, while lower-rank features had more overlap (Fig. 7B). On average, impacts had much higher linear acceleration
0018-9294 (c) 2013 IEEE. Personal use is permitted, but republication/redistribution requires IEEE permission. See http://www.ieee.org/publications_standards/publications/rights/index.html for more information.
This article has been accepted for publication in a future issue of this journal, but has not been fully edited. Content may change prior to final publication. Citation information: DOI 10.1109/TBME.2014.2320153, IEEE Transactions on Biomedical Engineering 7
Non-impactlEventslMisclassifiedlaslImpacts
TABLE II O PTIMAL F EATURE S ET FOR C LASSIFICATION Frequency Feature Median Value, (Hz) Rank Impacts (IQR)
Median Value, Non-Impacts (IQR)
Linear Acceleration
15 50 132 190 302 345
1 2 7 8 6 5
4.75 (3.15) 2.33 (2.00) .79 (.69) .61(.83) .57 (.67) .58 (.61)
.67 .78 .58 .50 .40 .37
15 58
3 4
3.95 (2.90) .58 (.34)
2.11 (2.76) .85 (1.19)
Rotational Velocity
(.91) (1.10) (.90) (.76) (.69) (.65)
PSD magnitudes at low frequencies (features 1 and 2) than non-impacts, with very little overlap between the interquartile ranges. Similar trends were observed in rotational velocity features at low frequencies (features 3 and 4). Although there is very little difference between the linear acceleration PSD magnitudes of impacts and non-impacts at high frequencies (features 5-8), the slight differences in feature values further helped to distinguish between the two types of events. Over the 100 Monte Carlo simulations with 5-fold cross-validation, we found feature selection to be fairly consistent. The features presented in Table II were chosen 90% of the time, and any feature variations stayed within a few hertz of these values. B. System Performance In our laboratory evaluation of classifiers, 10g linear acceleration thresholding had 92% sensitivity, with poor precision (37%), specificity (58%), and accuracy (65%) (Table III), since a large number of non-impacts were misclassified as impacts. Adding IR proximity to linear acceleration thresholding resulted in substantially improved performance. Sensitivity remained the same (92%), but precision was much higher (92%), because this classifier could reject off-teeth nonimpacts. SVM classification alone also performed much better than the 10g linear acceleration threshold, at 98% sensitivity and 97% precision. Combining SVM with proximity improved the classification performance to 98% sensitivity and 99.98% precision. If the sensitivity was lowered to 96%, no non-impact events were misclassified. The distribution of misclassified events pooled over 100 Monte Carlo simulations is shown in Fig. 8. Simple acceleration thresholding had more misclassifications than others, with false positives relatively evenly distributed across all types of non-impact events. The IR proximity subsystem successfully rejected all off-teeth non-impacts. But this subsystem was not designed to recognize on-teeth non-impacts. It also had trouble with some transition events, since IR was only sampled once per event, which did not capture the full duration of the event. Adding the SVM subsystem helped reject the majority of these on-teeth non-impact and transition events. In fact, SVM had good standalone performance that was much improved over thresholding (Table III). However, SVM alone misclassified off-teeth events such as inserting the mouthguard into a helmet or dropping the mouthguard. Therefore, combining the two
Thresholding Only Thresholding + Proximity SVM Only SVM + Proximity
5
10
Number of Times Misclassified
Data Type
off-teeth
4
10
transition on-teeth
3
10
2
10
1
10
0
10
0
100
200 300 400 500 Non-ImpactlEventlNumber
600
700
Fig. 8. Misclassified Events. The distribution of misclassified events is displayed by category to illustrate the effectiveness of each type of classifier. Simple acceleration thresholding misclassified many more events in all categories than other classifiers. The IR proximity subsystem rejected all offteeth events, and the SVM classifier rejected the majority of on-teeth events and transition events. The combined classifier occasionally misclassified onteeth biting events.
classification subsystems maximized the rejection of nonimpact events by allowing the strength of each subsystem to overcome the weakness of the other. The combined system misclassified only a few high-acceleration on-teeth biting and chewing events. IV. D ISCUSSION Although some design details of impact detection algorithms have been presented in patents [44], performance of these algorithms has not been reported. Our paper is the first to present a complete head impact detection system design and its evaluation. In a controlled laboratory setting, the present system demonstrated substantially improved performance over acceleration thresholding. The greatest amount of improvement was in classification precision, which increased from 37% to near 100% (Table III), due to a much lower number of false positive events. The proximity subsystem helped eliminate off-teeth false positives, while the SVM subsystem rejected the majority of on-teeth false positives. A. IR Proximity Sensing The unique IR scattering and reflective properties of human teeth allow the use of IR proximity sensing to detect mouthguard dislocation. IR sensing of a regular opaque surface does not have monotonically decreasing signal with increasing distance. There is low IR output at close proximity, due to insufficient distance between the sensor and the surface to allow the emitted IR light to be reflected/scattered to the detector. On the other hand, human teeth have unique optical
0018-9294 (c) 2013 IEEE. Personal use is permitted, but republication/redistribution requires IEEE permission. See http://www.ieee.org/publications_standards/publications/rights/index.html for more information.
This article has been accepted for publication in a future issue of this journal, but has not been fully edited. Content may change prior to final publication. Citation information: DOI 10.1109/TBME.2014.2320153, IEEE Transactions on Biomedical Engineering 8
TABLE III E VALUATION OF H EAD I MPACT C LASSIFICATION S YSTEM 10g Threshold only
10g Threshold + Proximity
SVM Alone
Sensitivity
.92
0.92
.98
SVM + Proximity .98
Precision
.37
0.92
.97
.9998
Specificity
.58
0.96
.99
.9999
Accuracy
.65
0.94
.99
.99
Area Under ROC
.780 (.031)
0.979 (.005)
.998 (.001)
1 (.000)
properties [45], [46]. Even at close proximity, IR signal can penetrate through the tissue and backscatter to the detector. Thus IR proximity sensing worked well for detecting the presence of teeth next to the sensor in the mouthguard tray. We also characterized the effects of EVA, a biocompatible material safe for oral applications [47], as a medium material between the sensor and the teeth. We found that if the material is thin enough, it does not significantly interfere with the IR signal. To extend this technology to other applications, wearable devices may use IR proximity sensing to detect device fixation onto tissue, and EVA is a good biocompatible medium material if the sensor cannot sit directly next to tissue.
relative to the contact location. In addition to the off-teeth false positives, on-teeth biting and chewing events misclassified by the combined system also had high PSD magnitudes across the entire frequency spectrum. The low-frequency components in these events may have come from chewing or grinding of the mouthguard away from the sensor location. In summary, the misclassified non-impacts may have PSD features more similar to head impacts than non-impacts with low signal power. Fortunately, with the combined system, off-teeth nonimpacts are reliably rejected by proximity sensing, and onteeth non-impacts with high signal power are rare due to the limited range of on-teeth motion.
B. SVM Signal Classification
C. Limitations and Future Work
SVM training revealed that low frequency components (15 60 Hz) were the most helpful in classification (Table II). Most of the impacts had significantly higher PSD magnitudes than non-impacts at these low frequencies (Fig. 7B). During impacts, the mouthguard was tightly coupled to a helmeted head mounted on a flexible neck [25]. During non-impacts, however, the mouthguard was mainly moving on its own and interacting with stiffer objects (e.g. helmet/ground). If we approximate the events using a simple spring-mass system, the natural p frequency of the system is proportional to k/m, where k is stiffness and m is mass. With much higher masses of colliding objects and lower stiffness of a flexible neck, the head impacts are expected to have lower natural frequency than non-impacts, which may explain the PSD magnitude differences at low frequencies. In fact, we were limited by our data sampling time window (100 ms) to obtain even lower frequency information, which may help further improve classifier performance. One other difference between the two classes of events is that nonimpacts generally had lower PSD magnitudes than impacts at all frequencies, since a mouthguard moving on its own resulted in lower signal power than a spring-driven piston impacting a dummy headform. These differences in PSD shapes may have allowed the SVM classifier to distinguish between most impacts and non-impacts. Some of the non-impacts misclassified by SVM alone, such as dropping the mouthguard, had large linear acceleration and rotational velocity, with high PSD magnitudes at both low and high frequencies. In contrast to these false positives, we did not see high PSD at low frequencies for most dropping events that were correctly classified. This difference in dynamics may arise from different orientations of the device as it hit the ground, if mouthguard stiffness is directionally-dependent. Furthermore, the dynamics may depend on the sensor location
Since we reconstructed impacts and non-impacts in a controlled laboratory setting, this data set does not contain a comprehensive set of field conditions. Impact and nonimpact features may have greater variability on the field, and the laboratory-optimized classifier will likely have decreased performance in classifying field data. Thus it may be necessary to train and optimize the system using field data prior to field deployment. On the field, we may expect more varied impact dynamics than our lab reconstruction. Due to limitations of the springloaded impactor, we could not reconstruct non-centroidal impacts, whiplash of the head and neck, or initial rotation prior to impact. Also, the lowest impact velocity in our reconstruction was 2.1m/s, while a substantial portion of field impacts could have lower velocity [48]. Another variable is that the mouthguards may not be rigidly attached on the teeth during head impacts on the field, while our lab reconstruction had the mouthguard firmly clamped. This could be investigated by using IR proximity sensing to confirm mouthguard fixation on the field. These limitations in impact reconstruction could lead to simplified dynamics in our laboratory data set, and result in changes in selected features if the system was trained on field data. In the reconstructed head impacts, we saw dominant lowfrequency modes. Although similar low-frequency components were observed in preliminary field data, additional field data are required to isolate dominant human head impact modes from any noise in the laboratory impactor-headform system (e.g. due to the dynamics of the Hybrid III neck or the shape and material of the impactor piston head.) In addition to variations in impact dynamics, there may be more non-impacts on the field depending on the specific subject or field conditions, in which case classification precision may decrease with the current decision boundary. To optimize
0018-9294 (c) 2013 IEEE. Personal use is permitted, but republication/redistribution requires IEEE permission. See http://www.ieee.org/publications_standards/publications/rights/index.html for more information.
This article has been accepted for publication in a future issue of this journal, but has not been fully edited. Content may change prior to final publication. Citation information: DOI 10.1109/TBME.2014.2320153, IEEE Transactions on Biomedical Engineering 9
for precision, we can adjust the decision boundary according to the relative weighting of events when training with field data. Also, it is likely that certain players may generate a much greater number of off-teeth non-impact events on the field. So even though the IR proximity subsystem did not significantly improve precision from SVM alone in our lab evaluation (from 0.97 to 1, Table III), it will be essential on the field to ensure high precision. For field deployment, we may optimize for either sensitivity or precision by adjusting the decision boundary of our classification subsystems. A system with perfect sensitivity does not miss any head impacts, which is ideal for clinical use as a trauma screening device. For head injury mechanism research, classification precision may be more important, since we need to correlate head kinematics with cognitive function changes, and false positive events could lead to erroneous conclusions. Considering that the present system already demonstrates high sensitivity and precision, we can aim to optimize for sensitivity, sacrifice some precision, and reject the remaining false positives by verifying events through video. In practice, poor precision of the acceleration thresholding algorithm leads to a large number of false positives. In order to extract head impacts, recorded events need to be manually verified by reviewing game or practice videos, such as what was done in a study by Daniel et al. [18]. Although video verification ensures fidelity of data by substantially enhancing accuracy, it is a lengthy and tedious task given a large number of subjects and data collection events. Our system has the potential to eliminate the need for video verification once adapted for the field. Future field adaptation and deployment of the head impact detection system is aided by the simplicity of the design. Implementing the IR proximity subsystem only required the addition of a small low-power IR proximity sensing module to existing hardware, and reliable rejection of off-teeth events was achieved by applying a pre-defined threshold on one IR sample per recorded event. The SVM classifier, once trained on field data to obtain a suitable decision boundary, will be computationally inexpensive to apply since it only involves dot-product operations [31] on the PSD features, which can also be efficiently computed [49]. Therefore, both classification subsystems are readily built into data post-processing algorithms or incorporated into the current embedded system for real-time classification. V. C ONCLUSION In a controlled laboratory setting, a novel head impact detection system had substantially improved performance over acceleration thresholding. IR proximity sensing helped to reliably reject events where the device was not fixated to the teeth, and SVM classification helped reject most of the remaining non-impact events. Since more complex impact and non-impact conditions are expected on the field, we anticipate the necessity to train and validate the system using field data to optimize field performance. Once adapted for field deployment, this system has the potential to more sensitively and precisely capture head impacts for blunt head injury
research. It also has clinical potential to be incorporated into on-field screening devices for real-time identification of head trauma. ACKNOWLEDGMENT The authors would like to thank the Stanford Department of Athletics (Palo Alto, CA) for supporting this research. The study was funded by the National Institute of Health and the David and Lucile Packard Foundation. A patent application has been filed for the technology described in this paper and will be assigned to Stanford University [50]. Royalties gained from any intellectual property granted for this work will be shared among the inventors, the department, and the school, according to Stanford’s technology licensing policies. R EFERENCES [1] A. Ommaya, L. Thibault, and F. A. Bandak, “Mechanisms of impact head injury,” Int. J. Impact Eng, vol. 15, no. 4, pp. 535–560, 1994. [2] C. Willyard, “Brain damage on the playing field,” Nature, Feb. 2011. [3] J. P. Kelly, “Concussion in sports: guidelines for the prevention of catastrophic outcome,” JAMA, vol. 266, no. 20, p. 2867, Nov. 1991. [4] B. D. Jordan, “Acute and chronic brain injury in United States National Team Soccer Players.” Am J Sport Med, vol. 24, no. 5, pp. 704–5, 1996. [5] C. W. Hoge, D. McGurk, J. L. Thomas, A. L. Cox, C. C. Engel, and C. A. Castro, “Mild traumatic brain injury in U.S. soldiers returning from Iraq,” New Engl J Med, vol. 358, no. 5, pp. 453–463, 2008. [6] S. Abrahams, S. Mc Fie, J. Patricios, M. Posthumus, and A. V. September, “Risk factors for sports concussion: an evidence-based systematic review.” Brit J Sport Med, pp. 1–9, Sep. 2013. [7] S. T. DeKosky, K. Blennow, M. D. Ikonomovic, and S. Gandy, “Acute and chronic traumatic encephalopathies: pathogenesis and biomarkers.” Nat Rev Neurol, vol. 9, no. 4, pp. 192–200, Apr. 2013. [8] C. M. Baugh, J. M. Stamm, D. O. Riley, B. E. Gavett, M. E. Shenton, A. Lin, C. J. Nowinski, R. C. Cantu, A. C. McKee, and R. A. Stern, “Chronic traumatic encephalopathy: neurodegeneration following repetitive concussive and subconcussive brain trauma.” Brain Imaging Behav, May 2012. [9] K. M. Guskiewicz, M. McCrea, S. W. Marshall, R. C. Cantu, C. Randolph, W. Barr, J. A. Onate, and J. P. Kelly, “Cumulative effects associated with recurrent concussion in collegiate football players: the NCAA Concussion Study.” JAMA, vol. 290, no. 19, pp. 2549–55, Nov. 2003. [10] Revised Code of Washington 28A.600.190, “Youth sports, concussion and head injury guidelines, injured athlete restrictions (Zackery Lystedt law),” 2009. [11] I. J. S. Williamson and D. Goodman, “Converging evidence for the under-reporting of concussions in youth ice hockey.” Brit J Sport Med, vol. 40, no. 2, pp. 128–32, Feb. 2006. [12] E. L. Breedlove, M. Robinson, T. M. Talavage, K. E. Morigaki, U. Yoruk, K. O’Keefe, J. King, L. J. Leverenz, J. W. Gilger, and E. a. Nauman, “Biomechanical correlates of symptomatic and asymptomatic neurophysiological impairment in high school football.” J Biomech, pp. 1–8, Feb. 2012. [13] J. G. Beckwith, R. M. Greenwald, J. J. Chu, J. J. Crisco, S. Rowson, S. M. Duma, S. P. Broglio, T. W. McAllister, K. M. Guskiewicz, J. P. Mihalik, S. Anderson, B. Schnebel, P. G. Brolinson, and M. W. Collins, “Head impact exposure sustained by football players on days of diagnosed concussion.” Med Sci Sports Exerc, vol. 45, no. 4, pp. 737–46, Apr. 2013. [14] N. Marchi, J. J. Bazarian, V. Puvenna, M. Janigro, C. Ghosh, J. Zhong, T. Zhu, E. Blackman, D. Stewart, J. Ellis, R. Butler, and D. Janigro, “Consequences of repeated blood-brain barrier disruption in football players,” PLoS ONE, vol. 8, no. 3, p. e56805, Mar. 2013. [15] S. M. Duma, S. J. Manoogian, W. R. Bussone, P. G. Brolinson, M. W. Goforth, J. J. Donnenwerth, R. M. Greenwald, J. J. Chu, and J. J. Crisco, “Analysis of real-time head accelerations in collegiate football players.” Clin J Sport Med, vol. 15, no. 1, pp. 3–8, Jan. 2005. [16] S. Rowson, J. G. Beckwith, J. J. Chu, D. S. Leonard, R. M. Greenwald, and S. M. Duma, “A six degree of freedom head acceleration measurement device for use in football.” J Appl Biomech, vol. 27, no. 1, pp. 8–14, Feb. 2011.
0018-9294 (c) 2013 IEEE. Personal use is permitted, but republication/redistribution requires IEEE permission. See http://www.ieee.org/publications_standards/publications/rights/index.html for more information.
This article has been accepted for publication in a future issue of this journal, but has not been fully edited. Content may change prior to final publication. Citation information: DOI 10.1109/TBME.2014.2320153, IEEE Transactions on Biomedical Engineering 10
[17] M. A. Allison, Y. U. N. S. Kang, J. H. B. Iv, M. R. Maltese, and K. B. Arbogast, “Validation of a helmet-based system to measure head impact biomechanics in ice hockey,” Med Sci Sports Exerc, vol. 46, no. 1, pp. 115–123, 2014. [18] R. W. Daniel, S. Rowson, and S. M. Duma, “Head impact exposure in youth football.” Ann Biomed Eng, vol. 40, no. 4, pp. 976–81, Apr. 2012. [19] J. J. Crisco, B. J. Wilcox, J. G. Beckwith, J. J. Chu, A.-C. Duhaime, S. Rowson, S. M. Duma, A. C. Maerlender, T. W. McAllister, and R. M. Greenwald, “Head impact exposure in collegiate football players.” J Biomech, vol. 44, no. 15, pp. 2673–8, Oct. 2011. [20] N. Reed, T. Taha, M. Keightley, C. Duggan, J. Cubos, J. Baker, B. Faught, M. Mcpherson, and W. Montelpare, “Measurement of head impacts in youth ice hockey players,” Int J Sports Med, vol. 31, pp. 826–833, 2010. [21] J. T. Gwin, J. J. Chu, T. a. McAllister, R. M. Greenwald, R. Greenwald, a. Ashare, and S. W. Dean, “In situ measures of head impact acceleration in NCAA Division I Mens Ice Hockey: implications for ASTM F1045 and other ice hockey helmet standards,” J ASTM Int, vol. 6, no. 6, p. 101848, 2009. [22] S. Rowson and S. M. Duma, “Brain Injury Prediction: Assessing the Combined Probability of Concussion Using Linear and Rotational Head Acceleration.” Annals of biomedical engineering, Jan. 2013. [23] J. R. Funk, S. Rowson, R. W. Daniel, and S. M. Duma, “Validation of concussion risk curves for collegiate football players derived from HITS data,” Ann Biomed Eng, vol. 40, no. 1, pp. 79–89, 2012. [24] R. Jadischke, D. C. Viano, N. Dau, A. I. King, and J. McCarthy, “On the accuracy of the Head Impact Telemetry (HIT) System used in football helmets.” J Biomech, vol. 46, no. 13, pp. 2310–5, Sep. 2013. [25] D. B. Camarillo, P. B. Shull, J. Mattson, R. Shultz, and D. Garza, “An instrumented mouthguard for measuring linear and angular head impact kinematics in American football.” Ann Biomed Eng, Apr. 2013. [26] S. Rowson, G. Brolinson, M. Goforth, D. Dietter, and S. M. Duma, “Linear and angular head acceleration measurements in collegiate football.” J Biomech Eng, vol. 131, no. 6, p. 061016, Jun. 2009. [27] S. Rowson, S. M. Duma, J. G. Beckwith, J. J. Chu, R. M. Greenwald, J. J. Crisco, P. G. Brolinson, A.-C. Duhaime, T. W. McAllister, and A. C. Maerlender, “Rotational head kinematics in football impacts: an injury risk function for concussion.” Ann Biomed Eng, vol. 40, no. 1, pp. 1–13, Jan. 2012. [28] K. Hinckley, J. Pierce, M. Sinclair, and E. Horvitz, “Sensing techniques for mobile interaction,” Proceedings of the 13th annual ACM symposium on user interface software and technology, pp. 91–100, 2000. [29] G. Benet, F. Blanes, J. E. Sim´o, and P. P´erez, “Using infrared sensors for distance measurement in mobile robots,” Robot Auton Syst, vol. 40, no. 4, pp. 255–266, 2002. [30] J. B. Hummel, M. R. Bax, M. L. Figl, Y. Kang, C. Maurer Jr, W. W. Birkfellner, H. Bergmann, and R. Shahidi, “Design and application of an assessment protocol for electromagnetic tracking systems,” Med Phys, vol. 32, p. 2371, 2005. [31] C. Cortes and V. Vapnik, “Support-vector networks,” Mach Learn, vol. 20, no. 3, pp. 273–297, Sep. 1995. [32] C. Schuldt, I. Laptev, and B. Caputo, “Recognizing human actions: a local SVM approach,” in Proceedings of the 17th international conference on pattern recognition, vol. 3. IEEE, 2004, pp. 32–36 Vol.3. [33] N. Ravi, N. Dandekar, P. Mysore, and M. L. Littman, “Activity recognition from accelerometer data,” in AAAI, 2005, pp. 1541–1546. [34] Shuangquan Wang, Jie Yang, Ningjiang Chen, Xin Chen, and Qinfeng Zhang, “Human activity recognition with user-free accelerometers in the sensor networks,” in 2005 International Conference on Neural Networks and Brain, vol. 2. IEEE, 2005, pp. 1212–1217. [35] Youngwook Kim and Hao Ling, “Human activity classification based on micro-doppler signatures using a support vector machine,” IEEE Trans Geosci Remote, vol. 47, no. 5, pp. 1328–1337, May 2009. [36] I. Guyon and A. Elisseeff, “An introduction to variable and feature selection,” J Mach Learn Res, vol. 3, pp. 1157–1182, 2003. [37] T. Fawcett, “ROC graphs: Notes and practical considerations for researchers,” Mach Learn, pp. 1–38, 2004. [38] C. E. Metz, “Basic principles of ROC analysis,” vol. 8, no. 4, pp. 283– 298, 1978. [39] T. Fawcett, “An introduction to ROC analysis,” Pattern Recogn Lett, vol. 27, no. 8, pp. 861–874, Jun. 2006. [40] Q.-S. Xu and Y.-Z. Liang, “Monte Carlo cross validation,” Chemometr Intell Lab, vol. 56, no. 1, pp. 1–11, 2001. [41] S. Geisser, “The predictive sample reuse method with applications,” J Am Stat Association Assoc, vol. 70, no. 350, pp. 320–328, 1975.
[42] B. Westerman, P. M. Stringfellow, and J. A. Eccleston, “EVA mouthguards: how thick should they be?” Dental Traumatol, vol. 18, no. 1, pp. 24–27, 2002. [43] P. Magne, G. O. Gallucci, and U. C. Belser, “Anatomic crown width/length ratios of unworn and worn maxillary teeth in white subjects.” J Prosthet Dent, vol. 89, no. 5, pp. 453–61, May 2003. [44] R. M. Greenwald and J. J. Chu, “Power management of a system for measuring the acceleration of a body part,” Aug. 2005 US 11/031,970. [45] D. Fried, R. E. Glena, J. D. Featherstone, and W. Seka, “Nature of light scattering in dental enamel and dentin at visible and near-infrared wavelengths.” Appl Optics, vol. 34, no. 7, pp. 1278–85, Mar. 1995. [46] A. Joiner, “Tooth colour: a review of the literature,” J Dent, vol. 32, pp. 3–12, 2004. [47] R. Langer, H. Brem, and D. Tapper, “Biocompatibility of polymeric delivery systems for macromolecules,” J Biomed Mater Res, vol. 15, no. 2, pp. 267–277, 1981. [48] S. Rowson and S. M. Duma, “Development of the star evaluation system for football helmets: integrating player head impact exposure and risk of concussion,” Ann Biomed Eng, vol. 39, no. 8, pp. 2130–2140, 2011. [49] G. Asada, M. Dong, T. Lin, F. Newberg, G. Pottie, W. Kaiser, and H. Marcy, “Wireless integrated network sensors: low power systems on a chip,” in Proceedings of the 24th European Solid-State Circuits Conference. IEEE, 1998, pp. 9–16. [50] B. Cam, D. B. Camarillo, and L. C. Wu, “Device for detecting on-body impacts,” U.S. Patent Application No. 14/199,716, 2014.
Lyndia C. Wu Lyndia Wu received the B.A.Sc degree in Engineering Science with a Biomedical Engineering Major from the University of Toronto in 2012. She is currently a Bioengineering PhD student at Stanford University. Her research interests are in medical devices, with past projects ranging from MEMS design, MRI imaging coil development, and radiotherapy ergonomics. Her PhD research focuses on investigating mild traumatic brain injury mechanisms, and developing translational tools to aid in accurate and objective diagnosis.
Livia Zarnescu Livia Zarnescu received the B.Sc. degree in Optical Engineering and Mathematics from the University of Arizona, Tucson, Arizona in 2010, and the M.S. degree in bioengineering from Stanford University, Stanford, California in 2012. She is working toward the Ph.D. degree in the Department of Bioengineering at Stanford University, Stanford, California. Her research interests include cell mechanics, microscopy, machine learning, and bioinformatics with applications to developmental biology.
Vaibhav Nangia Vaibhav Nangia received a B.E in Mechanical Engineering from PEC University of Technology, Chandigarh, India in 2011 and a M.S in Mechanical Engineering from Stanford University in 2013 with a focus in Mechatronics. His previous work includes surgical robotics as well as noninvasive medical device development for patients with gait disorders. As a part of his PhD research at Stanford, he is interested in using his electromechanical design skills to continue to help build smart medical devices that make people’s lives better.
0018-9294 (c) 2013 IEEE. Personal use is permitted, but republication/redistribution requires IEEE permission. See http://www.ieee.org/publications_standards/publications/rights/index.html for more information.
This article has been accepted for publication in a future issue of this journal, but has not been fully edited. Content may change prior to final publication. Citation information: DOI 10.1109/TBME.2014.2320153, IEEE Transactions on Biomedical Engineering 11
Bruce Cam Bruce Cam received the B.Sc degree in Mechanical Engineering with a Biomechanics minor from the University of Florida in 2012. He is currently pursuing a M.Sc. in Mechanical Engineering at Stanford University. He has previously performed research on the neural control of hemiparetic gait, and his interests include dynamics, biomechanics, and medical devices.
David B. Camarillo David Camarillo is an Assistant Professor of Bioengineering at Stanford University. He completed his undergraduate degree in Mechanical and Aerospace Engineering at Princeton University, and his Ph.D. in Mechanical Engineering at Stanford. Both his graduate work and industry experience with Intuitive Surgical and Hansen Medical were in the area of surgical robotics. Dr. Camarillo performed his postdoctoral research in Biophysics at the University of California, San Francisco in 2011. He is an expert in instrumentation and biomechanics whose research interests include medical technology design as it applies to mild traumatic brain injury, in vivo microscopy for infertility, and flexible robotics for cardiovascular therapy. He directs a National Institute of Health (NIH) funded laboratory working to solve these problems.
0018-9294 (c) 2013 IEEE. Personal use is permitted, but republication/redistribution requires IEEE permission. See http://www.ieee.org/publications_standards/publications/rights/index.html for more information.