A Human-Centered Semantic Service Platform for the Digital Ecosystems Environment1 Hai Dong, Farookh Khadeer Hussain, Elizabeth Chang
Received: Accepted:
Abstract Digital Ecosystems (DEST) have emerged with the purpose of enhancing the communications among small and medium enterprises (SMEs) within the worldwide Business Ecosystem. However, because of the diversity and heterogeneity of the services in the DEST environment, existing commercial products or research outputs cannot be directly applied to this field so as to fulfill the requirements of SMEs. Humancentered computing has been applied to many areas, such as social classification, community-based ontology evolution, and more importantly, human-centered systems. In this paper, we propose a framework for a human-centered semantic service platform, in order to address the issue in the DEST environment. This framework incorporates the features of human-centered metadata publishing, maintenance and clustering, community-based ontology revolution and human-centered service retrieval, evaluation and ranking. To thoroughly validate the framework, we implement a prototype in the transport service domain, and conduct a series of evaluation experiments on the basis of this prototype.
Keywords: digital ecosystems (abbreviated as DEST), human-centered computing, human-centered systems, ontology revolution, QoS evaluation, service platform
H. Dong F. K. Hussain E. Chang Digital Ecosystems and Business Intelligence Institute, Curtin University of Technology, Bentley, WA 6102, Australia H. Dong e-mail:
[email protected] F. K. Hussain e-mail:
[email protected] E. Chang e-mail:
[email protected]
1
Introduction
Since the end of last century, the barriers that existed in the world economic environment have gradually collapsed. The worldwide industries, economic sectors, organizations and functions of organization are linked and networked as a collaborative environment, which Moore has named a “Business Ecosystem” [1], from the biological perspective. The Business Ecosystem is founded by interacting organizations and individuals, in which most of the participants are small and medium enterprises (SMEs) [2]. The SMEs heavily rely on the social and business activities with their suppliers, clients, and business partners. The current information and communication technologies (ICT), however, cannot sufficiently facilitate such activities. Digital Ecosystems (DEST) is defined 1
This is the preprint of the paper below. Hai Dong, Farookh Khadeer Hussain, and Elizabeth Chang. 2010. A Human-Centered Semantic Service Platform for the Digital Ecosystems Environment. World Wide Web 13, 1-2 (March 2010), 75-103. DOI=10.1007/s11280-009-0081-5 http://dx.doi.org/10.1007/s11280-009-0081-5. The final publication is available at link.springer.com
as “an open, loosely coupled, domain clustered, demand-driven, self-organizing and agent-based environment, in which each species is proactive and responsible for its own benefit and profit” [3, 4]. The initiative of DEST is to provide a favorable ICT environment for the sustainable development of SMEs. Services involved in the DEST environment have the speciality of diversity and heterogeneity, including individual services, such as eating and drinking, business/organizational services, such as business transactions, web services and so forth. These services are intermingled without enough semantic support. However, in the existing literature, there is no unified methodology to semantically cluster these services. From the perspective of services, SMEs in the DEST can be divided into service providers and service requesters. A service provider could be a service requester at the same time. Because of the diversity and heterogeneity of DEST services and the lack of quality of services (QoS) information, service requesters cannot easily find a trustworthy service provider who can provide a reliable service. Moreover, there is no special platform designed to allow service providers to register and publish their services. As a result, the lack of a service platform for special service registry, semantic-supported service clustering, and trustworthy and reliable service search becomes a critical issue for the DEST. This motivates us to design an integrated service platform for SMEs to publish services, to semantically cluster services, to precisely search services, to domain-specifically evaluate QoS, and to rank services based on the QoS, which could greatly facilitate the communication among SMEs in the real life. Human-centered computing (HCC) is a set of methodologies that applies to any field in which humans directly interact with the computer-aided devices and systems, which is an interdisciplinary research field that aims at relating system design and development to human conditions [5]. According to Hoffman, HCC can be defined as “the development, evaluation, and dissemination of technology that is intended to amplify and extend the human capabilities to: 1) perceive, understand, reason, decide, and collaborate; 2) conduct cognitive work; 3) achieve, maintain, and exercise expertise [6].” HCC integrates the discipline of computer science, human science with the purpose of human-centered system design. HCC closely relates to the field of human-computer interface (HCI) and information science [5]. The notion of HCC has been experimented with in many areas, such as social classification [7], community-based ontology evolution [8] and so forth. In recent years, there has been an increasing interest in the adoption of HCC into system design, giving rise to the concept of a Human-centered system (HCS). HCS is a system in which humans, supported by computerized aids, play a key role [9]. Typical examples include engineering processes, information systems, and so on. These systems share common features that can be summarized as follows: 1) humans have a central role in performing the activities needed to accomplish the process goals; and 2) large amounts of information are persistently stored and managed by means of computers [10]. It seems that these HCC methodologies could provide an ideal means of solving the issues in the DEST. The semantic web is an ongoing project that aims to express the meaning of web contents [11]. It embodies many technologies that can be adopted to enrich the semantics of objects such as data from a database [12]. Semantic web is not a new topic in the service field, and many applications, such as Web Ontology Language for Services (OWL-S)-annotated web services [13], ontologybased service discovery and matchmaking [14] etc., have been developed in this field. Based on the motivation above, in this paper, we propose a conceptual framework of HCS – a human-centered semantic service platform for the DEST environment. By means of combining the notion of HCC and the semantic web technologies, the proposed service platform will function in accordance with the following objectives: assisting service providers to advertise (publish) services; allowing service providers to self-define the clustering of their services based on specific service domain knowledge; using domain-specific knowledge to help service requesters to denote their query intentions; allowing service requesters to evaluate and rank services by domain-specific service criteria. The rest of the paper is organized as follows: in Section 2 the related works with respect to service platforms are briefly introduced; in Section 3 we present the overall framework of the human-centered semantic service platform; from Section 4 to Section 8 we explain each component of the framework in detail; in Section 9 we implement a series of experiments to evaluate the system framework; in the final section, we draw a conclusion to the research and indicate our future work.
2
Related works
The existing service platforms can be classified into two main categories, which are the platforms for actual services such as business services, and the platforms for web services. For the actual service platforms, there are several commercial products available in real life. For example, GoogleTM Local Business Centre (LBC) is an ad hoc function of GoogleTM map, which enables local businesses to advertise their products or services on the GoogleTM map. When a user locates a certain area on the map and searches for a product or service by keywords, the LBC can retrieve all the registered businesses that can provide the required product or service in that area. Users also can rate the businesses by assigning one to five stars or by providing comments to the business. Yahoo! Local and YellowpagesTM simultaneously allow two types of local business search – map-based search and directory-based search. Similarly, users also can evaluate the reputation of businesses by the star-rating system and the comment system. For the web service platforms, most of the products are still in the research phase, which aim to design service platforms as middleware to support web services. Here we introduce some typical examples. Liu et al. designed a framework of a composite e-service platform with recommendation functions. This e-service platform is able to assist users to discover e-services through semantic predicates. A Universal Description Discovery and Integration (UDDI) is employed to provide directory services for registering and search services. Web Service Description Language (WSDL) is used to describe the usage of e-services, while Simple Open Process Protocol (SOAP) is employed to exchange transaction messages between service providers and requesters. They design a workflow model to represent composite e-services, which enables the derivation of value-added e-services. A data mining approach is used for recommending composite e-services [15]. WebSphere application server (v7) is a web service platform designed by IBM. It provides users with the functions of publishing, reusing, integrating and managing SOA applications and web services. WebSphere is capable of hosting SOA services and web services based on multiple standards, such as SOAP 1.2, WSDL, and UDDI [16]. E-speak is an open source web service platform project proposed by HP in 1999, with the purpose of supporting the development, deployment and intelligent interactions of e-services. The platform consists of service framework specification, service engine and trading community edition. The project finally had to be terminated in 2004 due to several non-technical reasons [17]. Cibran et al. proposed an abstract Web Services Management Layer (WSML) between client applications and web services. The WSML can decouple web services from client applications, which makes possible service integration. In terms of the WSML, multiple available services can be selected, composed and hot-swapped in order to fulfill a service request [18]. Apart from the above general web service platforms, some researches are concerned with supporting web services in certain specific environments. IBM proposed an online game service platform with on-demand grid technology. In order to make the best use of the grid infrastructure for on-line gaming, they developed a set of software services based on the open source Globus Toolkit grid implementation. The gaming middleware provides player management, publisher management, and system management services designed to facilitate the hosting of on-line games in a grid environment [19, 20]. iMobile was proposed by AT&T Research, which is an enterprise mobile service platform that supports user and device profiles for personalization, performs appropriate content transcoding and adaptation, and invokes the proper applets and infolets to answer requests from a devlet. iMobile consists of devlets that provide protocol interfaces to different wireless devices, infolets that access and transcode information based on device profiles, and an applet implements the application logic by post-processing information obtained by the various infolets. The iMobile architecture allows new mobile devices and protocols to be added to its framework without requiring any changes to the operational logic for information retrieval and delivery [21]. Grieco et al. projected a scalable and dynamic intermediary infrastructure for publishing, managing, and delivering edge computing services (EcSs) [22]. EcSs refer to the value-added proxy services working on the edge of the network, which are closer to end users. This infrastructure is build upon IBM’s Web-based Intermediaries (WBI) which is designed for requesting, sending, editing and monitoring web intermediaries [23, 24]. To illustrate the difference of our proposed framework, in Table 1, we present a comparison between the service platforms introduced above and the proposed service platform. First of all, it can be observed that the existing service platforms are designed for either actual services or web services. As introduced in Section 1, the DEST services have the speciality of diversity, which combines all available services in the real world. Therefore, these service platforms cannot fulfill the requirement of DEST. Our proposed service platform will be adaptable 3
to all existing services. Although some commercial service platforms, such as GoogleTM LBC, Yahoo! Local and YellowpagesTM, provide some intuitive functions for service registry, they are not special service platforms and they mix the information of products and services. Moreover, the existing service platforms do not have sufficient service domain knowledge to enable service providers to semantically cluster registered service information, which could generate errors when users search for services by entering ambiguous or incorrect keywords. Our proposed service platform can realize this objective, by using the HCC and semantic web technologies. Last but not least, whilst some search engines provide a simple evaluation system (star-rating or comment) for users to evaluate the QoS in spite of service domain differences, these evaluations cannot truly indicate the reputation of service providers, owing to the differences of evaluation criteria in different service domains. In contrast, our service platform proposes to enable users to evaluate and rank services based on domain-specific criteria. Table 1
Comparison of the existing service platforms and our proposed service platfrom. Served Objects
Actual Services ● GoogleTM LBC ● Yahoo! Local ● YellowpagesTM E-Service Platform WebSphere application server WSML E-speak Online game service platform iMobile EcS platform The proposed ● service platform
Service Platforms
3
Web Services
Special Service Platform
Service Registry ● ● ●
●
●
●
●
●
●
● ●
● ●
● ●
●
●
●
● ●
● ●
● ●
●
●
●
Usercentered Service Clustering
●
Usercentered Service Search
UserUserdriven driven Service Service Evaluation Ranking
●
●
●
Framework of the human-centered semantic service platform for DEST
This research proposes a service platform integrating various mediating facilities for service providers and service requesters in DEST, in terms of the human-centered notion. For service providers, a service platform is capable of publishing, updating and clustering metadata, as well as promoting service ontology evolution. For service requesters, a service platform is capable of searching, evaluating and ranking services on demand. Moreover, in our proposed framework, a service ontology base is employed for semantic-web-supported service clustering and retrieval, and a service metadata base is employed to store and maintain the service metadata created by service providers. The human-centered notion is utilized to enhance the performance of five major modules in the service platform, including a user-driven service metadata publishing and updating module, a user-centered service metadata clustering module, a user-driven ontology evolution module, a user-centered service search module, and a user-driven service evaluation and ranking module, each of which is described below. First, we design a unified service metadata format for the user-driven service metadata publishing and updating module. By means of the service metadata, service providers can publish and maintain their service entities; service requesters can discover a desired service entity based on its attributes. The designed user-driven service metadata is presented in Section 4. Second, we design a hybrid service ontology concept and metadata matching model for the usercentered service metadata clustering module. This model includes an ontology concept-metadata matching model and a service-provider-oriented ontology concept-metadata matching model. The former can realize the function of automatic ontology-based service metadata clustering, and the latter can realize the feature of user-driven ontology-based service metadata clustering, as a complement of the former. The hybrid ontology concept and metadata matching model is introduced in Section 5.
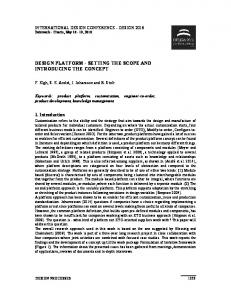
Third, we design a voting-based ontology update model for the user-driven ontology evolution module. This model incorporates the votes from normal users and domain experts in a servicedriven social network, in order to preserve the feasibility of ontologies for service providers. The voting-based ontology update model is described in Section 6. Fourth, we design a hybrid service search model for the user-centered service search module. This model integrates a user-driven service search model, and a SPARQL-based service search model. The former is applicable to the service requesters who have ambiguous knowledge about certain specific service domains, or who do not have a fixed service provider. The latter is applicable to the service requesters who have certain service domain knowledge or who have some information about a service provider. The hybrid service metadata search model is explained in Section 7. Finally, we design a service evaluation model for the user-driven service evaluation and ranking module. By means of this model, service requesters can evaluate a service provider’s performance based on multiple domain-specific industry criteria after a service transaction, and the service providers can be ranked according to their performance when providing same services. The service evaluation model is delivered in Section 8. The architecture view of the proposed semantic human-centered service platform is shown in Fig. 1, which indicates the components, workflows among the components, users and access boundaries of users. Human-Centered Semantic Service Platform User-Driven Ontology Evolution Module
User-Centered Service Metadata Clustering Module
Service Providers
Figure 1
4
Updates
Service Ontology Base
Searches
User-Centered Service Search Module
Matches between
Publishes/ User-Driven updates Service Metadata Service Metadata Publishing/Updating Base Module
Evaluates/ ranks
Service Requesters User-Driven Service Evaluation/ Ranking Module
The overall architecture of the human-centered semantic service platform.
Service metadata
Service metadata refers to the detailed description of a service entity, which is used to advertise or discover a service in registries. Service metadata benefits both service providers and service requesters. Service providers can advertise their service more precisely, while service requesters can discover desired e-services and providers more efficiently. Furthermore, service metadata facilitate the feature of metadata clustering through the parallel automatic and user-driven service concept-metadata matching approach. Fig. 2 shows a fragment of service metadata format in Web Ontology Language (OWL), which defines the properties of service metadata as: serviceName refers to the name of a service entity defined by the service provider who provides the service entity. For example, “taxi service” can be a service name. serviceDescription refers to the detailed description of a service entity, including its various activities. For example, the service description of a “taxi service” metadata can be “air-conditioned taxi cabs for airport transfer on flexible hours”. links refers to the semantically relevant service ontology concepts to a service metadata. This can be realized by storing a concept’s URI in this property. It is also a symmetric property, which means that all service ontology concepts have the same property for the semantically relevant metadata. In other words, if a concept’s URI is stored into the “links” property of a metadata, the metadata’s URI is also stored in the “links” property of the concept.
5
serviceLocation refers to the geographic area where a service entity can be carried out. It can be the name of a country, a state, or a suburb for different situations. serviceProvider refers to the name of a service provider who provides a service entity. In normal cases, it is a registration name of a company or organization which can be employed to uniquely identity itself. address refers to the address where a service provider can be located. contactDetails refers to detailed information regarding how a service provider can be contacted. They can be in the form of telephone, fax, e-mail and so on. Figure 2
5
Service metadata format in OWL.
Hybrid service ontology concept and metadata matching model
In this section, we present our method for clustering service metadata based on service ontologies. By means of this method, the semantic extent of service metadata can be enriched by the service ontologies. This provides the benefits of efficient service metadata management, precise service retrieval, and domain-specific service ranking. For the first benefit, if a service provider publishes multiple service metadata, s/he can obtain a clear understanding of the classification of the metadata based on service ontologies. For the second benefit, if a service requester does not know
any service providers who can provide a particular service, s/he can easily discover all relevant service providers by retrieving the desired service concept in service ontologies, which leads to a group of relevant service providers. For the final benefit, due to many service metadata linking to a service concept, a service concept can be regarded as a specific service domain, which raises the possibility of designing domain-specific service evaluation criteria and ranking the performance of service providers based on these criteria. In terms of a proposed hybrid service ontology concept and metadata matching model, the metadata clustering can be executed in parallel manners: 1) service metadata can be automatically linked to their semantically relevant service concepts; and 2) service providers can manually link their service metadata to their desired service concepts, which is an application of the humancentered notion to the metadata clustering process. Section 5.1 defines an ontology conceptmetadata matching model employed for realizing the first manner. Section 5.2 describes a serviceprovider-oriented ontology concept-metadata matching model for realizing the second manner. 5.1 Ontology concept-metadata matching model In this section, we first formally define the ontology concept model on which our work is built. Then we describe the ontology concept-metadata matching model and its working procedure. Ontology can be annotated by multiple ontology mark-up languages, such as Resource Description Framework (RDF)/RDF Schema (RDFS), DARPA Agent Markup Language and Ontology Inference Layer (DAML+OIL), OWL, and so forth. This paper focuses on the RDF/OWL family, but it is possible to extend our work to other formalisms as well [25]. RDF represents statements about web resources with the form (subject, property, object) named an RDF triple which defines that a resource, the subject, has a property whose value is the object [26]. This model can be represented as a labelled direct graph [27]. Apart from inheriting the model of RDF tuple, OWL has more facilities for expressing the meaning of semantics. One feature is that a subject (concept) can be represented as the tuple (subject name, data-type property, annotation property) [28], which asserts the possibility of defining a subject by its name, data-type property and annotation property. Here, our research focuses on this subject (concept) representation tuple. Thus, an ontology concept can be represented as C = (N, DP, AP), where N is the name (URI) of the ontology concept, and DP is the date-type property value of the concept, AP is the annotation property value of the concept. Our research tends to combine N, DP and AP to define C in a descriptive manner. This may lead to the possibility of retrieving a concept based on the traditional IR theories. The ontology concept-metadata matching model is built upon an Extended Case-Based Reasoning (ECBR) model, which is an index-term-based set-theoretic model [29, 30]. The ECBR model is used to calculate the similarity value of a concept cj to a metadata m, which is represented as Error! Objects cannot be created from editing field codes. 1 if sd k | (ki , gi (cd k j ) gi ( sd k )) f (cd k , sd ) 0 otherwise
where cdj is the content of the definition of a concept, ki is an index term; cdj = (cdk1, cdk2… cdkm), where cdk is the index terms that occurs with cdj, m is the number of index terms that occur with cdj; sd is the content of the service description property regarding a service metadata; sd = (sdk1, sdk2… sdkn), where sdk is the index terms that occur with sd, n is the number of index terms that occur with sd; gi is a function that returns weight associated with ki. The algorithm is employed in the procedure of ontology concept-metadata matching, which is shown in Fig. 3.
7
Input: C = (c1, c2…cm) is a sequence of the bottom-level service concepts in a service ontology, M = (m1, m2…mn) is a sequence of service metadata. Output: M is linked with C based on similarity values. Procedure: 1. For i = 1 to n 2. Fetch the service description of mi and store it into sdi 3. For j = 1 to m 4. Fetch the URI, annotation and data-type property values of cj and store it into cdj 5. Compute the similarity value of sdi and cdj by ECBR and store the value into sij 6. If sij > threshold then 7. Put URI of cj into the “links” property of mi 8. End if 9. End for 10. End for Figure 3
Ontology concept-metadata matching procedure.
One thing that needs to be noted is that a service metadata may be linked to more than one service concept due to the fact that a service entity may be relevant to multiple service domains (concepts), and analogously a service concept can be linked to many service metadata. 5.2 Service-provider-oriented ontology concept-metadata matching model Social classification is the process by which a community of users categorizes the resources in that community for their own use [31]. One objective of our research is to construct an online servicebased community in which service providers publish their services, and service requesters discover and evaluate the services. However, how to ensure preciseness and consistency when classifying the huge amount of service metadata is an issue. Although Section 5.1 presents a matching method to solve this issue, due to personal differences whereby everyone has his/her own opinion about the classification, the matching method still lacks the capability of resolving differences in understanding. Therefore, we create a service provider-oriented ontology concept-metadata matching model, as a result of the adoption of the notion of social classification in the matching process. The model performs a step-to-step process for the manual matching. The workflow of the matching process is shown in Fig. 4. After a user (user right: service provider) logs in to the semantic service platform, s/he obtains the right to access his/her own service metadata. Once the service provider gains access to a service metadata, the concept list stored in the “links” property of the metadata is obtained from the metadata base and displayed to the user. The user can then decide whether or not s/he needs to modify the concept list. If the answer is “yes”, the user needs to determine whether or not s/he needs to remove concepts from the concept list. If the answer is “yes”, the user may then delete the desired concepts. Following this, the user is required to decide whether or not s/he needs to add concepts to the concept list. If the answer is “yes”, the user can employ the user-driven semantic service search model (introduced in Section 7.1) to retrieve the desired concepts from the service ontology base, and add these concepts into the concept list. After all modifications have been completed and submitted by the user, a validation module will run to validate the URIs of concepts in the concept list. Once the modifications have passed the validation, the “links” property values of the metadata and the “links” property values of the corresponding concepts are updated.
Start
Access a service metadata
Service Metadata Base
Display a linked concept list
Modify the linked concept list?
Y
Remove concepts?
N
Y
Remove selected concepts
Add new concepts?
Y
N N
Execute the modifications
Search and select relevant concepts
Service Ontology Base
N Y
Display a failure information
Are the modifications valid?
Add selected concepts
N
Exit
Figure 4
6
Service provider-oriented ontology concept-metadata matching workflow.
Voting-based ontology evolution model
While most existing ontologies are designed by individuals or small groups of experts, actual ontology users are not involved in the development process. Such an ivory-towered ontology creating approach may lead to a weak community grounding. According to Tim Berners-Lee’s vision, online communities play an essential role in the mission of knowledge contribution [8]. Web 2.0, which provides various forms of platform for online communities [32], could be utilized to enhance the community grounding of ontologies, in order to improve the feasibility of ontologies in the community environment. To maintain the service ontologies in the ontology base of the service platform, we adopt the notion of Web 2.0 to design a voting-based ontology evolution model, and apply it in the userdriven ontology evolution module. Below is the definition of the voting-based ontology evolution model. Valuevoting is the voting result for a change request, which is the weighted average value of the average values of 1) The voting result for a change request from a user (Voteuser), varying among -1 – Disagree 0 – Neutral 1 – Agree 2) The voting result for a change request from a domain expert (VoteExpert), varying among -1 – Disagree 0 – Neutral 1 – Agree The score of Valuevoting can be obtained by 9
m
n
Valuevoting
i 1
VoteUseri n
Vote
E xp ert j
j 1
m
where n is the number of voting normal users for a given voting, m is the number of voting experts for a voting, α is the weight of the votes from normal users, β is the weight of the votes from experts, and α + β = 1. A threshold value is given to determine the overall result of a vote for change or otherwise. Fig. 5 shows the sequence diagram of the user-driven ontology evolution module, which illustrates the components and workflow of the module. When a user desires to change an ontology concept or ontology structure, s/he may submit the request through an ontology update requester interface. Once the request has been submitted, the request will be sent to a central user-driven ontology update module. This module will generate a voting procedure with a time limit, and send messages to all users on the service platform to ask for participation. When a user logs in to the service platform, according to their user rights (normal user or domain expert), they are able to access different voting interfaces and submit a vote. When the time has ended, the ontology update module will obtain the voting results from the two user groups, and compute the final result based on the voting-based ontology evolution model. The result will then be sent to all users’ voting interfaces and the platform administrator for the final decision.
Ontology Update Request Interface
User 1
Ontology Update Module
Normal User Voting Interface
Normal Users
Domain Expert Voting Interface
Domain Experts
Administrator
Submits a upate request to Sends the requests to Submits a voting request to Sends the request to Submits a vote to Sends the voting result to Submits a voting request to Sends the request to Submits a vote to Sends the voting result to
Calculates the final voting result Sends the final voting result to Sends the final voting result to Sends the final voting result to
Sends the final voting result to
Figure 5
7
Sequence diagram of the user-driven ontology evolution module.
Hybrid service search model
As mentioned preciously, the hybrid service search model is designed for different user conditions. For a user who cannot denote a service concept to conceptualize his/her query intention, the userdriven service search model can assist him/her to retrieve a service concept by means of a series of user-driven interactive processes. This model also applies to the situation where a user has no idea about any attributes of a service metadata. If a user has information about the attributes of a service metadata, the SPARQL-based service search model can then be applied. The idea of the former model is to utilize service ontologies to guide users to visit service metadata, and the latter is to directly access service metadata. In Sections 7.1 and 7.2 respectively we introduce the two models in detail. 7.1 User-driven service search model The user-driven service search model enables the human-centered notion to assist service requesters to denote the most proper service concept that can conceptualize users’ query intentions, and thus retrieve the service metadata to satisfy users’ service requirements. The working process of the model can be divided into two steps: 1) concept preparation based on user query; and 2) interactive query with users. The design purpose of the first step is to recommend to users a list of
similar concepts from an ontology for a user query. The second step is to expand the recommended concept list through a user-driven process, which helps users to capture the most appropriate concept by the ontology-represented domain knowledge. In the first step, the model utilizes WordNet® for user query expansion. As each ontology concept is defined as a paragraph of text description in Section 5.1, it is possible to use the IR algorithms to compute the similarity values between expanded query and concepts. The ontology concepts can then be selected based on a threshold and ranked according to their similarity values with query. Finally the URIs, annotation property values and data-type property values of the concepts are displayed to users. The algorithmic formulation of the first step is shown in Fig. 6. Input: q is a user query, C = (c1, c2…cm) is a concept graph of a service ontology. Output: C`, where C` is an array of selected concepts based on their similarity values with query q. Procedure: 1. Obtain synsets from WordNet for q and store them into s. 2. For i = 1 to m 3. Fetch the URI, annotation and data-type property values of ci and store it into cdi. 4. Compute the similarity value between q+s and cdi by algorithm and store the value into si. 5. If si > threshold then 6. Put URI of ci into C`. 7. End if 8. End for
Figure 6
Concept preparation based on user query.
In the second step, based on users’ selections, the search model is able to assist the users to denote concepts by the following interactions: On the returned concept list, users may decide which concept is closer to their query intentions by observing the property values of the concept. Once this has been determined, the users may click the selected concept. If the clicked concept is a parent concept in the ontology hierarchy, it displays all its children concepts. Users then need to choose a child concept that is closest to their query intentions. This is a recursive process until users select the bottom-level concept. Once users click a bottom-level concept, it then displays the URLs of all the metadata stored in its “links” property. Fig. 7 is an example of the process of an interactive query with a user. As can be seen, a user searches for a service with the terms “airplane transport”. The service search engine returns a list of ranked concepts, and each concept is identified by its URIs and described by its property values under the URI of the concept. If the user selects a concept that is a parent concept in an ontology (“Air_Transport” in this example), the search interface displays all its subconcepts described and ranked in the same manner as that of their parent concept. Similar to the prior part, the user then needs to choose a concept among these subconcepts. In this case, the user chooses an “Air_Cargo_Abstract” concept and this concept still has subconcepts. Therefore, all its subconcepts are displayed to the user. These subconcepts are bottom-level concepts in the ontology as the number of URIs of metadata stored in their “Links” property are displayed after the URIs of the concepts, e.g., “Air_Cargo (73)”.
11
Figure 7
Example of interactive query with users.
7.2 SPARQL-based service search model As described previously, the SPARQL-based service search model is applicable to the users who already have some information about a service metadata’s attributes. Users can retrieve a metadata by querying any of its attribute values, which is a convenient and time-saving search style. The search model is built upon the basis of SPARQL, which can be found in Fig. 8.
Prefix meta: SELECT ?Links WHERE { ?Links meta:serviceName ?ServiceName. ?Links meta:serviceDescription ?ServDesc. ?Links meta:serviceLocation ?Location. ?Links meta:serviceProvider ?Name. ?Links meta:address ?Address. ?Links meta:contactDetails ?Phone. ?Links meta:contactDetails ?Fax. ?Links meta:contactDetails ?Email. ?Links meta:contactDetails ?WebSite. FILTER regex (?ServiceName, var1, "i") FILTER regex (?ServDesc, var2, "i") FILTER regex (?Location, var3, "i") FILTER regex (?Name, var4, "i") FILTER regex (?Address, var5, "i") FILTER regex (?Phone, var6, "i") FILTER regex (?Fax, var7, "i") FILTER regex (?Email, var8, "i") FILTER regex (?WebSite, var9, "i") } Figure 8
8
Code of the SPARQL-based service search model
Service evaluation model
The service evaluation model allows a service requester to evaluate the performance of a service provider in a service transaction. The evaluation model is based on the theory of CCCI (Correlation, Commitment, Clarity and Importance) Metrics, which measures the extent of the trustworthiness of each service requester towards a service provider for the same service from the perspective of commitment, clarity and importance, and thus gain the reputation value of the service provider from the perspective of the service [33-35]. In the CCCI Metrics, each service concept consists of a series of domain-specific evaluation criteria which are constituted by domain experts. The service metadata linked by a service concept must be evaluated by the criteria that belong to the concept. If a user evaluates a service metadata under a service concept, for each criterion, the user can assign values to the service metadata from the perspective of commitment, clarity and importance. The model then integrates the values from all criteria and computes the trustworthiness of the service requester towards a service metadata under a service concept. The service provider’s reputation value for this service can be obtained by averaging all service requesters’ values for trustworthiness towards the service metadata. Analogously, the service providers’ reputation values for each criterion of this service metadata can be obtained by averaging all service requesters’ evaluation values towards each criterion. It is noted that a service metadata may link to more than one service concept as mentioned previously. Hence, the service metadata may have different evaluation criteria for different service concepts, and thus have different reputation values under different service concepts. By means of the service evaluation model, after a service requester retrieves a service metadata under a service concept, and makes a service transaction with the service provider who publishes this service metadata, s/he can evaluate his/her own trustworthiness value to the service provider within this service transaction. Once a trustworthiness value has been established, the reputation values of the service provider on this service metadata and on each criterion of the service metadata are recomputed and updated. Furthermore, the total reputation value and criterion-based reputation value can be used as conditions for multi-linear metadata ranking. The in-depth information with regard to the service evaluation model can be referenced from [36]. 9
System evaluation
The evaluation of the Human-Centered Semantic Service Platform can be divided into two parts as follows: 13
We will employ the method of implementation and functional testing to validate the whole conceptual framework. According to Hevner et al. [37]’s theory, the testing approach for a design research is to execute the system interfaces to discover failures and defects within their functions. For the mathematical algorithms involved in the conceptual framework, we will make use of the method of simulation to test their performances with artificial data [37].
9.1 System implementation and functional testing With the purpose of validating the system framework, we have implemented a Customized Semantic Service Search Engine (CSSSE) as the prototype of the user-centered semantic service platform in terms of JSP (Java Server Pages), JavaScript, Java Servlet, AJAX (Asynchronous JavaScript and XML), SQL (Structured Query Language) and Protégé-OWL. Following that, we target the Australian transport service field as the application domain of our proposed platform. In order to obtain knowledge with regard to the Australian transport services, we design a transport service ontology by referring to hundreds of Australian transport companies’ websites, Wikipedia, and Open Directory Project (ODP). The transport service ontology is stored in the service ontology base. Furthermore, we target the transport services registered in the Australian Yellowpages® website as the data source of our service metadata. A crawler is especially designed to fetch the transport service information from the website, and convert them into transport service metadata, which are stored in the service metadata base. The detailed implementation regarding the crawler can be referenced from [30]. The five modules introduced in the Section 3 are implemented respectively, and are described as follows: First of all, we combine the user-driven service metadata publishing/updating module and the second part of the user-centered service metadata clustering module – service-provider-oriented ontology concept-metadata matching model together to design a service provider editing interface. By means of the interface, once a service provider logs in, s/he can publish a service metadata and edit all the property values of the service metadata that s/he publishes, except for the property of “service provider name”, as it is the legally registered name of the service provider. The service provider can also change the concepts in the “Links” property of a metadata, by employing a search engine to search for the relevant service concepts in an ontology. The mechanism of the search engine is similar to the semantic service search engine to be introduced below. The screenshot of the service provider editing interface is shown in Fig. 9. Additionally, another part of the usercentered service metadata clustering module – ontology concept-metadata matching model is implemented by a semantic crawler introduced in [29, 30].
Figure 9
Screenshot of the service provider editing interface.
Secondly, we implement a voting system for the ontology evolution module. If a user desires to change an ontology structure or an ontology concept, s/he needs to fill an online ontology change
request form, in order to describe the contents and reasons for the change. Once the form has been submitted, the voting system will generate a new voting procedure, and assign a deadline. When other users gain access to the voting interface, they can vote for the new proposal. Once the deadline has been reached, the system administrator will determine whether or not the change will be implemented based on the final voting score. The screenshot of the voting system can be seen in Fig. 10.
Figure 10
Screenshot of the user-driven ontology evolution module.
Thirdly, for the first step of the user-driven service search model – concept preparation for user query, we design four IR models to compute the similarity values between ontology concepts and user queries, which are ECBR and VSM (Vector Space Model), LSI (Latent Semantic Indexing) and BIR (Binary Independence Retrieval). The in-depth information regarding VSM can be referenced from [38, 39]; the information regarding LSI can be referred from [40]; the information regarding BIR can be referenced from [41]. The second step – interactive query with user is introduced in Section 7.1. The prototype and application scenario of the user-driven service search model can be found in Fig. 7. Fig. 11 shows the screenshot of the retrieved metadata result, once users have selected a bottom-level service concept. As an outcome of the service evaluation model, users are able to rank the metadata by multiple conditions, including the reputation values of the service metadata on each criterion (the values under “Quality”, “Quickness”, “Price” in Fig. 11) of the service concept, e.g., “Air_Cargo” in Fig. 11, or the overall reputation values (the values under “Reputation”). Users can also select the option “Browse by category” to follow a service ontology hierarchy to retrieve a service concept step-by-step. Another alternative way is clicking the link “Advanced search” to choose a SPARQL-based service search engine to directly retrieve the metadata by querying its property values.
15
Figure 11
Screenshot of the retrieved service metadata.
Finally, the prototype of the user-driven service evaluation module is shown in Fig. 12. As described previously, a service requester can evaluate a service metadata after s/he has made a transaction with the service provider who publishes the service metadata. Once the service requester finishes the service transaction, s/he can send an email to the system administrator to request a service evaluation for the service metadata under a service concept. The system administrator will send an email to the service requester to ask for confirmation. If the transaction is confirmed, the service requester will obtain the evaluation right. Once the service requester logs into the search engine, s/he can gain access to the service evaluation interface. The service requester needs to assign values to each criterion from the perspective of commitment (labelled as “Your evaluation” in Fig. 12) (0 to 6), clarity (0 or 1) and importance (1 to 3). Once the evaluation form has been submitted, the trustworthiness value (0 to 6) of the service requester on this metadata and each criterion of this metadata will be computed. The reputation value (0 to 6) of the service provider on this service metadata and each criterion of the service metadata (labelled as “Satisfaction value” in Fig. 12) then will be recomputed and updated according to the average trustworthiness values of all users.
Figure 12
Screenshot of the user-driven service evaluation module.
Table 2 is a functional checklist of the components comprised by the conceptual framework of the human-centered semantic service platform, which lists the primary functions that each module is proposed to realize. According to the prototype and use scenarios introduced above, it can be stated that all the proposed functions are realized in our CSSSE system. Therefore, the feasibility of the whole conceptual framework is validated by this system implementation. Table 2
Functional checklist of the components of the human-centered semantic service platform
Modules Proposed functions User-centered service metadata Automatic ontology concept-metadata matching Service-provider-oriented ontology concept-metadata matching clustering module User-driven service metadata User-driven service metadata publishing publishing/updating module User-driven service metadata updating User-driven ontology evolution module Voting-based ontology evolution User-centered service search User-driven service search module SPARQL-based service search User-driven service User-driven service evaluation evaluation/ranking module User-driven service ranking
Function realized? Yes Yes Yes Yes Yes Yes Yes Yes Yes
9.2 Evaluation of the ECBR model for ontology concept-metadata matching There are two parts in the conceptual framework that utilize mathematical models: 1) the ontology concept-metadata matching model and 2) the user-driven service search model. In the former part, an ECBR model is designed to realize its function. In this section, we describe the evaluation process of the ECBR model for the ontology concept-metadata matching. To evaluate the ECBR model for ontology concept-metadata matching, first of all we are required to construct the service ontology base and service metadata base. To realize the former, we build a four-tier transport service ontology with 304 concepts in Protégé-OWL. The in-depth information with respect to the ontology can be referenced from [42]. Next, we choose the business 17
webpages under the transport category on the Australian Yellowpages® website as the data source for constructing service metadata base. A semantic crawler deployed with the ECBR model is run to realize this task by downloading 1000 webpages and generating 1982 service metadata. We also implement a series of tests to evaluate the performance of the semantic crawler, which reveals some convincing results. The in-depth information with regard to the semantic crawler evaluation can be referenced from [30]. 9.3 Evaluation of the mathematical models for the service search As introduced in Section 9.1, there are four candidate models designed for the service search function, which are the ECBR, VSM, LSI and BIR model. In the following experiments, we concentrate on evaluating the performance of these models. Since all of the models belong to the field of IR, we attempt to utilize the IR performance indicators to evaluate them. Performance indicators for evaluating the four IR models for service search To evaluate our service search models, six performance indicators, from the field of IR, are employed: precision, recall, mean average precision, fallout rate, harmonic mean and F-measure. Precision in IR is used to measure the preciseness of a retrieval system [43]. In this experiment, precision is the proportion of retrieved relevant concepts in all retrieved concepts for a query, which can be represented as: Precision =
number of retrieved relevant concepts number of retrieved concepts
Before we introduce the definition of mean average precision, the concept of average precision should be defined. Average precision is the average of precision values at each retrieved relevant concept for a query, given that these concepts are ranked according to their computed similarity values. This indicator is used to measure how quickly and precisely a search engine works [43], and can be represented as: Average precision(S)=
sum ( precision @ retrieved relevant concept) number of retrieved relevant concepts
Mean average precision refers to the average of average precision values for a set of queries, and can be represented as: Mean average precision=
n i 1
Average precision(Si )
n
Recall in IR refers to the measure of effectiveness of a query system [43]. In this experiment, recall is the proportion of retrieved relevant concepts in all relevant concepts for a query, and can be represented as: Recall =
number of retrieved relevant concepts number of relevant concepts
All of the above indicators have the same limitation – they do not consider the number of nonrelevant concepts in a retrieved collection. In addition, if there is no relevant concept in the retrieved collection, recall cannot be defined. To solve this issue, we need another performance indicator – fallout rate. The fallout rate for a single concept is the proportion of retrieved nonrelevant concepts in the whole collection of non-relevant concepts in an ontology, and is represented as: Fallout rate =
Number of retrieved non-relevant concepts Number of non-relevant concepts
Opposite to the prior performance indicators, the lower the fallout value is, the better the search engine’s performance is. Harmonic mean (F-measure) in IR is used as an aggregated performance scale for the search engine [44]. In this experiment, harmonic mean is the average of precision and recall, which can be represented as:
Harmonic mean =
2 Precision Recall Precision+Recall
E-measure is another measure that combines precision and recall, and the difference is that users can specify the preference on recall or precision by configuring different weights [45]. In this experiment, we employ E-measure (β=2) that weights recall twice as much as precision, which can be represented as below: E-measure ( =2) =
5 Precision Recall 4 Precision+Recall
The following experiment will be executed based on the six performance indicators. Evaluations of the four IR models for service search To evaluate the performance of the four models, we conduct an experiment to test these models on the six indicators using a collection of 100 queries. These queries cover most of the general user requirements in the transport service domain. Furthermore, there are two major tasks involved in the experiment as follows: The first task is to find an optimal threshold for each IR model. The reason for this is that, in the service search process, after the similarity values between a query and concepts are computed, a threshold needs to be determined for filtering the relatively dissimilar concepts to obtain the optimal performance for each model. Owing to the difference between each model, the optimal threshold could be different. To choose the optimal threshold, we utilize the harmonic mean as the primary scale. The threshold scope is configured between 0 and 0.8 with an increment of 0.05 each time. The second task is to evaluate the overall performance of the four models and to choose the optimal model from this experiment. Since the date source of the service metadata is obtained from the Australian Yellowpages® website, as introduced in Section 9.2, the search engine working on this website uses the similar data source as our service search engine. Hence, it is theoretically feasible to evaluate the four IR models by horizontally comparing the overall performance of the four models on their optimal thresholds with the overall performance of the search engine, based on the same set of queries. Finding optimal thresholds Table 3 presents the testing results of the ECBR model. It is observed that along with the increase of the threshold, the precision experiences a sharp rise. Mean average precision tests the quickness and precision of a search. Here, the mean average precision keeps in a higher level that ranges from 70.97% to 91.15%. In contrast, recall ranges from 75.26% to 36.62%. Fallout is the champion of variation, which reduces to nearly 1/800. Harmonic mean experiences a curvilinear change, in which the peak is 51.04% at the threshold 0.55 and 0.6. Similarly, E-measure undergoes a waved variation, its peak reaching 52.85% at the thresholds 0.25 and 0.3 (the value at 0.4 is a bit less than it is at 0.25/0.3 although they look the same). Table 3
Testing results of the ECBR model.
Threshold
Precision
Mean average precision Recall
Fallout
E-Measure Harmonic mean(β=2)
>0 >0.05 >0.1 >0.15 >0.2 >0.25 >0.3 >0.35 >0.4 >0.45 >0.5 >0.55 >0.6 >0.65
12.38% 12.38% 12.38% 14.86% 17.21% 24.75% 24.75% 28.15% 28.01% 27.95% 27.95% 66.46% 66.46% 66.51%
70.97% 70.97% 70.97% 70.97% 71.22% 71.82% 71.82% 74.91% 78.18% 78.39% 78.39% 90.65% 90.65% 90.79%
12.74% 12.74% 12.74% 11.85% 9.28% 5.77% 5.77% 3.95% 3.88% 3.88% 3.88% 0.48% 0.48% 0.48%
21.27% 21.27% 21.27% 24.83% 27.97% 37.07% 37.07% 39.77% 39.29% 39.19% 39.19% 51.04% 51.04% 50.80%
75.26% 75.26% 75.26% 75.25% 74.59% 73.80% 73.80% 67.71% 65.80% 65.55% 65.55% 41.43% 41.43% 41.09%
37.34% 37.34% 37.34% 41.52% 44.75% 52.85% 52.85% 52.85% 51.81% 51.65% 51.65% 44.80% 44.80% 44.49%
19
>0.7 >0.75 >0.8
74.41% 79.43% 79.43%
91.15% 90.65% 90.65%
37.46% 36.62% 36.62%
0.23% 0.16% 0.16%
49.83% 50.13% 50.13%
41.59% 41.05% 41.05%
Table 4 illustrates testing results of the VSM. Its precision basically experiences a consistent rise, and the only exception occurs when the threshold is 0.7. The mean average precision also maintains a similar trend, apart from some undulations when the threshold is over 0.6, but it rebounds when the threshold is over 0.75. Unsurprisingly, both of the recall and fallout experiences fall almost linearly, dropping from 67.31% to 8.19% and from 6.68% to 0.01% respectively. The highest harmonic mean (46.23%) and E-measure (49.60%) are obtained when the threshold is 0.4 and 0.25 respectively. Table 4
Testing results of the VSM.
Threshold
Precision
Mean average precision Recall
Fallout
Harmonic mean
E-Measure (β=2)
>0 >0.05 >0.1 >0.15 >0.2 >0.25 >0.3 >0.35 >0.4 >0.45 >0.5 >0.55 >0.6 >0.65 >0.7 >0.75 >0.8
21.43% 21.81% 23.26% 25.57% 28.93% 34.67% 40.19% 44.38% 51.45% 60.03% 68.55% 72.52% 79.75% 79.25% 76.96% 85.63% 87.93%
69.38% 70.28% 70.65% 72.66% 73.93% 75.17% 76.78% 79.69% 81.83% 84.01% 86.99% 88.13% 87.95% 83.81% 79.25% 86.05% 87.93%
6.08% 5.57% 4.82% 3.99% 3.12% 2.40% 1.66% 1.19% 0.82% 0.52% 0.34% 0.22% 0.14% 0.09% 0.07% 0.03% 0.01%
32.51% 32.78% 34.22% 36.10% 38.67% 42.71% 44.56% 44.93% 46.23% 45.97% 44.59% 41.74% 39.75% 31.73% 22.83% 20.31% 14.98%
47.13% 46.93% 47.72% 47.93% 48.46% 49.60% 47.67% 45.27% 43.58% 40.31% 36.86% 33.27% 30.56% 23.34% 16.06% 13.93% 10.00%
67.31% 65.89% 64.74% 61.34% 58.29% 55.59% 49.99% 45.50% 41.98% 37.25% 33.04% 29.30% 26.48% 19.84% 13.40% 11.52% 8.19%
Table 5 shows the testing results of the LSI model. The precision and mean average precision undergoes durative increase (from 4.09% to 76.90% and from 59.34% to 87.24% respectively), in contrast to the durative fall for the recall and fallout (From 81.76% to 23.98% and from 46.11% to 0.13% respectively). The peak of harmonic mean (44.27%) and E-measure (50.37%) appear when the threshold is 0.55 and 0.25 respectively. Table 5
Testing results of the LSI model.
Threshold
Precision
Mean average precision Recall
Fallout
E-Measure Harmonic mean (β=2)
>0 >0.05 >0.1 >0.15 >0.2 >0.25 >0.3 >0.35 >0.4 >0.45 >0.5 >0.55 >0.6 >0.65 >0.7
4.09% 13.50% 20.23% 24.52% 27.17% 30.85% 32.12% 34.95% 37.01% 39.59% 42.38% 46.36% 51.60% 52.85% 60.80%
59.34% 64.26% 65.93% 67.48% 69.89% 72.88% 74.04% 75.77% 77.57% 79.99% 82.09% 82.23% 83.25% 83.45% 85.11%
46.11% 10.01% 6.02% 4.51% 3.64% 2.97% 2.46% 2.00% 1.64% 1.32% 1.06% 0.83% 0.63% 0.50% 0.37%
7.79% 22.79% 31.39% 35.91% 38.02% 40.71% 40.99% 42.37% 42.72% 43.21% 43.18% 44.27% 43.92% 41.40% 41.54%
81.76% 73.12% 70.09% 67.08% 63.30% 59.83% 56.61% 53.79% 50.50% 47.55% 44.00% 42.37% 38.22% 34.03% 31.55%
17.03% 38.82% 46.95% 49.79% 50.00% 50.37% 49.12% 48.56% 47.07% 45.71% 43.67% 43.11% 40.31% 36.64% 34.91%
>0.75 >0.8
66.83% 76.90%
85.17% 87.24%
27.27% 23.98%
0.24% 0.13%
38.74% 36.56%
30.94% 27.80%
Table 6 gives the testing results of the BIR model. The precision maintains a rising trend until the threshold reaches 0.45, and then starts fluctuating and gradually declines with the final value of 53.92%. This phenomenon also appears in the mean average precision, which rises to 77.44% at the threshold of 0.3 and starts wavering and gradually decreasing with the final value of 57.82%. The recall and fallout consistently decrease when the threshold rises. The highest value for the harmonic mean and E-measure is 44.21% and 48.30, respectively at the thresholds of 0.1 and 0.05. Table 6
Testing results of the BIR model.
Threshold Precision
Mean average precision Recall
Fallout
Harmonic mean
E-Measure (β=2)
>0 >0.05 >0.1 >0.15 >0.2 >0.25 >0.3 >0.35 >0.4 >0.45 >0.5 >0.55 >0.6 >0.65 >0.7 >0.75 >0.8
64.63% 68.15% 71.80% 69.92% 71.10% 73.24% 77.44% 73.56% 75.05% 73.71% 70.74% 71.04% 73.74% 68.64% 61.10% 64.15% 57.82%
5.64% 3.32% 1.72% 0.97% 0.63% 0.40% 0.28% 0.18% 0.12% 0.08% 0.06% 0.05% 0.04% 0.04% 0.04% 0.03% 0.03%
33.15% 38.73% 44.21% 40.21% 36.49% 32.67% 29.45% 23.65% 20.75% 18.09% 16.67% 12.62% 12.37% 11.65% 8.14% 8.16% 6.50%
47.22% 48.30% 46.43% 38.07% 31.45% 26.22% 22.40% 17.24% 14.79% 12.46% 11.39% 8.43% 8.24% 7.78% 5.37% 5.37% 4.25%
22.15% 29.11% 40.96% 44.37% 49.76% 55.35% 61.97% 62.35% 63.39% 73.33% 73.28% 73.21% 75.62% 67.33% 57.94% 60.83% 53.92%
65.86% 57.83% 48.03% 36.76% 28.80% 23.17% 19.32% 14.59% 12.41% 10.32% 9.40% 6.90% 6.74% 6.38% 4.38% 4.38% 3.46%
Horizontal comparison between the four IR models and the Australia Yellowpages® search engine In the first task, we find the optimal threshold for each model based on the harmonic mean. In this section, we then compare the overall performance of these models at these optimal thresholds with the overall performance of the Australian Yellowpages® search engine based on the same set of queries. Table 7 presents the selected testing results of the four IR models and the testing results of the Australian Yellowpages® search engine. We horizontally compare the performance of these models and the search engine from the perspective of the following five indicators: Precision. ECBR>VSM>LSI>BIR>Yellowpages®. Undoubtedly ECBR models stands in a solid position, which is nearly 15% higher than the second. All of the four models proposed are about 35 times higher than the Yellowpages® in this point. Mean average precision. ECBR>LSI>VSM>BIR> Yellowpages®. ECBR reveals its advantage again, which is 8.42% higher than the second. BIR is the last among the four models with an 18.85% gap with the leader. Similarly, all of the four models are about 3-5 times higher than the Yellowpages® in this point. Recall. BIR>LSI>VSM>ECBR>Yellowpages®. BIR shows the advantages on this indicator, which is 8.42% higher than the second. The other three models are relatively close, and are at least 16% higher than the Yellowpages®. Fallout. ECBR>VSM>LSI>BIR. Three layers can be distinguished in the results – ECBR are nearly twice as good as the VSM and LSI that are also nearly twice as good as BIR. Because there are a huge number of non-relevant concepts in the Yellowpages®, we cannot calculate the exact fallout for it.
21
Harmonic mean. ECBR>VSM>LSI>BIR>Yellowpages®. ECBR leads with nearly a 3.81% advantage and the other three models are close. All of the four models are more than 25% higher than the Yellowpages®. Table 7 Selected testing results of the four IR models at optimal thersholds for harmonic mean and the testing results of the Australian Yellowpages® search engine.
ECBR VSM LSI BIR Yellowpages®
Optimal threshold
Precision
Mean average precision Recall
Fallout
Harmonic mean
>0.55/0.6 >0.4 >0.55 >0.1 N/A
66.46% 51.45% 46.36% 40.96% 14.63%
90.65% 81.83% 82.23% 71.80% 17.85%
0.48% 0.82% 0.83% 1.72% N/A
51.04% 46.23% 44.27% 44.21% 18.46%
41.43% 41.98% 42.37% 48.03% 25.00%
By means of this comparison, it can be deduced that the performance of the four models are far better than is the Australian Yellowpages® search engine on the five indicators, which proves the validity of the service search framework and the mathematical models employed. Moreover, of the four models, the ECBR performs outstandingly, leading in four of the five indicators. Precision and mean average precision are the measurements of search accuracy and quickness. Here, the ECBR shows overwhelming advantage compared with the other models. Another advantage of ECBR is shown on the indicator of fallout rate, which reveals a low error rate. Compared with the other indicators, the performance of ECBR is worse on the recall. It is noted that the other three models also perform poorly on this indicator. One reason behind this is that the ECBR’s relatively higher threshold (highest among the four models) restricts its performance, in contrast to the ECBR’s recall performs well in the lower threshold values. Another reason is that we choose the threshold based on the value of harmonic mean, which is a mathematical average between precision and recall. In other words, the best harmonic mean value chooses the most balanced precision and recall, and thus sacrifices the performance of recall. To overcome the shortage of the harmonic mean-based threshold selection, we conduct another selection based on the E-measure (β=2). As mentioned earlier, E-measure weights recall twice as much as precision. This is closer to the fact that most search engines more concern recall than precision, as a result of the user’s purpose in obtaining information [46]. Table 8 shows the selected testing results of the four IR models at optimal thresholds and the testing results of the Australian Yellowpages® search engine for E-measure (β=2). It also can be observed that there is a huge gap between the four models and the search engine. Here, the ECBR shows advantage in Recall (nearly 14% more than the other models), and ECBR still leads the Emeasure figures. Table 8 Selected testing results of the four IR models at optimal thersholds and the testing results of the Australian Yellowpages® search engine for E-measure (β=2).
ECBR VSM LSI BIR Yellowpages®
Optimal threshold
Precision
Mean average precision Recall
Fallout
E-Measure (β=2)
>0.25/0.3 >0.25 >0.25 >0.05 N/A
24.75% 34.67% 30.85% 29.11% 14.63%
71.82% 75.17% 72.88% 68.15% 17.85%
5.77% 2.40% 2.97% 3.32% N/A
52.85% 49.60% 50.37% 48.30% 21.90%
73.80% 55.59% 59.83% 57.83% 25.00%
By means of the two comparisons, we can find the obvious progress of the service search enhanced by the four IR models, compared with the traditional search engine. In addition, among the four models, ECBR seems to be more applicable to the ontology concept search environment, which shows one-up advantages in both of the comparisons. 10
Conclusion
Services in the DEST environment has the speciality of diversity and heterogeneity, resulting in SMEs’ requirement in service registry, semantic-supported service clustering, and trustworthy and reliable service search. However, the survey of the current service platforms reveals that current technologies cannot fulfill this requirement. To solve this problem, we present a conceptual
framework of a human-centered semantic service platform incorporating the function of service metadata registry, maintenance, classification, evaluation and ranking. The framework consists of five modules – a user-driven service metadata publishing/updating module, a user-driven ontology evolution module, a user-centered service metadata clustering module, a user-centered service search module and a user-driven service evaluation and ranking module. The first three modules are designed for the purpose of assisting service providers to publish, update and cluster service metadata as well as update ontology-represented domain knowledge. The last two modules are designed for service requesters to retrieve, evaluate and rank services. First of all, to realize the function of the first module, we design a unified OWL-based service metadata format. Next, we design a hybrid service ontology concept-metadata matching model in order to realize the function of the second module. This model combines an ontology concept-metadata matching model and a service provider-oriented ontology concept-metadata matching model. In the first model, we define the ontology concept as a tuple of ontology name, annotation property values and data-type property values, in order to implement an ECBR model to compute the similarity values between concepts and metadata. By means of the ECBR model, the service metadata can be automatically clustered by service ontologies. In the second model, we deploy the notion of social classification to cluster metadata based on service providers, which enhances the precision of the first model. The third module in the framework is realized by a voting-based ontology evolution system. This evolution system employs the notion of web 2.0 to construct a service community between service providers and service requesters. Any intentions of changes in the ontology base are voted on by the service community, in order to keep the feasibility of the ontologies in the community. The fourth module incorporates a user-driven service search model and a SPARQL-based service search model. The first model concerns the service requesters who cannot formally denote their own query intentions or the service requesters who know noting about a service metadata. By means of the notion of HCC, we adopt a user-driven query expansion model based on ontology structure, to assist users to denote a service concept and eventually find the required service metadata. The second model allows users to directly retrieve a service metadata by means of SPARQL. For the last module, we design a service evaluation model based on the theory of CCCI metrics, in order to allow service requesters to evaluate the QoS after service transactions, and to rank service metadata-based QoS. In order to evaluate the framework of the human-centered semantic service platform, we utilize the approach of functional testing, by implementing a prototype – CSSSE. The testing shows that all the proposed functions in the framework are realized. Following that, we implement several experiments to evaluate the performance of ECBR in ontology concept-metadata matching and the performance of the four IR models for service search. For the second evaluation, we choose six performance indicators from the traditional IR field. Furthermore, we try to find the optimal threshold for each IR model based on harmonic mean. On the basis of the optimal thresholds, we horizontally compare the performance of the four models with a traditional search engine – the Australian Yellowpages® search engine, on the six indicators. By this comparison, we find the advancement of our service search model and find that ECBR stands in the leading position. Based on the defect of the harmonic mean-based threshold selection, we execute another threshold selection based on E-measure (β=2) that is closer to the fact that most search engines are more concerned with recall than precision. We implement another comparison based on the newly selected threshold, and find that ECBR is still outstanding among the four models. As a result, we validate the technical progress of the service search model and find an appropriate mathematical model through this experiment. Subsequent to the issues emerging from the experiment, our future work will focus on the enhancement of the ECBR model, in order to gain better performance in ontology conceptmetadata matching and service search. In addition, we will attempt to apply our human-centered semantic service platform to other service domains, in order to validate our framework. Acknowledgement We would like to express our appreciation to our web designer – Wei Liu who is responsible for the system implementation and evaluation. We also would like to express our gratitude to any anonymous reviewers of our manuscript for their valuable suggestions to improve this paper. References 1. 2.
Moore, J.F.: Predators and prey: a new ecology of competition. Harvard Business Review 71 (1993) 7586 Nachira, F., Nicolai, A., Dini, P., Louarn, M.L., Leon, L.R.: Digital Business Ecosystems. European Commission Information Society and Media (2007)
23
3. 4. 5. 6. 7. 8. 9. 10. 11. 12. 13. 14. 15. 16. 17. 18. 19. 20. 21. 22. 23. 24. 25. 26. 27. 28. 29. 30. 31. 32. 33. 34. 35.
Chang, E., Quaddus, M., Ramaseshan, R.: The vision of DEBI Institute: digital ecosystems and business intelligence: Digital Ecosystem and Business Intelligence Institute. DEBII, Perth (2006) Chang, E., West, M.: Digital Ecosystem - A next generation of the collaborative environment. iiWAS2006, Yogyakarta (2006) Jaimes, A., Sebe, N., Gatica-Perez, D.: Human-centered computing: A multimedia perspective. MM'06, Santa Barbara (2006) Hoffman, R.: Human-centered computing principles for advanced decision architectures. Army Research Laboratory (2004) Bogers, T., Thoonen, W., Bosch, A.v.d.: Expertise classification: Collaborative classification vs. automatic extraction. In: Furner, J., Tennis, J.T. (eds.): the 17th ASIS&T SIG/CR Classification Research Workshop, Vol. 17, Austin (2006) Gendarmi, D., Lanubile, F.: Community-driven ontology evolution based on folksonomies. In: R. Meersman, Z.T., P. Herrero et al. (ed.): On the Move to Meaningful Internet Systems 2006: OTM 2006 Workshops. Springer-Verlag, Berlin(2006) 181-188 Conradi, R., Fernström, C., Fuggetta, A.: Concepts for evolving software processes. In: Finkelstein, A., J. Kramer, Nuseibeh, B.A. (eds.): Software Process Modeling and Technology. Research Studies Press, Chichester (1994) Cugola, G., Nitto, E.D., Fuggetta, A., Ghezzi, C., : A framework for formalizing inconsistencies and deviations in human-centered systems. ACM Trans on Softw Eng Methodol 5 (1996) 191-230 Berners-Lee, T., Hendler, J., Lassila, O.: The semantic web. Scientific American Magazine. Scientific American, Inc., NY (2001) Mukherjee, S., Ramakrishnan, I.V.: Automated semantic analysis of schematic data. World Wide Web 11 (2008) 427-464 Martin, D.L., Burstein, M.H., McDermott, D.V., A., S., McIlraith, Paolucci, M., Sycara, K.P., McGuinness, D.L., Sirin, E., Srinivasan, N.: Bringing semantics to web services with OWL-S. World Wide Web 10 (2007) 243-277 Bianchini, D., Antonellis, V.D., Melchiori, M.: Flexible semantic-based service matchmaking and discovery. World Wide Web 11 (2008) 227-251 Liu, D.R., Shen, M., L, C.T.: Designing a composite e-service platform with recommendation function. Comput Stand Interfaces 25 (2003) 103-117 IBM: WebSphere application server, http:// www-01.ibm.com/software/webservers/appserv/was/. Karp, A.H.: Lessons from E-speak. HP Laboratories, Palo Alto (2004), http://www.usenix.org/events/worlds04/tech/full_papers/karp/karp.pdf. Cibrán, M.A., Verheecke, B., Vanderperren, W., Suvée, D., Jonckers, V.: Aspect-oriented programming for dynamic web service selection, integration and management World Wide Web 10 (2007) 211-242 Saha, D., Sahu, S., Shaikh, A.: A Service Platform for OnLine Games. NetGames 2003. ACM, Redwood City (2003) 108-112 Shaikh, A., Sahu, S., Rosu, M., Shea, M., Saha, D.: Implementation of a Service Platform for Online Games. SIGCOMM’04. ACM, Portland (2004) 106-110 Chen, Y.-F., Huang, H., Jana, R., Jim, T., Hiltunen, M., John, S., Jora, S., Muthumanickam, R., Wei, B.: iMobile EE: an enterprise mobile service platform. Wirele Netw 9 (2003) 283-297 Grieco, R., Malandrino, D., Scarano, V.: A scalable cluster-based infrastructure for edge-computing services. World Wide Web 9 (2006) 317-341 Barrett, R., Maglio, P.P.: Intermediaries: new places for producing and manipulating web content. Comput. Netw. ISDN Syst. 30 (1998) 509-518 Barrett, R., Maglio, P.P.: Intermediaries: an approach to manipulating information streams. IBM Syst. J. 38 (1999) 629–641 Patel-Schneider, P., Horrocks, I.: Mapping to RDF graph for OWL: W3C (2006), http://www.w3.org/TR/owl-semantics/mapping.html. Ning, X., Jin, H., Wu, H.: RSS: A framework enabling ranked search on the semantic web. Inf Process Manage 44 (2007) 893-909 Hayes, P.: RDF semantics W3C (2004), http://www.w3.org/TR/rdf-mt/. W3C: OWL web ontology language overview (2004), http:// www.w3.org/TR/owl-features/. Dong, H., Hussain, F.K., Chang, E.: A semantic crawler based on an extended CBR algorithm. In: Meersman, R., Tari, Z., Herrero, P. (eds.): On the Move to Meaningful Internet Systems: OTM 2008 Workshops, Vol. 5333. Springer-Verlag, Berlin (2008) 1084-1093 Dong, H., Hussain, F.K., Chang, E.: A transport service ontology-based focused crawler. SKG 2008. IEEE, Beijing (2008) 48-55 Mathes, A.: Folksonomies: Cooperative classification and communication through shared metadata. University of Illinois Urbana-Champaign, Champaign (2004) O'Reilly, T.: What is Web 2.0? : O'Reilly (2005), http://oreilly.com/web2/archive/what-is-web-20.html. Chang, E., Dillon, T.S., Hussain, F.: Trust and Reputation for Service Oriented EnvironmentsTechnologies for Building Business Intelligence and Consumer Confidence. John Wiley & Sons (2005) Chang, E., Hussain, F.K., Dillon, T.S.: CCCI Metrics for the measurement of quality of e-service. the 2005 IEEE/WIC/ACM International Conference on Intelligent Agent Technology (IAT’05). IEEE CS, France (2005) Hussain, F.K., Chang, E., Dillon, T.S.: Trustworthiness and CCCI metrics in P2P communication. Int J of Comput Syst Sci Eng 19 (2004) 173-190
36. Dong, H., Hussain, F.K., Chang, E.: Quality of service (QoS) based service retrieval engine. In: Gabriele Kotsis, D.T., Eric Pardede, Ismail Khalil (ed.): The 6th International Conference on Advances in Mobile Computing and Multimedia (MoMM 2008). ACM, Linz (2008) 405-408 37. Hevner, A.R., March, S.T., Park, J., Ram, S.: Design science in information systems research. MIS Quarterly 28 (2004) 75-105 38. Salton, G.: The SMART Retrieval System - Experiments in Automatic Document Processing. Prince Hall Inc., Englewood Cliffs (1971) 39. Salton, G., Lesk, M.E.: Computer evaluation of indexing and text processing. J ACM 15 (1968) 8-36 40. Furnas, G.W., Deerwester, S., Dumais, S.T., Landauer, T.K., Harshman, R.A., Streeter, L.A., Lochbaum, K.E.: Information retrieval using a singular decomposition model of latent semantic structure. 11th ACM SIGIR Conference on Research and Development in Information Retrieval (1988) 465-480 41. Robertson, S.E., Jones, K.S.: Relevance weighting for search terms. J Am Soc Inf Sci 27 (1976) 129-146 42. Dong, H., Hussain, F.K., Chang, E.: Transport service ontology and its application in the field of semantic search. 2008 IEEE International Conference on Service Operations and Logistics, and Informatics (SOLI 2008). IEEE, Beijing (2008) 820-824 43. Baeza-Yates, R., Ribeiro-Neto, B.: Modern Information Retrieval. Addison-Wesley, New York (1999) 44. Shaw, W.M.J., Burgin, R., Howell, P.: Performance standards and evaluations in IR test collections: Cluster-based retrieval models. Info Process Manage 33 (1997) 1-14 45. Rijsbergan, C.J.v.: Informaiton Retrieval. Butterworths (1979) 46. Su, L.T.: The relevance of recall and precision in user evaluation. J Am Soc Inf Sci 45 (1999) 207-217
25