Please cite this paper as: Davydenko, A., & Fildes, R. (2012). A joint Bayesian forecasting model of judgment and observed data (LUMS Working Paper 2012:4). Lancaster University: The Department of Management Science.
Lancaster University Management School Working Paper 2012:4
A Joint Bayesian Forecasting Model of Judgment and Observed Data Andrey Davydenko and Robert Fildes The Department of Management Science Lancaster University Management School Lancaster LA1 4YX UK
© Andrey Davydenko and Robert Fildes All rights reserved. Short sections of text, not to exceed two paragraphs, may be quoted without explicit permission, provided that full acknowledgment is given. The LUMS Working Papers series can be accessed at http://www.lums.lancs.ac.uk/publications LUMS home page: http://www.lums.lancs.ac.uk
A Joint Bayesian Forecasting Model of Judgment and Observed Data Davydenko A., Fildes R.
[email protected]
Lancaster University Centre for Forecasting Department of Management Science LA1 4YX, UK
October 25, 2012
Abstract This paper presents a new approach that aims to incorporate prior judgmental forecasts into a statistical forecasting model. The result is a set of forecasts that are consistent with both the judgment and latest observations. The approach is based on constructing a model with a combined dataset where the expert forecasts and the historical data are described by means of corresponding regression equations. Model estimation is done using numeric Bayesian analysis. Semiparametric methods are used to ensure finding adequate forecasts without any prior knowledge of the specific type of the trend function. The expert forecasts can be provided as estimates of future time series values or as estimates of total or average values over any particular time intervals. Empirical analysis has shown that the approach is operable in practical settings. Compared to standard methods of combining, the approach is more flexible and in empirical comparisons proves to be more accurate.
Keywords: combined forecasting, integration of judgmental and statistical methods, Bayesian methods, MCMC estimation.
1
Contents 1.
Introduction .............................................................................................................................. 3
2.
Building a Model Based on a Combined Set of Data .................................................. 5 2.1.
General Model Formulation ....................................................................................... 5
2.2.
Possible Specifications of Model Components ................................................... 6
3.
Bayesian Inference and MCMC Estimation ................................................................... 8
4.
Understanding Model Sensitivity and Comparative Performance: Simulation
Examples ...........................................................................................................................................12 5.
Empirical Example ...............................................................................................................25
6.
Conclusions .............................................................................................................................29
References ............................................................................................................................................31 Appendix A. Pseudo-code for the MCMC Sampling Procedure ........................................34
2
1. Introduction Combining forecasts has proved a fertile area of research both theoretically and empirically. From the earliest work often ascribed to (Bates and Granger, 1969) through the influential survey article of (Clemen, 1989) to the most recent work of (Wallis, 2011) the results have almost invariably shown that combining forecasts leads to improved accuracy. Nowadays combining forecasts is apparently common in practice (Fildes and Goodwin, 2007). In this paper we consider a situation when forecasts are provided by experts at irregular or infrequent points of time and then must be updated as new data becomes available and, possibly, prorated into shorter-range forecasts. The frequency of updating short-term or medium-term forecasts needed for decision-making can be much higher than the frequency of obtaining new estimates from experts. Moreover, quite often prior expectations are given by experts in an aggregate form (for example, most probable total or average yearly values), while it is important for practical purposes to produce timely shorter-range forecasts as well. For example, product managers usually provide their estimates of total sales of a product corresponding to certain stages of its lifecycle. For the purposes of operations management this information must then be converted into weekly or daily predictions, which are recalculated in the light of new sales data. Similar problems are also common in financial forecasting when long-range forecasts are issued by analysts several times per year; however, continuous updating is required for obtaining shortterm forecasts to support trading decisions. In cases such as those mentioned above, well-known time series models based on analysing past data cannot ensure the desired quality of forecasts. Not taking into account important information available from experts leads to the risk of extrapolating irrelevant historical patterns and the inability to handle the likely impact of forthcoming ‘events’. It is also often the case that the amount of available historical data is insufficient to find estimates with reasonable confidence intervals. The need for the integration of management judgment and statistical methods in order to improve forecasts has been emphasised in many publications (for example, (Collopy and Armstrong, 1992; Goodwin, 2002; Goodwin, 2005) among many others). Practical evidence suggests that forecasting based on historical data alone can result in considerable losses to companies (Worthen, 2003). A widely used approach to compensate for the imperfections of purely extrapolative methods is making judgmental adjustments to statistical forecasts. However, this approach assumes producing statistical forecasts that are then revised by experts for each period of interest. Thus, frequent updating of short-term forecasts using this approach may require excessive human
3
participation and therefore may be impractical and inefficient. Moreover, finding an adequate statistical forecast for using it as a baseline for making judgmental adjustment is intractable in case of insufficient historical data or long-range horizons. An additional problem is that special events such as promotions can distort extrapolations of the trend obtained by statistical methods. Therefore experts may need to perform data cleansing or special correction of historical data and this task is not always straightforward. The same reasons limit the application of methods for combining independent judgmental and statistical forecasts. An alternative way to combining forecast information lies in using expert information as an input to statistical modelling. One known approach here is based on Bayesian modelling where experts provide prior probability density functions (PDFs) for model parameters (Zellner, 1971; West and Harrison, 1997; Yelland, 2004). Though (Yelland, 2004) demonstrates examples of successful implementation in the context of sales forecasting over the product lifecycle, the approach relies on the model’s parameters easily interpretable meaning. Usually experts are not competent in providing prior PDFs for model parameters, and therefore such methods are difficult to adopt in practice. Another approach to integrate judgmental and statistical methods is rule-based forecasting (RBF) proposed by (Collopy and Armstrong, 1992). The idea of this approach is to use a system of rules that helps select and weight extrapolation techniques. However, extrapolative techniques can give unacceptably high level of uncertainty about future time series values in cases of insufficient data or more than several horizons-ahead forecasts. Moreover, the rules system itself is subjective and does not allow for calibrating the use of expert knowledge against the data. Perhaps as a consequence, RBF has not found its way into operational planning (Kusters, McCullough, and Bell, 2006). A further restriction on the existing methods of combining information is that no convenient mathematical models exist for prorating of aggregate expert forecasts (Kusters, McCullough, and Bell, 2006). Thus, most planners are restricted to using automatic extrapolation procedures that cannot take into account the causal effects known to experts. In summary, current methods of combining judgmental information with historical observations are often inflexible and are unable to provide useful prediction intervals. This paper presents an approach that allows the effective incorporation of prior expert information (covering a wide range of disparate forms) into a statistical forecasting model. In particular, the following features are taken into account: (i) the expert information can be provided in a form of estimates of future time series values or as estimates of functions of future time series values representing aggregation in time (such as expected total or average values), over products, or over locations; also, forecasts can be provided by several experts;
4
(ii) generally, the underlying data generation process can have complex features such as stochastic trends, non-linear dependencies, seasonal effects, non-negative domain, etc.; (iii) no prior knowledge of the specific type of the trend function is available; (iv) observations history can be limited and contain missing values, outliers or censored observations (for example, in the case of out-of-stock items). The proposed approach is based on constructing a model with a combined data set where available actual values and expert forecasts are described by means of corresponding regression equations. This allows the incorporation of judgmental information in order to derive the prior characteristics of the data generation process. Consistent forecasts are obtained with the use of Bayesian inference as characteristics of posterior probability density function for future time series values in accordance with a given loss function. The model we propose has two major benefits over existing approaches: it can incorporate judgmental information that is available in a wide variety of forms, and second, it can produce prediction intervals. Looking ahead, we see that when comparisons can be made with existing approaches, its accuracy is at worst comparable. This paper is in five further sections. Section two describes this new model for combining observations with judgmental forecasts. The model’s estimation is explained in section three while its sensitivity to the key assumption of judgmental error variance and its performance in a simulation exercise is explored in section four. Section five discusses an empirical example of applying the joint model in practical settings. Section six contains our conclusions as to the model’s advantages compared to combining forecasts.
2. Building a Model Based on a Combined Set of Data 2.1.
General Model Formulation
Let the history of observed values (
until the present time
if no history is present). The future unknown time series values starting from
some period
will be denoted as
be known until
. Suppose both past and future time
series values can be adequately represented by a set of regression equations: (
)
5
(1)
– regression function,
where
– vector of regression parameters,
– vector of non-stochastic
explanatory variables relating to period that are known at time ,
– lag order,
– noise
term represented by some known stochastic process that can possibly have some unknown parameters. If
then
for
can be modelled as additional unknown
parameters. Alongside the statistical data, it is assumed that a number of expert forecasts are available, which relate to , and these are denoted as
. These forecasts are estimates of
values of some known functions of the past and future time series elements:
(2) – a function whose value is estimated by experts,
where forecast
,
– error corresponding to expert
– number of judgmental forecasts. For example, if forecast
where
, then
for a period between
. If
is an estimate of
,
is an expected total value (i.e., cumulative forecast)
and
∑
then
, etc. If, for example,
two cumulative judgmental forecasts were available for the next two seasons each having disaggregated periods then
∑
and
will be assumed that the distribution of expert errors
,
∑
. Further it
and the parameters of this distribution can
be estimated based on available data. One way to model the features of expert errors is to regress previous forecasts on known outcomes. Thus, equations (2) represent an additional set of observations
that are related to the
future yet unobserved time series values . The use of these additional observations allows us to build a model based on a combined set of data that includes both the observed time series elements and the expert forecasts . Ultimately, the forecasting task becomes that of finding estimates of the future time series values in accordance with some specified loss function. A general scheme of estimating based on Bayesian inference using hierarchical priors will be given in Section 3.
2.2.
Possible Specifications of Model Components
The choice of regression function and exact specification of error models for
and
in
model (1)-(2) depend on the nature of the process being forecast and on the features of expert errors. Various plausible specifications are possible, the requirement being that they should be
6
robust and flexible enough to accommodate both the historical data pattern and the expert forecasts. One approach that is widely used for modelling economic time series is to assume that time series elements are generated by a random walk with drift process:
where
– independent random fluctuation,
– unknown drift parameter required to reflect the
presence of an expected upward or downward tendency. A more flexible approach that can be used to model processes with richer dynamics is to assume that the drift term gradually changes over time:
(3)
where
– some analytical function of time argument . A simple way to define
is to use a linear spline function, which is equivalent to using
a piecewise linear approximation. When using spline functions, it is required to (i) select the number of spline knots and (ii) decide where they should be placed. It is known that generally the placement of knots has much less impact on the quality of fit compared to the number of knots (Stone, 1986). Therefore a standard practice is to use uniformly distributed knots. It is possible to start with a constant drift and if visual analysis shows that the fit is too rough, knots can be added. Our aim here is to select a minimal number of knots that would ensure a satisfactory representation of both expert opinion and available actual outcomes. Apart from the visual method, another method to select the number of knots is based on a backward elimination procedure (Smith, 1982). The procedure starts with a large number of equidistant knots (so that there are about four or five data points per one knot). Then the number of knots is reduced by one at a time until all the regression coefficients for the remaining knots become statistically significant. With regard to model (1)-(2), this method can be implemented based on assessing the posterior PDFs for the regression coefficients after estimating the combined model. Obtaining the posterior densities using the MCMC algorithm will be described in the next section. Various alternative approaches such as trigonometric approximation, penalised splines, Hermite splines, wavelets, Akima interpolation, and others are also available. But our experiments show that the linear splines with equidistant knots are usually sufficient to capture time series behavior in cases of gradual changes. Since we use splines to model the first difference of a time
7
series, the resulting process becomes a sum of a stochastic trend and a quadratic spline function, which in many situations is a sufficiently flexible model. The noise term
in equations (1) can be represented by a Gaussian distribution with an
unknown variance. However, in order to ensure greater robustness of the model, a heavy tailed distribution can be chosen instead, such as a Student’s t-distribution with the degrees of freedom parameter taken as 5 or so (Venables and Ripley, 1998). If
takes only non-negative values, which, for instance, is common for demand
forecasting, the conditional PDFs for
can be specified using a left-truncated Gaussian
distribution. The use of this distribution is especially useful when modelling demand levels as it often provides a better representation of the actual demand patterns compared to the untruncated Gaussian distribution (Johnson and Thomopoulos, 2002). The expert errors
in equations (2) are modelled using a Gaussian or t-distribution with
variances provided by experts or found based on previous forecasts unless there is enough empirical data to deduce another form of the distribution. The estimation algorithm outlined below allows a choice from a wide variety of possible distributions to represent the errors of expert forecasts.
3. Bayesian Inference and MCMC Estimation One benefit of the Bayesian approach is that it allows for the use of complex models with a hierarchical structure of parameter dependencies (Geweke, 2005). The combined model represented by equations (1) and (2) has a hierarchical structure where
depends on , and
depends on other unknown parameters of the model. A general scheme of applying Bayesian methodology to find forecasts based on the combined model (1)-(2) is as follows. Let the time series model represented by equations (1) have the following parameters: (i) the parameters of the regression function (previously defined as ), (ii) the parameters of the stochastic process that generates the random component
,
and (iii) any additional variables that are used to fully specify the model (such as starting values of
when they are not yet observed).
Let all the unknown parameters of model (1) be denoted as . In accordance with the Bayesian approach, these parameters are treated as random variables. It will be assumed that the prior distributions for elements of
are taken as non-informative. The choice of priors when
implementing numerical integration methods will be described below. Let the available values of
8
the explanatory variables
〈
used in equations (1) be denoted as
〉. Apart from
, the combined model (1)-(2) also includes the vector of unknown future time series elements as a random variable. The optimal forecast is found based on the marginal posterior PDF for future unknown time series values . This PDF is defined as |
where
∫
– the existence domain for
|
|
and
(4)
– the full joint posterior PDF for model
parameters. ̂ , where ̂ – point forecast of , is specified, the
Assuming a loss function
optimal point forecast is found based on the marginal posterior PDF by minimising the expected loss: |
̂
∫
̂
(5)
̂
For a quadratic loss function, the optimal forecast is found as the mean of the marginal |
posterior PDF (Zellner, 1971): ̂
. Quantiles of the marginal posterior PDF can be
used as interval predictions. The diffuseness of this PDF may help assess whether any additional judgmental participation is needed. |
A general expression for the full joint posterior PDF hierarchical structure of priors. Specifically, the joint posterior PDF
is obtained using a |
that is obtained
based on the data set described by equations (1) is used as a joint prior PDF when finding estimates based on equations (2). In accordance with this approach, |
where
|
|
|
denotes proportionality, |
derived based on equations (2),
|
– the likelihood function for
– the joint posterior PDF for
and
given
and .
This posterior PDF is found as |
where |
|
|
– the conditional PDF for
– the posterior PDF for
given
|
given , , and
and
9
derived based on equations (1),
calculated from the prior PDF for .
An exact analytic solution for evaluating the marginal posterior PDF for
is usually not
available. A widely used approach for dealing with such problems is to implement numerical integration based on MCMC methods (Geweke, 2005). The purpose of MCMC methods is to sample values of unknown quantities from a distribution that eventually converges to the full posterior PDF. Empirical summary statistics are then used in order to draw inferences about the quantities of interest. Applying MCMC methods requires a model to be specified by means of a sequence of conditional PDFs. For the model under consideration, this sequence should include the conditional PDFs corresponding to time series elements
|
conditional PDFs corresponding to expert forecasts ( | model parameters
where
the )
and the prior PDF for
are the elements of . In order to implement
MCMC sampling, independent proper non-informative prior PDFs with sufficiently large variances are usually chosen according to the following widely accepted rules (Congdon, 2001): the inverted Gamma PDF in case of strictly positive parameters (such as variances) and the Gaussian PDF for parameters with
as the domain.
Specifying a time series model by means of a sequence of conditional PDFs is common in Bayesian forecasting (Geweke, 2005). For simple linear autoregressive processes, obtaining corresponding models in terms of conditional PDFs presents no difficulties. Moreover, it is possible to specify more complex models (such as a regression model with ARIMA errors) when includes not only parameters as usually conceived, but also latent variables convenient in model formulation. This extension immediately accommodates non-standard distributions and time varying parameters. Thus, for data points represented by equations (1), well-known models based on conditional PDFs can be used. The conditional PDFs corresponding to expert forecasts are obtained straightforwardly based on equations (2). The flexibility of Bayesian numeric analysis allows treating cases such as missing or censored variables in time series history with well-known approaches when specifying conditional PDFs. E.g., if an observation is censored from below then it can be modelled as an additional model parameter that has a left-truncated conditional PDF as suggested by (Chib, 1992). In this paper we will not focus in these issues, but in general the methodology is capable of handling these situations. Once the model is fully specified, MCMC sampling is performed as follows. Let
denote all the stochastic quantities of the joint model: 〈
〉.
10
For each quantity parents of
in , let
denote all quantities from which
depends directly (the
). The conditional independence assumptions represented by the sequence of
conditional PDFs mean that the full joint distribution of all quantities
has the following
factorisation: ∏
|
(6)
For any quantity , let the remaining quantities be denoted as conditional distribution
|
is found as |
where
– all quantities from which
depend directly on parents of
. Based on (6), the full
|
∏
|
depends directly (the parents of ),
(the children of ),
– all quantities from which
– all quantities that depends directly (the
). Thus, having the sequence of conditional PDFs, obtaining the full conditional
distribution for each quantity presents no difficulties. The major principle of MCMC estimation is to successively generate samples from the full conditional PDF of each unknown quantity given all the other quantities. Under broad conditions this process eventually provides samples from the joint posterior PDF of the unknown quantities. For the given model, by sampling each unknown from the marginal posterior PDF
|
in
successively, a sample drawn
is obtained. Based on this sample, the marginal
posterior PDF is then approximated and optimal forecasts are found based on expression (5). In general, a direct method for sampling a random number from the full conditional PDF is unavailable. In such cases updating of random quantities can be performed in accordance with the Metropolis-Hastings method (Geweke, 2005). A pseudo-code for the MCMC sampling procedure is given in Appendix A. At present a number of software packages are available that can be used to implement MCMC estimation when a model is represented as a collection of conditional PDFs. These packages implement algorithms that are capable of identifying relevant terms when finding the full conditional PDFs, multiplying them together, and choosing a most appropriate sampling method. One of these packages is WinBUGS (Lunn et al., 2000) and this has been used to implement the examples below.
11
4. Understanding Model Sensitivity and Comparative Performance: Simulation Examples This section contains illustrative examples that aim to (i) demonstrate a practical situation where the proposed approach can be applied and corresponding types of prior judgmental information that can be incorporated into statistical modelling; (ii) assess potential gains in forecasting accuracy that can be achieved through the use of the proposed approach and describe the conditions under which its application is most efficient; (iii) show the advantages of using prior judgmental information as an input to statistical modelling in comparison with conventional methods for combining forecasts. The examples below consider most simple settings where available information contains a history of observations together with a single judgmental forecast relating to an individual period of time in future. The examples illustrate the sensitivity to input parameters and show how the combined forecast that incorporates prior judgmental information can change as new data becomes available. In order to assess the effectiveness of joint modelling depending on the accuracy of judgmental forecast, a Monte-Carlo experiment is conducted. For this experiment, judgmental forecasts are generated using a pre-defined model. Due to space constraints, it is not possible to illustrate all the procedures set out above and this paper describes only major principles underlying the proposed methodology.
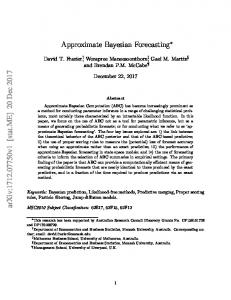
Examples Setup In order to illustrate the application of the joint model, we will use a time series of daily closing prices for Hewlett-Packard Company stock (Fig. 1). This time series was used by (Cowpertwait and Metcalfe, 2009) as an example of a financial time series that can be adequately described by means of a random walk (RW) with drift model. Here we shall assume the same model for the time series:
(7)
In a number of studies model (7) was found to be useful in predicting stock prices (see, e.g., Lo and MacKinlay, 2002). Thus, it was proven that stock prices are to a certain extent
12
predictable (which contradicts the weak-form ‘random walk’ hypothesis). Let us consider a situation where a history of daily observations containing six months (125 trading days) is available and it is needed to find forecast for forthcoming six months. Fig. 1 shows results of forecasting obtained using model (7). In these settings, point forecasts and corresponding prediction intervals (PIs) can be found using standard methods (see, e.g., Heij et al., 2004). From Fig. 1 it can be seen that the interval forecasts are quite diffuse and therefore statistical forecasting based on historical data alone leaves quite high uncertainty about the future time series values even when looking 25 to 50 days ahead.
Figure 1. Daily closing prices of Hewlett-Packard stock. Statistical forecasts based on model (7) and corresponding 95% PIs. At the same time, apart from historical data experts can possess additional information about long-term behavior of prices, such as potential profitability of a company over a given period. The frequency of obtaining expert forecasts in stock markets analysis is typically about one year or six months. In the stock market a projected price of stock produced by investment analysts is also known as a ‘target price’. In the examples below we assume that model (7) is valid, but an investment analyst reports a six-months-ahead estimate, , (or a six-month ‘target price’) alongside with the standard error of his/her estimate,
. Let the forecasting task be to find point and interval estimates of
future unknown time series values given both time series historical data and the additional
13
information provided by an expert. We also assume that it is needed to automatically update forecasts in the light of new observations.
Obtaining Forecasts using the Joint Model of the Judgmental Forecasts and the Time Series History We model the judgmental forecast subject to some error
as if forecaster knows the real future price value
which is not correlated with any other variable:
,
(8)
.
In reality this dependency may be different, but by regressing past actuals on corresponding forecasts an appropriate model can be constructed. The joint model of judgment and time series based on equations (7) and (8) is
{
(9)
Based on model (9), forecasts are found in accordance with the procedures described in Section 3. A point forecast for origin
and horizon
given all the available data: ̂
is obtained as a posterior mean for
|
. Corresponding prediction
intervals for each period of interest are found as quantiles of
|
.
Examples of Results and Sensitivity to Input Parameters
Fig. 2 shows forecast obtained using model (9) when
and
. The forecast
shown on Fig. 2 has narrower PIs compared to the pure statistical forecast found using a random walk with drift model (see Fig. 1). The length of the PIs obtained using model (9) depends on and, as
,
becomes smaller, the predicted accuracy of final forecast becomes higher. To illustrate
this effect, Fig. 3 shows forecasting results for
.
14
Figure 2. Results obtained using model (9) with
and
.
Figure 3. Results obtained using model (9) with
and
.
15
Fig. 4 illustrates that the forecast from the joint model gets closer to the target price as the judgmental forecast standard error,
, takes smaller values. As
goes to infinity, the
forecast from the joint model approaches the pure statistical forecast (that was shown on Fig. 1).
Figure 4. Sensitivity of forecast obtained using model (9) to the standard error of judgmental forecast,
.
Fig. 5 shows how forecasts are updated as new data becomes available (judgmental forecast is given as
and
). It can be seen that in comparison with the pure statistical
forecasting the joint model ensures narrower confidence bounds. Another advantage of the joint model is that it produces more stable estimates of the drift parameter. Fig. 5 may illustrate the following scenario. At origin 125 a six-month-ahead judgmental forecast is provided and the joint model forecast is found. Then at origins 150, 200, and 225 the joint model forecast is updated in the light of new data. The graphs shown for origins 150, 200, and 225 may also correspond to situations when judgmental forecaster makes a 100, 50, and 25 days-ahead forecast, respectively. As can be expected, the longer the data, the more the judgmental forecast is discounted. In case of long-range judgmental forecasts, the joint model corrects them to a lesser extent. This happens because in this case the judgmental forecast becomes the major source of information about the process being forecast.
16
Figure 5. Updating forecasts using on the random walk with drift model (left side) and with the joint model (right side). Model forecasts and 95% PIs are shown for different origins.
17
Generally, provided that modelling assumptions are correct, the gains in accuracy that the joint model gives in comparison with pure statistical forecasting (or with other alternative methods) can be assessed through the examination of the corresponding PIs. Of course, the quality of forecast depends not only on the accuracy of judgmental forecast provided, but also on the statistical model used to describe a time series. In our previous examples we used a random walk with a constant drift model (described by equation 7). We saw that, when and
, the joint model (9) gives forecast that differs from the initial judgmental
forecast (see Fig. 2). This might be either because the initial judgment is inaccurate and needs correction or because the time series model is not flexible enough to describe future changes. What if we use a more flexible time series model while using the same judgmental inputs? Fig. 6 presents the forecast from the joint model when we use a time-varying drift in the time series model instead of the constant drift. More specifically, we describe a drift as a linear function of the time argument:
where
and
.
Fig. 6 shows that using a more flexible model of time series resulted in final forecasts that are much closer to the initial judgment (in fact, the point forecast from the joint almost precisely corresponds to the initial judgmental forecast). But at the same time the PIs corresponding to the forecast from the joint model have become much wider (compare with Fig. 2) as a result of increasing the number of its parameters. However, the PIs from the joint model are still narrower than those obtained based on the pure judgment. In addition, the joint model has allowed the calculation of the intermediate forecasts and corresponding PIs (for points from 126 to 149) that would have been unavailable when using the judgmental forecast alone. The question of specifying an adequate time series model is highly important. Choosing an appropriate time series model can be done using the output of the Bayesian analysis based on the joint model. If posterior PDFs suggest that some parameter is not significant, it can be excluded from the model in order to avoid overparameterizaton. For the example shown on Fig. 6, the parameter
that was specified above is not significant (the 95% highest density region
contains zero) and therefore we can accept the simpler model (shown on Fig. 2) to be the more appropriate. But if a judgmental forecaster believes that the trend is better described by the more flexible time series model then it can be used instead. Then the joint model can be used to update forecast as new data becomes available. For example, Fig. 7 shows how the updated joint model forecast looks like at point 150 (when additional 25 observations have been collected after the initial judgmental forecast). As new data arrives, the updated forecast becomes based more on the data rather than on the initial judgment.
18
40
Closing price, $
35 30 25 20 15 10 0
50
100
150
200
250
Day
Figure 6. Forecasts form the joint model obtained using a time-varying drift time series model, origin 125.
40
Closing price, $
35 30 25 20 15 10 0
50
100
150
200
250
Day
Figure 7. Forecasts form the joint model obtained using a time-varying drift time series model, origin 150.
19
Evaluating the Effectiveness of the Joint Model Compared to the Combination of Forecasts
The established approach to incorporating judgmental forecast information with statistical forecasts is through combining of individual forecasts. The most popular method of combining individual forecasts is finding a weighted average of constituent forecasts proposed in (Bates and Granger, 1969) and this has proved hard to beat when compared to other methods of weighting the two sources of information (Wallis, 2011). When using this approach, the combined forecast is
(10)
where
– judgmental forecast,
– random walk with drift forecast,
– optimal weights
calculated depending on the features of errors of constituent forecasts. Formula (10) is more limited than the approach we have proposed and can be used only in situations when both judgmental and statistical forecast are available for a given period of interest. In the above settings this cannot always be done since judgmental forecast relates to only. And if, for instance, we needed to obtain a combined forecast of
, we would first need
to obtain a judgmental forecast for that period of time. Therefore one important advantage of the joint model is that forecasts can be found for any period of time. This becomes possible because in a single model the available judgmental information is used to improve estimates of parameters of time series model and therefore relates to all time periods. But even when it is possible to separately construct both statistical and judgmental forecasts for subsequent combining, the joint model will still often be preferable for the following reasons. As mentioned by (Bates and Granger, 1969, p. 451), there are two kinds of independent information that may be missing in one forecast, but present in the other: (i) one forecast is based on information that the other forecast has not considered or (ii) the forecasts make different assumptions about the form of the relationship between the variables. Our proposed model corresponds to the first case: both the judgmental forecast and the historical data model use the same assumptions about the relationship between model variables. We assume the judgmental forecaster provides some additional information that is not contained in historical data. Let us consider how using the joint model (9) differs from using the conventional forecast combining scheme (10) in this case. Assume that the available data including judgment and historical observations corresponds to model (9). Then using model (9) we can find the best possible point forecast in
20
terms of some given loss. For instance, the posterior expectation for forecast of
is the best possible
in terms of MSE. This forecast optimally uses both the judgmental information
and the historical data. At the same time, model (10) is only a simplification of model (9) because it does not take into account all the exact interdependencies between the judgmental forecast and the model parameters (that, in particular, include
and
). Since
is estimated
separately, some information about the model parameters contained in the judgmental forecast, , will be lost when obtaining the combined forecast,
, using equation (10). Therefore,
generally, equation (10) will produce forecasts that are not as accurate as those of model (9). Moreover, using model (10) we cannot refine our conclusions with regard to an updated estimate of the drift parameter, , (and hence, about the presence of a predictable trend) using the judgmental forecast because we still use the pure statistical method (namely, the RW with drift) to estimate the time series model. But if we use the joint model (9) instead, it can help us estimate the time series model parameters, in particular the crucial drift parameter, using both the judgment and the historical data and then validate the model using the posterior distributions. In particular, to test the significance of the drift term, one might use the quantiles of the posterior PDF for . Therefore the joint estimation gives us the advantages both of improved accuracy and in the ability to analyse the behavior of the model parameters in the presence of judgmental information. The advantages of the joint model of (1) and (2) can be illustrated using the following numerical example. It is known (see, e.g., Wallis, 2011) that if errors of constituent forecasts are identically independently distributed random variables then formula (10) produces forecasts with the following dispersion of errors:
– MSE of forecast , and
where If
– MSE of forecast
is based on model (7) then
can be estimated using standard methods (see,
e.g., Heij et al., 2004). As previously, we assume that Suppose we want to find a forecast for shown on Fig. 1). In this case
.
is provided by experts. based on historical data of 125 days (as
. Table 1 compares the dispersion of forecast errors
estimated based on formula (10) and the dispersion of forecast errors that correspond to the joint model for different error of the joint model,
values shown on Fig. 4 and
. The dispersion of the forecasting
, was calculated based on the procedures described in Section 3.
21
Table 1: Gains in Quality of Forecasts in Comparison with Optimal Linear Combination Standard error Statistical forecast (RW with drift)
Judgmental forecast
Optimal linear combination
Forecast form the joint model
Relative improvement in comparison with the optimal linear combination (
)
3
5.18
2.60
2.53
2.55 %
5
5.18
3.60
3.45
4.24 %
10
5.18
4.60
4.05
12.03 %
20
5.18
5.01
4.45
11.26 %
30
5.18
5.10
4.99
2.24 %
From Table 1 it can be seen that for the example given simultaneous estimation based on model (9) ensures higher quality of forecasts compared to combining independent forecasts using model (10). But an important qualitative advantage of the joint model is that it can be used to prorate aggregate judgmental forecasts, which is unattainable in case of combining forecasts. Moreover, sometimes it is difficult to find a statistical forecast needed for combining because of the lack of observations. When using the joint model, this does not cause difficulties.
Monte-Carlo Evaluation of Effectiveness The aim of this experiment is to empirically assess the extent to which the joint model can improve short- and medium-term statistical forecasts when a long-term judgmental forecast is available. In particular, we consider the following experimental setup: (i) a judgmental forecaster provides a six-month (125 days) target price with accuracy forecast is required (
) and must be updated each day as new actual observation
becomes available. Knowing of
, (ii) an -days-ahead
and the real value of
, we simulate
random realizations
in accordance with model (8). Based on a sufficiently large number of realizations, we
evaluate relative effectiveness of the joint model for various values of Assume
and
and .
are given. The evaluation procedure contains the following steps:
22
1) Evaluate the accuracy of the joint model (9): a. For each
in
i. generate judgmental forecast ii. for each origin
from
using model (8); to
, caluculate
-step-ahead
forecast based on the joint model (9); iii. obtain MAE and MSE values for the forecasts obtained, denote them as
and
, respectively.
b. Calculate mean MAE and mean MSE for the joint model: ̅̅̅̅̅̅̅
̅̅̅̅̅̅
∑
∑
2) Evaluate the accuracy of the random walk with drift model (7): a. For each origin
from
to
, calculate -step-ahead statistical
forecast based on the random walk with drift model. b. Calculate MAE and MSE values for the random walk with drift model, denote them as
and and ̅̅̅̅̅̅
, respectively.
3) Compare ̅̅̅̅̅̅̅
with
A sufficiently large
is chosen in order to ensure that ̅̅̅̅̅̅̅
with
estimates of the population mean with an acceptable standard error (
. and ̅̅̅̅̅̅
are
).
For instance, let us first assume that experts predict real values with accuracy
.
The results of this experiment are shown in Table 2. Analogously, relative MAEs and MSEs can be obtained for various values of
. Table 3 presents the results for relative MAEs. For relative
MSEs the results obtained were similar. From Table 3 it can be seen that the medium-term forecasts (
) can be markedly improved using the joint model (provided that judgments are
reasonably accurate). At the same time, several days ahead forecasts can still be obtained with acceptable accuracy using the random walk with drift model. Therefore, in this example, the joint model proved to be the most efficient when what is required is to update medium-term forecasts in the light of new data while taking into account the initial expert forecast.
23
Table 2: The Comparison of Accuracy of the Joint Model (
)
and the Random Walk with Drift Model Horizon, Mean MAE of the joint model, ̅̅̅̅̅̅̅
MAE of the RW with drift,
MAE ratio (the RW with drift is the benchmark)
Mean MSE of the joint model, ̅̅̅̅̅̅
MSE of the RW with drift,
MSE ratio (the RW with drift is the benchmark)
1
0.26
0.26
1.00
0.17
0.17
0.99
5
0.57
0.57
1.00
0.65
0.67
0.98
10
0.81
0.81
1.00
1.09
1.15
0.94
15
0.98
1.01
0.96
1.49
1.63
0.91
20
1.15
1.25
0.92
1.99
2.30
0.86
25
1.29
1.46
0.89
2.54
3.11
0.82
30
1.36
1.58
0.86
2.85
3.72
0.76
35
1.46
1.81
0.81
3.17
4.36
0.73
40
1.48
1.89
0.78
3.18
4.69
0.68
Table 3: MAE Ratios for Different Horizons and Different Dispersions of Judgmental Forecast Error
MAE ratio for different values of the dispersion of judgmental forecast error,
Horizon,
1 1
1.00
1.00
1.00
1.00
0.99
1.00
1.00
1.00
5
1.00
1.00
1.00
1.00
0.99
1.00
1.00
1.00
10
1.00
0.99
1.00
0.99
0.99
1.00
1.00
1.00
15
0.87
0.86
0.92
0.95
0.97
1.00
1.00
1.00
20
0.72
0.73
0.90
0.91
0.94
1.00
1.00
1.00
25
0.65
0.67
0.86
0.88
0.92
0.98
1.00
1.00
30
0.57
0.59
0.81
0.82
0.90
0.97
0.99
1.00
35
0.51
0.53
0.76
0.78
0.88
0.95
0.97
0.99
40
0.50
0.49
0.74
0.76
0.87
0.95
0.97
0.98
24
5. Empirical Example This example demonstrates the use of the proposed approach in an application to Australian tourism demand data. Fig. 8 shows alternative forecasts for a time series containing seasonally adjusted monthly numbers of total short-term departures starting from January 2004 (data taken from Australian Bureau of Statistics website).
Figure 8. Tourism demand forecasts obtained using automatic forecasting methods (a,b) and the joint model (c). Conditional expectation estimates and 80% PIs are shown.
25
Fig. 8(a,b) shows the results of applying two popular automatic univariate forecasting algorithms, ARIMA and exponential smoothing. The two algorithms were implemented in accordance with (Hyndman and Khandakar, 2008) using the ‘forecast’ package (version 2.19) for the R system for statistical computing (R Development Core Team, 2007). The major idea behind these automatic forecasting algorithms is to select the model that minimises the AIC (Akaike information criterion) value amongst all possible alternative models. In all the models the error term is assumed to follow a normal distribution. In the case of the exponential smoothing approach, the best model is chosen from a collection of innovations state space models that underlie exponential smoothing methods. Suppose only first 27 points are available (from January 2004 till March 2006). On Fig. 8(a,b) it can be seen that the use of the automatic forecasting algorithms for this series cannot ensure adequate extrapolation, especially for long-range horizons. Amongst all possible ARIMA models, the best model chosen according to the AIC is ARIMA(0,1,0), which is equivalent to a random walk model. However, the rest of the data has a pronounced upward trend that could not be detected based on the prehistory available. Predictions yielded by the automatically chosen exponential smoothing model are even worse since the AIC-based automatic model selection algorithm detects a downward trend in the data. Thus, the use of algorithms for automatic extrapolation based purely on historical data has the risk of choosing a wrong model, especially when conditions are changing or available data is limited. Moreover, even when an adequate model is chosen, its PIs may be unreasonably wide since such model will describe a very general stochastic process. The approach we proposed in this paper can be used to incorporate available expert forecasts into a statistical predictive model and thereby to improve the quality of forecasts (Fig. 8(c)). Expert forecasts for this example were taken from a report issued by Tourism Research Australia (TRA) in April, 2006. Table 4 shows TRA forecasts along with examples of corresponding variances found based on forecasts with known outcomes. As a result of using both sets of data it becomes possible to narrow PIs and better approximate the process dynamics.
Table 4: Expert Forecasts of Tourism Demand Year
2006
2007
2008
Total departures (‘000 000) st.dev.
50.38 1.1
52.61 3.2
54.38 4.9
26
Fig. 8(c) presents forecasts found using the following model. Assume the historical data containing
time series values is available:
Table 4 be denoted as denoted as
,
,…,
. Let the expert forecasts given in
, and let the corresponding standard deviations of errors be . In this example
expert forecasts that represent estimates of
aggregated time series values are given. The future unknown time series values of interest will be denoted as
. The total number of time series values including past actual
observations and future unknown values is
. The joint model that links the existing
historical observations, expert forecasts, and future unknown time series values is
(11) ∑
(
)
{ where
– all time indexes relating to year , denotes a constant drift. The variance of
and the
drift parameter, , are treated as unknown model parameters with uninformative priors. Once the future unknown time series values,
,
, are estimated, the corresponding estimates
can be used as forecasts. We used a model with a constant drift since using more flexible models would contain insignificant parameters and therefore has the risk of overparameterisation. The unknown quantities of the model are given as {
known quantities of the model are given as each element of
{
}. The }. For
, the posterior marginal PDF can be obtained using the MCMC algorithm
described in Section 3. In order to calculate forecasts, one needs to obtain posterior marginal PDFs for future time series values,
|
,
. Point forecasts (that are optimal in terms of
a quadratic loss) are then found in the form of posterior means. Prediction intervals for each period of interest are found as quantiles of
|
.
Table 5 compares the accuracy of different alternative forecasting approaches: (i) naïve method, (ii) automatic ARIMA forecasting based on the implementation described in (Hyndman and Khandakar, 2008) with exhaustive search of models, and (iii) the joint model (specified as (11)). Table 5 shows the accuracy of rolling-origin forecasts that have been calculated for different horizons. Forecasts from the above methods have been calculated for each origin from April, 2006 till December, 2008. The results suggest that in the case of one-step-ahead forecasts the automatic ARIMA has outperformed both the naïve method and the joint model in terms of MAE. This may have happened due to the fact that the joint model does not take into account stationary autoregressive dependencies in differenced time series and therefore cannot process available data
27
as efficiently as the ARIMA model. However, for longer range horizons the joint model has outperformed the other methods. Thus, the advantages of the joint modelling become apparent when producing medium-range and long-range forecasts. Generally, of course, the gains in accuracy depend on the features of judgmental forecasts. That is, the gains are higher when judgmental forecasts are closer to the true dynamics of the process. However, it is also important that the variances of the judgmental estimates should be reasonable. Otherwise, the combined forecasts can be unjustifiably biased towards the estimates of the experts. Fig. 9 shows how the joint model forecast can change for alternative variances of expert forecasts.
(a)
departures '000 000
5,5 5 4,5 4 3,5 3 2,5 01.04
01.05
01.06
01.07
01.08
month
01.07
01.08
month
(b)
departures '000 000
5,5 5 4,5 4 3,5 3 2,5 01.04
01.05
01.06
Figure 9. Results of forecasting depending on the variance of expert forecasts: (a) the variance is twice larger than that shown in Table 4, (b) the variance is half that shown in Table 4. Expert estimates of the mean values are the same as in Table 4. Conditional expectation estimates and 80% PIs are shown.
28
Table 5: MAE and RelMAE of Out-of-sample Tourism Demand Forecasts Relating to Periods from April, 2006 till December, 2008 MAE Horizon (months)
RelMAE
Naïve forecast
Automatic ARIMA
Joint model (11)
Naïve forecast
Automatic ARIMA
Joint model (11)
1
0.100
0.092
0.099
1.00
0.92
0.99
5
0.159
0.160
0.129
1.00
1.01
0.81
10
0.310
0.322
0.177
1.00
1.04
0.57
15
0.476
0.489
0.226
1.00
1.03
0.47
6. Conclusions This paper has focused on the development of a new model and corresponding methods that aim to incorporate expert knowledge into a statistical prediction model. In contrast to the use of judgmental adjustments or combining independent forecasts this approach does not require calculating statistical forecasts based purely on historical data as a first step. Instead, it is assumed that expert knowledge and statistical data are used simultaneously when estimating unknown variables of a statistical forecasting model. Thus, this type of integration avoids the necessity of extrapolation based on scarce data and does not require excessive human participation. Also, forecasts for different horizons can be updated as new statistical data becomes available. An overview of existing methods has indicated that they often cannot be efficiently applied in practice because they require expert information to be provided in a way that does not correspond to the expertise of judgmental forecasters. The paper has considered more relevant problem definitions that assume that expert information is provided directly in a form of forecasts. These forecasts can relate either to single future elements or to their aggregated values. A general model has been described that is based on a combined data set consisting of historical data, values of possible explanatory variables, and expert information given in a form of forecasts. Appropriate model specifications have been suggested in order for the approach to be applicable in practical settings under flexible and realistic assumptions. The corresponding estimation techniques we have introduced are based on the use of the numerical Bayesian approach to estimating the conditional probability density function and its expectation. This enables using a wide variety of possible types of distributions and functional dependencies in order to achieve the
29
desired realism of models. The use of Bayesian inference also makes it possible to find exact estimates for small samples, to handle censored or missing observations, and to find interval predictions and optimal forecasts in terms of a specified loss function. The semi-parametric procedure suggested for model specification can be implemented in practice in a wide range of situations since it is based on quite general assumptions, does not require the knowledge of any specific parametrically specified trend function, and allows subjective information to be provided in a convenient way. The sensitivity of the approach has been explored showing the circumstances where it proves to be most effective. It has also been shown that in those situations where it can be compared directly with the approach of combining forecasts it proved more effective. The illustrative examples have shown that the quality of forecasts can be substantially improved as a result of applying the proposed modelling procedures. In particular, it has been possible to find more accurate forecasts, to obtain more useful prediction intervals, and to reduce the risk of extrapolating irrelevant patterns from historical data.
30
References Atchade, Y. F., & Rosenthal, J. S. (2005). On adaptive Markov chain Monte Carlo algorithm. Bernoulli, 11, 815-828. Bates, J. M., & Granger, C. W. J. (1969). The combination of forecasts. Journal of the Operational Research Society, 20(4), 451-468. Chib, S. (1992). Bayes inference in the Tobit censored regression model. Journal of Econometrics, 51, 79-99. Clemen, R. (1989). Combining forecasts: A review and annotated bibliography. International Journal of Forecasting, 5(4), 559-583. Collopy, F., & Armstrong, J.S. (1992). Rule-based forecasting: development and validation of an expert systems approach to combining time series extrapolations. Management Science, 38, 1394-41. Congdon, P. (2001). Bayesian statistical modelling. New York: Wiley. Cowpertwait, P.S.P., & Metcalfe A. (2009). Introductory time series with R. New York: Springer-Verlag. Fildes, R., & Goodwin, P. (2007). Against your better judgment? How organizations can improve their use of management judgment in forecasting. Interfaces, 37(6), 570-6. Flegal, J. M., Haran, M., & Jones, G. L. (2008). Markov chain Monte Carlo: Can we trust the third significant figure? Statistical Science, 23, 250-260. Gelman, A., & Rubin, D.B. (1992). Inference from iterative simulation using multiple sequences. Statistical Science, 7, 457-511. Geweke, J. (2005). Contemporary Bayesian econometrics and statistics. New York: Wiley. Goodwin, P. (2002). Integrating management judgment and statistical methods to improve short-term forecasts. Omega: International Journal of Management Science, 30, 12735. Goodwin, P. (2005). How to integrate management judgment with statistical forecasts. Foresight: The International Journal of Applied Forecasting, 1(1), 8-12.
31
Heij, C., de Boer, P., Franses, P.H., Kloek, T., & van Dijk, H.K. (2004). Econometric methods with applications in business and economics. Oxford, UK: Oxford University Press. Hyndman, R. J., & Khandakar, Y. (2008). Automatic time series forecasting: the forecast package for R. Journal of Statistical Software, 27(3). Johnson, A. C. & Thomopoulos, N. T. (2002). Use of the left-truncated normal distribution for improving achieved service levels, Proceedings of the 2002 Annual Meeting of the Decision Sciences Institute (pp. 2033-2041). Kass, R. E., Carlin, B. P., Gelman, A., & Neal, R. (1998). Markov chain Monte Carlo in practice: A roundtable discussion. The American Statistician, 52(2), 93-100. Kusters, U., Mccullough, B., & Bell, M. (2006). Forecasting software: Past, present and future. International Journal of Forecasting, 22(3), 599-615. Lo, A.W., & MacKinlay, A. C. (2002). A Non-Random Walk Down Wall Street. Princeton, N.J.: Princeton University Press. Lunn, D.J., Thomas, A., Best, N., & Spiegelhalter, D. (2000). WinBUGS - a Bayesian modelling framework: concepts, structure, and extensibility. Statistics and Computing, 10, 325-337. R Development Core Team (2007). R: A Language and Environment for Statistical Computing. Vienna, Austria: R Foundation for Statistical Computing. Smith, P. L. (1982). Curve fitting and modeling with splines using statistical variable selection techniques (Report NASA 166034). Langley Research Center, Hampton, VA. Stone, C. J. (1986). The dimensionality reduction principle for generalized additive models. Annals of Statistics, 14, 590-606. Venables, W. N., & Ripley, B. D. (1998). Modern applied statistics with S-PLUS (2nd ed.). New York: Springer. Wallis, K. (2011). Combining forecasts - forty years later. Applied Financial Economics, 21(12), 33-41. West, M., & Harrison, J. (1997). Bayesian forecasting and dynamic models. New York: Springer-Verlag.
32
Worthen, B. (2003, July 15). Future results not guaranteed. CIO Magazine, 16(19), 46. Yelland, P. M. (2004). A model of the product lifecycle for sales forecasting. (Technical Report TR-2004-127), Sun Microsystems Laboratories. Zellner, A. (1971). An introduction to Bayesian inference in econometrics. New York: Wiley.
33
Appendix A. Pseudo-code for the MCMC Sampling Procedure Notation Let 〈 where
〉
〈
〉
are the observed (historical) time series values till the present time ; are the unobserved time series values that we want to estimate; are the available judgmental forecasts; are the unknown parameters of model (1)-(2) (apart from
The total number of elements in
is
).
.
Given {
1. Observed variables:
};
,
2. Full specification of model (1)-(2) in the form of a set of the prior and conditional PDFs for the elements of : |
,
( |
)
that are found based on equations (1);
that are found based on equations (2);
that are the non-informative priors.
To Find Optimal (in terms of MSE) point forecasts of
and corresponding
Algorithm // STEP 1: initialize Markov chain for
do if
is an unobserved variable (i.e.,
) then
some arbitrary initial value belonging to the domain of for end if end for
34
;
PIs.
// STEP 2: generate random samples (see remarks below) for
do for
do if
) then
is an unobserved variable (i.e.,
if it is possible to draw a random number directly from |
|
{ }
|
∏
{ }
{ }
then
//use Gibbs sampling ( |
draw else
);
//use random-walk Metropolis sampling ; //see remarks below
draw draw
; {
if
then
( | (
) | else
} )
;
end if store
;
end if end for end for
// STEP 3: estimate posterior means and percentiles, output results for
do select ̂ find ̂
such that ̂
| and ̂
corresponds to
; ∑
as (
; //see remarks below
)th and ( )th sample percentiles based on
output { point forecast ̂ , prediction intervals ( ̂ ; ̂ ) }; end for
35
;
Remarks 1. The number of samples, , should be sufficient to ensure that (i) the Markov chain has converged to its equilibrium distribution, (ii) the precision of the posterior estimates is acceptable. The simplest way to monitor convergence is visual inspection via trace plots of chain values (Kass et al., 1998), but various well-known statistics such as the Gelman-Rubin diagnostic (Gelman and Rubin, 1992) can be used as well. Once the chain has converged to its stationary state, the most popular way to find a Monte Carlo standard error for the posterior estimates is via the batch means method (see, e.g., Flegal, Haran, and Jones, 2008). 2. When calculating the posterior estimates we must discard early iterations as they are too strongly influenced by starting values. Here we assume after a sufficient burn-in period containing iterations the chain approaches its stationary distribution. | (up to some proportionality constant) is the Markov blanket of that contains only ’s parents, its children, and its children’s other parents. Therefore the elements needed for the calculation is usually much smaller than .
3. The conditioning set needed to calculate
4. When using the Metropolis sampling, the choice of
should ensure the efficient acceptance rate (the fraction of candidate draws that are accepted) of somewhere between and . It is possible to use adaptive random walk procedures that adjust the standard deviation of the random walk in such way that the chain’s acceptance rate converges to the target acceptance rate (Atchade and Rosenthal, 2005).
36