PHIBSS: Unified Scaling Relations of Gas Depletion Time and Molecular Gas Fractions 1 L.J.Tacconi1, R.Genzel1,2,3, A. Saintonge4, F.Combes5, S.García-Burillo6, R.Neri7, A.Bolatto8, T.Contini9, N.M. Förster Schreiber1, S.Lilly10, D.Lutz1, S.Wuyts11, G.Accurso4, J.Boissier7, F.Boone9, N.Bouché9, F.Bournaud12, A.Burkert13,1, M.Carollo10, M. Cooper14, P.Cox15, C. Feruglio16, J.Freundlich5,17, R. Herrera-Camus1, S.Juneau12, M.Lippa1, T.Naab18, A. Renzini19, P.Salome5, A.Sternberg20 , K.Tadaki1, H. Übler1, F.Walter21, B. Weiner22 & A.Weiss23 1
Max-Planck-Institut für extraterrestrische Physik (MPE), Giessenbachstr., 85748 Garching, FRG (
[email protected],
[email protected] ) 2 Dept. of Physics, Le Conte Hall, University of California, 94720 Berkeley, USA 3 Dept. of Astronomy, Campbell Hall, University of California, Berkeley, CA 94720, USA 4 Department of Physics & Astronomy, University College London, Gower Place, London WC1E 6BT, UK 5 Observatoire de Paris, LERMA, College de France, CNRS, PSL Univ., Sorbonne Univ. UPMC, F-75014, Paris, France 6 Observatorio Astronómico Nacional-OAN, Observatorio de Madrid, Alfonso XII, 3, 28014 - Madrid, SP 7 IRAM, 300 Rue de la Piscine, 38406 St.Martin d’Heres, Grenoble, France 8 Dept. of Astronomy, University of Maryland, College Park, MD 20742-2421, USA 9 IRAP, Institut de Recherche en Astrophysique et Planètologie, CNRS, 14, avenue Edouard Belin, F-31400 Toulouse, France, and Université de Toulouse, UPS-OMP, Toulouse, France 10 Institute of Astronomy, Department of Physics, Eidgenössische Technische Hochschule, ETH Zürich, CH-8093, SW 11 Department of Physics, University of Bath, Claverton Down, Bath, BA2 7AY, United Kingdom 12 Service d'Astrophysique, DAPNIA, CEA/Saclay, F-91191 Gif-sur-Yvette Cedex, FR 13 Universitätssternwarte der Ludwig-Maximiliansuniversität, Scheinerstr. 1, D-81679 München, FRG 14 Department of Physics and Astronomy, Frederick Reines Hall, University of California, Irvine, CA 92697, USA 15 ALMA Santiago Central Office, Alonso de Córdova 3107, Vitacura, Santiago, CH 16 Scuola Normale Superiore di Pisa, IT 17 Racah Institute of Physics, The Hebrew University, Jerusalem 91904, Israel 18 Max-Planck-Institut für Astrophysik, Karl Schwarzschildstrasse 1, D-85748 Garching, FRG 19 Osservatorio Astronomico di Padova, Vicolo dell'Osservatorio 5, Padova, I-35122, IT 20 School of Physics and Astronomy, Tel Aviv University, Tel Aviv 69978, Israel 21 Max-Planck-Institut für Astronomie (MPIA), Königstuhl 17, 69117 Heidelberg, FRG 22 Steward Observatory, 933 North Cherry Avenue, University of Arizona, Tucson, AZ 85721-0065, USA 23 Max-Planck-Institut für Radioastronomie (MPIfR), Auf dem Hügel 69, 53121 Bonn, FRG
1
Based on observations of an IRAM Legacy Program carried out with the NOEMA , operated by the Institute for Radio Astronomy in the Millimetre Range (IRAM), which is funded by a partnership of INSU/CNRS (France), MPG (Germany) and IGN (Spain).
1
ABSTRACT We update and improve previous scaling relations between galaxy integrated molecular gas masses, stellar masses and star formation rates, in the framework of the star formation main-sequence (MS) as a function of redshift between z=0 and z=4. Our new results combine independent methods of determining molecular gas masses from CO line fluxes (from PHIBSS, xCOLD GASS and other surveys), far-infrared dust spectral energy distributions (from Herschel), and ~1mm dust photometry (from ALMA), in 758 individual detections and 670 stacks of star forming galaxies (SFGs), covering the stellar mass range log(M*/M)=9.0-11.8, and star formation rates relative to that on the MS, δMS=SFR/SFR(MS), from 10-1.3 to 102.2. We find that all data sets, despite the different techniques and analysis methods used, follow the same scaling trends, once method-tomethod zero point offsets are minimized and uncertainties are properly taken into account. The molecular gas depletion time, defined as the ratio of molecular gas mass to star formation rate, scales as (1+z)-0.57 (δMS)-0.44, and is only weakly dependent on stellar mass and galaxy rest-frame optical size. The ratio of molecular-to-stellar mass depends on (1+z)2.8 (δMS)0.54 (M*)-0.34, which tracks the evolution of the specific star formation rate. The new relations determine molecular gas masses and depletion time scales with an accuracy of ±0.1 dex or better for sample averages, and ±0.25 dex for individual galaxies, including systematic uncertainties.
Key words: galaxies: evolution — galaxies: high-redshift — galaxies: kinematics and dynamics — infrared: galaxies
2
1. Gas and Galaxy Evolution: Summary of Current State of Research Throughout the epoch from the peak of the cosmic galaxy/star formation activity ~ 10 Gyrs ago (z~2) to the present time the dominant fraction (90%) of the cosmic star formation activity and resulting galaxy growth occurs on a well-defined (dispersion ±0.3 dex), almost linear relation between stellar mass (M*) and star formation rate (SFR), the so called ‘star formation main sequence (MS)’ (e.g. Brinchmann et al. 2004, Schiminovich et al. 2007, Noeske et al. 2007, Daddi et al. 2007, Elbaz et al. 2007, 2011, Rodighiero et al. 2010, 2011, Peng et al. 2010, Whitaker et al. 2012, 2014, Renzini & Peng 2015, Speagle et al. 2014, Schreiber et al. 2015). The resulting dependence of the specific star formation rate on stellar mass, sSFR=SFR/M*, of MS-star forming galaxies (SFGs) varies only slowly with stellar mass (sSFR~M*-0.1..-0.4), but its zero point increases strongly with redshift, sSFR (1+z)3 to z~2, and (1+z)1.5 for z>2. Differences in the mass and redshift dependence of the MS relation are largely understood by different sample selections, survey completeness, and methodologies applied to derive M* and SFRs (Renzini & Peng 2015). We adopt in this study the prescription proposed in the recent compilation of Speagle et al. (2014), log( sSFR( MS , z, M * )) (0.16 0.026 t (Gyr )) (log M * ( M ) 0.025) (2.49 0.11 t (Gyr ))
(Gyr 1 ),
with log t (Gyr ) 1.143 1.026 log(1 z ) 0.599 log 2 (1 z ) +0.528 log 3 (1 z )
(1).
Here t (Gyr) is the cosmic time for a flat CDM Universe with Ωm=0.3 and H0=70 km/s/Mpc used throughout this paper, and all stellar masses and star formation rates assume a Chabrier (2003) initial stellar mass function. Compared to alternatives (e.g. Genzel et al. 2015 (hereafter G15, Renzini and Peng 2015), the Speagle et al. (2014) prescription has the advantage of being applicable over a wide range of redshift (z=0-5) and stellar mass (log(M*/M)=9.0-11.8), but is otherwise similar to the relations proposed by Whitaker et al. (2012, 2014), as seen in Figure 1 (and Table 3). The MS-evolution has been interpreted in terms of an ‘equilibrium-growth/gasregulator model’ (e.g. Bouché et al. 2010, Davé, Finlator & Oppenheimer 2011, 2012, 3
Lilly et al. 2013, Peng & Maiolino 2014, Dekel & Mandelker 2014, Rathaus & Sternberg 2016). High SFRs and galaxy growth along the main-sequence are sustained for several Gyr by a continuous supply of fresh gas from the cosmic web and through (mostly minor) mergers maintaining large reservoirs for star formation (e.g. Dekel, Sari & Ceverino 2009). At z~1-2.5 MS SFGs double their stellar mass on a typical time scale of ~0.5-1 Gyr but their growth appears to halt when they reach the Schechter mass, M* ~ 1010.5-11 M, and transition to the sequence of passive galaxies (Kauffmann et al. 2003, Conroy & Wechsler 2009, Peng et al. 2010). The equilibrium growth model predicts a close connection between specific star formation rates (sSFR), gas fractions, and metallicities as a function of redshift, with only modest changes as compared to z=0 MS-star formation physics (e.g. Elmegreen et al. 2009, Krumholz & Dekel 2010, Elbaz et al. 2010, 2011, Gracia-Carpio et al. 2011, Nordon et al. 2012, Lilly et al. 2013, Peng & Maiolino 2014). In the Milky Way and nearby galaxies most and arguably all star formation occurs in massive (104…6 M), dense (n(H2) ∼ 102…5 cm−3) and cold (Tgas ∼ 10–30 K), gravitationally bound ‘giant molecular clouds’ (GMCs; Solomon et al. 1987, Bolatto et al. 2008, McKee & Ostriker 2007), and not in warm atomic gas (Bigiel et al. 2008, Leroy et al. 2008, Schruba et al. 2011). An important open issue is whether the depletion time for converting molecular gas to stars on galactic scales is set locally, within clouds (Krumholz & McKee 2005) or on large, galactic scales (Elmegreen 1997, Silk 1997). Another is how gas reservoirs change as a function of cosmic epoch (redshift), stellar mass, star formation rate, galaxy size/internal structure, gas motions and environmental parameters (e.g. Daddi et al. 2010a, b, Tacconi et al. 2010, 2013, Genzel et al. 2010, 2015, Bouché et al. 2010, Lilly et al. 2013, Davé et al. 2011, 1012, Lagos et al. 2011, 2015a,b, Fu et al. 2012, Popping et al. 2015).
2. Scaling Relations for Molecular Gas The goal of this paper is to synthesize the wealth of data now available in the literature, relate these data to the basic galaxy parameters, and derive the most comprehensive 4
(molecular) gas scaling relations currently available as a function of these parameters. Our approach is to 1. select a representative and statistically significant ‘benchmark’ sub-sample of the overall parent SFG population, covering a wide range in basic galaxy parameters and with a well understood selection function from the parent SFG population, sampled by state of the art panchromatic imaging surveys; 2. include several tracers of molecular mass content; 3. establish fitting functions between the galaxy integrated molecular content and the key global galaxy parameters (stellar mass, star formation rate, redshift), and investigate whether galaxy internal properties (size, surface density) play a significant role. A completely ‘un-biased’ survey of gas properties for a determination of the multidimensional distribution function in (z, M*, δMS)-space is currently not realistic, at least at high-z, mainly because the required observing times would be excessive. Establishing scaling relations to 10% accuracy still may require several thousand galaxies if several independent methods are to be included. Fortunately, previous work already has indicated that parameter dependences to first order are not correlated and thus can be separated. G15 (and references therein) have demonstrated that the scaling relations depend primarily on redshift, stellar mass, and the galaxy’s location perpendicular to the MS, δMS = sSFR /sSFR(MS,z,M*)), and only indirectly on the absolute value of the SFR or sSFR. We cast the scaling relations in terms of the dependencies of the gas depletion time scale, tdepl = Mmolgas/SFR (Gyr), as a function of the above mentioned parameters, where Mmolgas is the total molecular gas mass, including a 36% mass fraction of helium and, in addition, a correction for the photo-dissociated surface layers of the molecular clouds that are fully molecular in H2 but ‘dark’ (i.e. dissociated) in CO (see below equation (2), Sternberg & Dalgarno 1995, Wolfire, Hollenbach & McKee 2010, Bolatto, Wolfire & Leroy 2013). Molecular gas to stellar mass ratios then follow straightforwardly by multiplying the depletion time with the specific star formation rate of a galaxy, μmolgas= Mmolgas/M*=tdepl(SFR/M*). Finally the fraction of total cold gas mass to total baryonic mass of a galaxy, the (baryonic) gas fraction, is fgas= (Mmolgas+MHI) /(M*+Mmolgas+MHI ). Here MHI is the 5
integrated atomic hydrogen mass of a galaxy. While MHI~3 Mmolgas in massive z=0 SFGs (e.g. Saintonge et al. 2011a and references therein), the atomic gas content of galaxies likely does not vary strongly with redshift (Bauermeister, Blitz & Ma 2010 and references therein), while the molecular component is strongly evolving with redshift (Daddi et al. 2010b, Tacconi et al. 2010, 2013, G15, Lagos et al. 2015a). For these reasons we make the approximation μgas~μmolgas and fgas~fmolgas, which is valid at z>0.4 (see below 4.4). 2.1 Determining Molecular Gas Masses: CO, Dust-SED and Dust-1mm Methods There are three main avenues to obtain molecular gas masses: 1. The most common and well established method is the observation of a low-lying CO emission line (CO 1-0, 2-1, 3-2), and using its integrated line luminosity LCO and a conversion factor (or function) αCO to convert LCO to molecular gas mass, in the regime where CO comes from optically thick, virialized clouds (e.g. Dickman, Snell & Schloerb 1986, Solomon et al. 1987, Bolatto et al. 2013); 2. More recently, high quality far-infrared/submillimeter dust emission spectral energy distributions (SED) have become available with the Herschel mission. From these dust masses are inferred by fitting dust emissivity models (e.g. Draine & Li 2007 (DL07)). Then molecular gas masses are estimated assuming a gas-to-dust mass ratio (which can be a function of metallicity, see below, e.g. Leroy et al. 2011, Rémy–Ruyer et al. 2014, Eales et al. 2012, Magdis et al. 2011, 2012a, Magnelli et al. 2012a, Santini et al. 2014, Sargent et al. 2014, Béthermin et al. 2015, Schreiber et al. 2015, Berta et al. 2013, 2016, G15). Detailed explanations of this method are given in the above papers, and especially in G15 and Berta et al. (2016); 3.
A single band measurement of the dust emission flux on the Rayleigh-Jeans side of the SED (at ~ 1mm) can be used to infer a dust/gas mass, if a single, constant dust temperature is a sufficiently good approximation. The long-wavelength dust emissivity can be estimated from a model, or calibrated from observations of sources in which gas masses are known from method 1 (e.g. Scoville et al. 2014, 2016).
All three methods have strengths and weaknesses (e.g. Bolatto et al. 2013, G15, Scoville et al. 2016, A. Weiss et al. in preparation). The ‘CO method’ is very well established and 6
calibrated from observations in the local Universe (Bolatto et al. 2013), but at high-z the CO 1-0 line typically has to be replaced by a higher energy state line, which requires a calibration of the temperature and density dependent ratio R1J=T1/TJ, where TJ is the beam averaged, Rayleigh-Jeans brightness temperature of the line J→J-1. Observations in lowand high-z SFGs suggest R12~1.16-1.3, R13~1.8 and R14~2.4 (e.g. Weiss et al. 2007, Dannerbauer et al. 2009, Bothwell et al. 2013, Bolatto et al. 2015, Daddi et al. 2015). With Herschel the FIR dust SED method (2) has been widely used for large samples between z=0 and 1, and for stacks at z=1-2.5. However, the FIR data covering the emission peak are luminosity weighted toward the warm, star forming dust component, and less sensitive to colder dust between star formation regions (Scoville et al. 2016, Carleton et al. 2017). This bias can lead to an underestimate of the ISM mass, especially at low-z, where only a fraction of the cold ISM is actively star forming. The effect will be less at high-z where the entire galaxy is globally unstable to star formation (Genzel et al. 2008, 2011, Elbaz et al. 2011). The Herschel-based references used in this study address this concern by fitting DL07 dust models that implement a distribution of dust temperatures. The rest wavelength coverage needed to constrain the colder dust has been studied by Draine et al. (2007), Magdis et al (2012a), and Berta et al. (2016). Analysis of the same or similar high redshift data sets can lead to significant differences (0.02 to 0.4 dex) in inferred dust masses, depending exactly on the assumptions and methodology (Santini et al. 2014, Béthermin et al. 2015, G15, Berta et al. 2016). We refer to these papers for a more detailed discussion of the dust SED modeling methods. Finally the ‘1mm’-method (3) is becoming increasingly popular as it is much more efficient than the CO method (factors ~5-10 in observing time at ALMA), but requires additional assumptions, such as a constant dust temperature for the emitting dust grains at 1mm (Tdust=25 K: see Scoville et al. 2016, Weiss et al. in preparation, for a full discussion). All three methods assume that zero-point calibrations established at z=0 can be transferred to higher redshifts without much change. Masses inferred from both CO and dust emission are sensitive to metallicity. In the case of CO, the conversion factor increases with decreasing metallicity Z, because CO is photo-dissociated to a larger depth in each cloud (Wolfire et al. 2010, Bolatto et al. 2013). Various metallicity dependent conversion functions have been proposed in the literature. As in G15,we adopt the geometric mean of 7
the αCO(Z) recipes of Bolatto et al. (2013) and Genzel et al. (2012) (equations 6 and 7 in G15)
CO J 4.36 RJ 1 0.67 exp(0.36 10 (12log(O / H )8.67) 101.27(12 log(O / H )8.67) (M / (K km/s pc 2 ))
(2).
Here logZ=12+log(O/H) is the metallicity on the Pettini & Pagel (2004) scale. Molecular gas masses are then computed from equation (4) in G15. In the case of the dust methods (2) and (3) we assume that the dust-to-gas ratio is nearly linearly correlated to the metallicity, at least for metallicities 12+log(O/H)>~8, as found in Leroy et al. (2011) and Rémy-Ruyer et al. (2014). We adopt the ratio of molecular gas to dust mass as
gd
M mo lg as M dust
10( 20.85(12log(O / H )8.67))
(3).
Note that we deviate here from the assumption δgd=const. in Scoville et al. (2016) but otherwise use their equation (16)2. For the few SFGs in this paper with estimates of gas phase metallicities from strong line rest-frame optical line ratios, we determine individual estimates of logZ=12 + log (O/H), adopting the Pettini and Pagel (2004) scale (e.g. Kewley & Ellison 2008 for a detailed discussion). However, for most of the SFGs in the CO and dust samples, such line ratios are not available and it is necessary, for the metallicity corrections discussed above, to refer to the mass-metallicity relation. Following G15 we adopt
12 log(O / H ) PP 04 a 0.087 (log M * b) 2 , with a=8.74(0.06), and b=10.4(0.05) + 4.46 (0.3) log(1+z) -1.78(0.4) (log(1+z))2
2
Note that the term RJ/0 in that equation has to be replaced by its inverse 8
(4).
2.2 Summary of Previous Results To set the scene, we summarize in Table 1 previous work on the molecular scaling relations, including several theoretical papers describing the results from hydrosimulations and semi-analytic work. There is broad qualitative agreement in the literature that the depletion time scale is about one Gyr, and dropping by a factor of 2 to 4 between z=0 and 2.5 (Bigiel et al. 2008, Leroy et al. 2013, Saintonge et al. 2011b, 2013, 2016, Tacconi et al. 2010, 2013, Daddi et al. 2010b, Santini et al. 2014, Sargent et al. 2014, Genzel et al. 2010, G15). There is also broad qualitative agreement that tdepl decreases as one steps upward in sSFR perpendicular to the MS line at a given z and M*, as long as one considers a large enough range in δMS (Saintonge et al. 2011b, 2012, Leroy et al. 2013, Tacconi et al., 2013, Huang & Kauffmann 2014, Sargent et al. 2014). Depletion times are constant or increase slowly as one steps along the MS-line, suggesting that gas fractions track the mass-dependence of sSFR (Saintonge et al. 2011b). At z~0 the depletion time may increase with stellar surface density, as the mass fraction of quenched bulges/spheroids increases (Saintonge et al. 2012, 2016). The theoretical work finds strong redshift evolution of increasing molecular (not atomic!) gas fractions with redshift, a decrease of depletion time scale (increase of efficiency) as one steps up in SFR, perpendicular to the MS (Lagos et al. 2012, 2015a, Genel et al. 2014, Popping et al. 2015). Despite this qualitative agreement, uncertainties are large enough and methodologies sufficiently different to result in ambiguous and sometimes contradictory conclusions. The different methodologies for computing star formation rates and stellar masses alone can lead to significant differences. At z=0, for instance, Bigiel et al. (2008) and Leroy et al. (2008, 2013) find tdepl(MS)~2-2.5 Gyrs vs. 1-1.5 Gyr in Saintonge et al. (2011b, 2012), emphasizing the importance of homogenized definitions and calibrations (benchmarking). At z=0, Bigiel et al. (2008, 2011) and Leroy et al. (2008, 2013) find a constant depletion time, with the exception of galactic nuclei, while Saintonge et al. (2011b, 2012) and Huang & Kauffmann (2014) emphasize that depletion time is correlated inversely with specific star formation rate, the difference perhaps caused by the narrower range of sSFRs covered in the Bigiel and Leroy papers. The derived values for the slope dlogtdepl/dlogδMS vary from -0.2 to -0.6 (Saintonge et al. 2012. 2013, Santini et al. 2014, Sargent et al. 2014, G15, 9
Scoville et al. 2016). Simulations and semi-analytic work continue to find significantly lower (1.5-2) star formation rates and gas fractions at high-z than implied by all observations (e.g. Davé et al. 2011, 2012, Lagos et al. 2015a, Genel et al. 2014). Another important example is the interpretation of the MS itself. A massive (M*~1011 M) galaxy on the mid-plane of the MS at z~2.3 has a star formation rate of ~200 Myr-1. The same star formation rate is reached at z=0 only for ULIRGs. The latter are rare starbursts triggered by major mergers, placing them well above the main sequence. This cannot be interpreted to mean that all z=2.3 MS SFGs are mergers, however. On the contrary, the advent of Herschel SEDs (see Elbaz et al. 2011, Nordon et al. 2012), and the firm establishment of the MS-picture discussed in Section 1 favor an explanation where the increase in SFRs on the MS in equation 1 just implies that normal star forming disk galaxies at high-z are more gas-rich. While the former (‘starburst’) interpretation had dominated earlier work, the more recent results now favor the ‘equilibrium scenario’ (see Elbaz et al. 2011, Nordon et al. 2012). Yet Santini et al. (2014) and Scoville et al. (2016) find only a moderate slope of μgas with z, suggesting the need for a more efficient star formation process at high-z, perhaps driven by the increased merger rates. But then G15 find that μgas changes rapidly with redshift, tracking sSFR(z) and favoring a single dominant star formation process on the MS at all redshifts between z=0 and 2.5. Daddi et al. (2010a,b), Genzel et al. (2010), Magdis et al. (2012a) and Sargent et al. (2014) all applied a Galactic CO conversion factor near the MS, but a much smaller one above the MS, motivated by observations of local ULIRGs (Downes & Solomon 1998). This resulted in the proposal that galactic star formation is ‘bi-modal’, with large depletion time scales (low efficiency) at δMS~1 and short depletion time scales (high efficiency) at δMS >>1, with a fairly sudden transition in between. G15 did not see much difference in the dependence of tdepl on δMS between CO and dust-based data, suggesting that strong αCO(δMS) changes are probably not justified, at least at high-z (see also Scoville et al. 2016). As we will show below, many of these differences are caused by output parameter estimation of often modest data sets across limited input variable ranges, in addition to the already mentioned systematic differences in calibrations of the input variables entering the analyses. By substantially increasing these variable ranges, the total number of data points and including different calibration methods, we expect significantly more robust results. 10
3. Data Sets Entering this Analysis The data used in this work comprise a total of 1428 measurements of molecular mass, spanning a wide redshift range z=0 to 4.4, over three orders of magnitude in stellar mass from log(M*/M)=9 to 11.9, and with star formation rates from 10-2 to 102 times those on the MS-reference line. During the analysis we then decided to eliminate 136 dust measurements at z=0.1-0.3 for analysis of the redshift dependence of μgas, since these are probably significantly affected by dust in atomic gas (see also sections 3.2 and 3.3), such that the dust and gas masses in this redshift range overestimate molecular masses. The final data set used in our global analysis of μgas thus has 1285 measurements. Of those, 657 come from CO line flux measurements, 512 come from dust masses inferred from stacking Herschel FIR spectra, and 123, of which 21 are stacks, from dust masses inferred from broadband 1mm photometry. Table 2 shows the key quantities used in the analysis for 7 CO and 7 dust data points. The full table will be available online at http://www.iram.fr/~phibss2/Home.html. In order not to bias the trends, we include >3 individual detections in single dish and interferometric spectroscopy, >4 for individual continuum detections and >4 for stacks, keeping in mind that values for individual galaxies at the lower confidence levels are very uncertain. For the individual detections of SFGs (δMS>0.1) the fraction of targets detected at 3, 4 and 5 varies in the various samples and measurement methods. For the xCOLD GASS surveys (Saintonge et al. 2011a,b, 2016, and in preparation) these fractions are 0.99, 0.93 and 0.86 for star forming galaxies. For the PHIBSS 1 and 2 surveys (Tacconi et al. 2013, Freundlich et al. in preparation, and PHIBSS2 team in preparation) the fractions are 0.92, 0.79 and 0.64, respectively. For the FIR-SED stacks the detection fraction usually is high, and mass errors are driven by SED modelling assumptions and methods (Berta et al. 2016). For the 1mm photometry samples (Scoville et al. 2016, DeCarli et al. 2016, Dunlop et al. 2016, Barro et al. 2016, Tadaki et al. 2016, Lilly, priv.comm.) the detection fractions are about 0.65, 0.53 and 0.4 for 3, 4 and 5 significance. For the stacks of Scoville et al. (2016) the detection fractions are 0.86 for 5. Detection rates below δMS0.2 from the CANDELS/3D-HST surveys (Grogin et al. 2011, Koekemoer et al. 2011, Brammer et al. 2012, Skelton et al. 2014, Momcheva et al. 2016). The individual CO data points are shown as circles (xCOLD GASS: open blue, PHIBSS1&2: filled blue, ULIRG and SMG starbursts: filled purple, and other CO surveys: open gray), and the dust data points are shown as squares (FIR/submm SED-based dust masses: red and dust-1mm photometry: crossed black).
14
3.3 Benchmarking Our basic tenet is that our core CO or dust observed data sets are “benchmark” subsamples of large panchromatic (UV/optical/infrared/radio) imaging surveys, preferably with spectroscopic redshifts, and with well-established and relatively homogeneous stellar and star formation properties. On redshifts we note that we had to eliminate some of the redshift z~4 data points of Scoville et al. (2016), since the grism redshifts from 3D HST did not agree with the photometric redshifts used in that paper. The COLD GASS and COLD GASS-LOW samples are drawn from the SDSS (Saintonge et al. 2011a, b). PHIBSS 1 & 2 and the Herschel and ALMA dust samples are selected from deep rest-frame UV/optical imaging surveys in EGS (Davis et al. 2007, Newman et al. 2013, Cooper et al. 2012), GOODS N/S (Giavalisco et al. 2004, Berta et al. 2010) and COSMOS (Scoville et al. 2007, Lilly et al. 2007, 2009), including the recent CANDELS J- and H-band HST imaging (Grogin et al. 2011, Koekemoer et al. 2011) and 3D-HST grism spectroscopy (Skelton et al. 2014, Momcheva et al. 2016), as well as Deep-3a (Kong et al. 2006) and the BX/BM samples of Steidel et al. (2004) and Adelberger et al. (2004). We have supplemented these core samples with smaller sets addressing outliers above the MS, mainly starburst sources (LIRGS, ULIRGs, submm-galaxies etc.) as described in sections 3.1 and 3.2. With these selections it is possible to place the basic galaxy parameters, stellar masses, star formation rates, effective radii in the rest-frame optical, on a common ‘ladder’ system (see Wuyts et al. 2011a,b and Saintonge et al. 2011a, 2016 for details), where SFRs are based on FIR emission, MIR emission, and UV to NIR SED fitting in decreasing preference. Wherever necessary and possible, we adjusted the stellar masses and SFRs from the literature to the same assumptions. Typical fractional stellar mass uncertainties (including systematic errors) are ±0.13 dex on the MS and ±0.2 dex for outliers, star formation rate uncertainties are ±0.2 dex for Herschel-Spitzer detected galaxies, and ±0.25 dex for SED-inferred SFRs, or starbursts, and gas mass uncertainties are ±0.23 dex (G15). Note that throughout the paper we define stellar mass as the “observed” mass (“live” stars plus remnants), after mass loss from stars. This is about 0.15…0.2 dex smaller than the integral of the SFR over time. The redshift-sSFR-M* coverage of the various samples is
15
shown in Figure 1, with the different symbols denoting the various surveys mentioned in our listing above. Overall this compilation gives the opportunity to compare three independent methods, all subject to different systematics. The best coverage naturally occurs at z=0 with the COLD GASS, COLD GASS-LOW and LIRG/ULIRG CO surveys, but unfortunately there are no equivalent surveys in the dust tracers, due to the strong contribution from dust in the atomic medium (e.g. Draine et al. 2007, Kennicutt et al. 2011, Dale et al. 2012, Eales et al. 2012, Sandstrom et al. 2013). In the mid-z range (z=0.5-2.5) we have the best comparison of the three independent methods, and in fact with several independent analysis methods of the SED technique. Owing to the sensitivity limits, the overall distribution in z-sSFR space at all z, and particularly at z>0.5 is biased to SFGs on and above the main sequence and at higher stellar masses. However, the more recent extensive surveys at the IRAM telescopes at z~0.03 (COLD GASS), z~0.7 (PHIBSS2), z~1.2 (PHIBSS1+2) and z=2.2 (PHIBSS1+2) now establish good coverage of massive SFGs above and below the mainsequence line. With the exception of COLD GASS-LOW (Saintonge et al. 2017, in preparation), none of the other samples reaches below M*1010M. This is in part again because of sensitivity limitations. More importantly this is also per design, as in this range the (line or continuum) luminosity per ISM mass decreases rapidly due to the metallicity dependence of αCO and δgd (section 2.1). Given these limitations, we discuss below in sections 4.2.3 and 4.4 what we can infer from COLD GASS-LOW for the stellar mass dependence of the scaling relations for M*1010M.
4. Results 4.1 Separation of variables: tdepl(z, δMS, δM*, δRe) In the framework of the MS-prescription (equation (1)) and following the analysis in G15 and other papers, our Ansatz is to separate the parameter dependencies of tdepl as products of power laws, first in redshift (1+z), next at a given redshift above and below the 16
MS at a fixed stellar mass, (δMS=sSFR/sSFR(MS,z,M*)), and then along the MS (δM*= M*/51010M). Finally we investigate the residuals as a function of effective radius (halflight radius in rest-frame optical (5000 Å) Re), relative to the average radius of the star forming population, Re0=8.9 kpc (1+z)-0.75(M*/5x1010M)0.23 (van der Wel 2014), such that δR=Re/Re0. This means that
log(tdepl ( z, sSFR, M * , Re ))= log A B log(1 z ) C log MS D log M * E log R
(5).
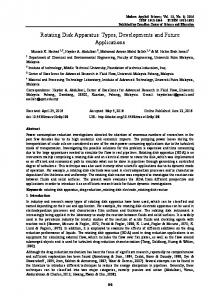
Separation of variables requires that the parameters C, D and E should not depend significantly on redshift. To start we show below in section 4.2.3 and 4.2.4 that D and E are close to zero and can be neglected to first order. To explore the redshift- dependence of C, we first split the independent data sets of each of the three methods (CO, dust-FIR, dust1mm photometry) into six redshift bins (z=0-0.1, 0.1-0.5, 0.5-0.9, 0.9-1.6, 1.6-2.5 and 2.54.4). In each of the redshift bins and separately for each of the three methods, we fit for A’=A+Blog(1+z) and C. In the literature there are three independent analyses of the FIR/submm dust-SEDs from Herschel (+Spitzer, ground-based: Berta et al. 2016 and G15 (using fluxes from Magnelli et al. 2014), Santini et al. 2014 and Béthermin et al. 2015), in which tdepl and μgas were determined in stacks, as a function of z, δMS and δM*. We analyzed each of these data sets separately. The right panel of Figure 2 summarizes the inferred slopes C. There is no overall significant trend of C(z). The distribution of individual values of C around the best fit, error-weighted average (-0.44) has a scatter of ±0.23 dex, somewhat larger than the median uncertainty of the individual data points (±0.15 dex). If data points of Béthermin et al. (2015) are not considered, that scatter decreases to ±0.16 dex, suggesting that the data can indeed be described mostly with scatter around a constant, redshift independent slope, in excellent agreement with the Separation Ansatz. The Cvalues inferred from the Magnelli et al. (2014) and Berta et al. (2016) points (with very similar input data) differ on average by ΔC~0.36 dex. This suggests that the scatter is significantly affected by systematics in the analyses.
17
y=0.085-0.61*x Santini dust FIR SED Berta-Magnelli dust FIR SED CO Bethermin dust FIR SED 1mm dust photometry dust 1mm Schinnerer
y=-0.44
1.0
0.5 dlogtdepl/dlog MS
log tdepl(MS)S14
raw
0.5 0 -0.5 -1.0
0
0.2
0.4
0 -0.5 -1.0 -1.5
0.6
log(1+z)
0
0.2
0.4
0.6
log (1+z)
Figure 2. Redshift dependence of MS molecular depletion time tdepl(MS) (left) and slope C=dlogtdepl/dlogδMS (right), when the ‘raw’ zero points of the original papers are used. Left panel: depletion time at the main-sequence reference line (δMS=1, for C= -0.44) in bins of z, as a function of log(1+z), for different methods (CO: blue circles, dust-FIR/submm SED: open red rectangles with horizontal bar (Magnelli et al. 2014, G15, Berta et al. 2016), filled green triangles (Béthermin et al. 2015), filled brown triangles (Santini et al. 2014), dust-1mm-photometry: black crossed squares (Scoville et al. 2014, 2016, DeCarli et al. 2016, Barro et al. 2016, Tadaki et al. 2016, Lilly et al. 2016, Dunlop et al. 2016) and filled cyan square (Schinnerer et al. 2016). The dotted grey line is the unweighted fit: A=0.085, B=-0.6. Right panel: slope C of depletion time in logtdepl-log(δMS) plane (equation (5)) as a function of log(1+z). Error bars are ±1 and the dotted grey line (C=-0.44) is the best fit global fit value for all data.
Once the scaling relations for tdepl are determined, it is in principle straightforward to determine the equivalent relations for molecular gas to stellar mass ration, μgas, from the combination of equations (1) and (5),
18
log(g as ( z, sSFR, M * , Re )) log( M mo lg as / M * ) log tdepl log( sSFR) sSFR = log tdepl log( sSFR( MS , z, M * )) log sSFR( MS , z, M * ) = A B log(1 z) F
C log MS
D log( M * ) E log R
(6).
Unfortunately, the slope of the MS-line (dsSFR(MS)/dlog(1+z)) in Speagle et al. (2014, and also in Whitaker et al. 2014, equation 1) varies quite strongly with redshift (from +3.6 at z~0-1 to +1.2 at z>2.2, at logM*~10.8) and mass. Separated power-law descriptions in z, δMS and δM*, based on the scaling relations obtained in equations 1 and 5, thus are not sufficient. To capture the slope variations we introduced two more parameters, F and β (=2), as shown in equation 6. Because of the slope-variations of sSFR(MS) in z, fitting of the data is quite sensitive to the range and distribution of data points (especially for the pure power-law case β=0 and F=0). For this reason we also fit the data by first binning in z-bins and then giving all z-bins equal weight for the determination of the parameters A, B, C, and F. 4.2 New Results for Depletion Time Scaling Relations In the following we use two approaches in parallel. First, to visualize specific trends in Figures (2-4), we use data averages/medians of typically 20-100 individual measurements, separately for each technique. Binning in this way elucidates possible deviations from the assumed basic power law parameterizations introduced in equations 5 and 6. Second, for quantitative fitting of the data, we employ multi-parameter linear regression fitting in 3-, 4- or 5-space of logarithmic variables (log(1+z),log2(1+z), logδMS, logδM*, logδRe) using all data points individually, weighted by the inverse square of their uncertainties. For the specific fitting of log(1+z) vs logtdepl or logμgas, we explored how the fits changed when we gave equal weight to each of the 6 redshift bins used in the fit. This turns out to be important for establishing the best overall log(1+z)-log μgas scaling relation (equation 6) in the presence of the non-linear fitting function (β=2). The equal bias for different z-bins 19
removes the otherwise strong weight of the many z=0 CO data points. The results of the fitting exercises are reported in Table 3, including a recommended, overall ‘best’ set of fit parameters (bold face). We determined the uncertainties in Table 3 by splitting the sample randomly into two halves, fitting the parameters, and then repeating the splitting and fitting to establish the range of uncertainties by bootstrapping. As a second check, we also did the fitting procedures after eliminating one or more of the smaller datasets (jackknifing), thus checking for systematics of the individual data sets.
4.2.1
Redshift dependence of depletion time scale
Inspection of the left panel of Figure 2 indicates that the redshift slopes of the depletion time at the MS-reference curve3, estimated from the different methods are very similar (B=dlogtdepl(MS)/dlog(1+z)~-0.6). The one exception are dust measurements in the lowest redshift range (z=0.1-0.4). Both the Santini et al. (2014) and G15/Berta et al. (2016) data indicate a fairly sharp upward trend of the depletion time scales with redshift at z1, as tends to be the case for z>0.5. Instead we determine the tdepl( δMS=1) value in each z-bin by fitting to all data in that bin a straight line with slope -0.44 in the logtdepl-logδMS plane and solve for the zero-point value A’(z).
20
y=-0.026+0.12*x
1
log (tdepl/tdepl(MS))
log ( tdepl/tdepl(MS)
y=-0.44*x
0
-1 -1
00
1
1
0
-1
2
logMS=0.6
-1.0 -1.0
-0.5
log MS with zero-point corrections
0.5
0 -0.5 -1.0 -1
00
0.2
0.4 0.4 log(1+z)
0.5
1.0 1.0
log(R)
log tdepl/tdepl(MS)
log tdepl(MS
1.0 1
00
0.6
1
0
-1 9
y=0.083 -0.55*x Schinnerer dust-1mm Scoville+ dust-1mm Bethermin dust-FIR Santini dust-FIR Berta-Magnelli dust-FIR CO
10
11 11
12 2
logM*
y=0.04 -0.19* (x-10.76) y=0.107*(x-10.7) no metallicity correction Bolatto Genzel Accurso
Figure 3. Dependence of molecular depletion time, tdepl=Mmolgas/SFR on z, sSFR, M* and Re, after zero-point corrections for the different methods to minimize scatter in tdepl(MS)(1+z) relation (bottom left: +0.02 dex for CO, -0.21 dex for Magnelli/Genzel/Berta, +0.07 dex for Béthermin, +0.21 dex for Santini, -0.02 dex for Scoville 1mm and -0.13 dex for Schinnerer 1mm). The corrections decrease the 1 scatter around the best fitting slope (unweighted: B=-0.55) from ±0.15 dex in the left panel of Figure 2 to ±0.066 dex. The green symbols mark the individual data points, and the large symbols the binned averages (same nomenclature as in Figure 2), all now zero-point adjusted. The dotted grey line is the global fit: A=0.08, B=-0.55 to -0.57. Top left: after removal of the redshift dependence this panel displays the dependence of the depletion time residuals perpendicular to the reference main-sequence line, for all data (green crosses) and for the different binned averages, as a function of log δMS, again with the same symbols as in Figure 2. The dotted grey line is the best fit global fit (C=-0.44). Bottom right: dependence of the depletion time residuals on the MS-reference line (δMS=1) along the main-sequence (= as a function of logM*), after removal of the best fit, redshift trend (A=0.08, B=-0.55, C=-0.44). The dotted grey line is the best global fit (D=0.09). Symbols are the same as in the other panels. The various continuous lines on the left indicate the data trends at low M*, if in the metallicity correction of αCO instead of equation (2), no (black), equation 31 of Bolatto et al. (2013, 21
magenta), equation 7 of G15 (see Genzel et al. 2012, cyan), or equation 24 of Accurso et al. (2016) are chosen. Top right panel: Depletion time scale residuals as a function of the rest-frame optical (HST WFC3 H-band) effective radius for a Sersic model, normalized by the average size of the star forming galaxy population at that redshift and stellar mass (van der Wel et al. 2014), after removing the redshift, sSFR and mass dependences (A=0.08, B=-0.55, C=-0.44, D=0.1). The dotted grey line is the best global fit (E=0.15). Symbols are the same as in the other panels. All dashed best fit lines come from a global, multiparameter fit with equation (5), weighted by the inverse squares of the uncertainty of each data point.
The resulting scaling of tdepl(MS) with redshift becomes very tight, independent of method, with a fairly shallow red-shift dependence, tdepl(MS)~(1+z)-0.57±0.07. The slope is 0.2 dex steeper than that found by G15, mainly due to the larger weight of the dust data in the current analysis.
4.2.2
Variations of depletion time scale above and below the MS
Next we remove the average redshift dependence and consider the residual variations of depletion time as a function of δMS in the left top panel of Figure 3. The data are well described with a single power law of slope -0.44 (±0.03), over a remarkably large range from log δMS=-1 to +2 around the MS, from the ‘green valley’ to the regime of extreme outlier starbursts. The data are accurate enough to look for empirical deviations from a single power law description by inspecting the binned averages in the top left panel of Figure 3. While there might be a tendency for a flattening of the relation between logδMS=0 to +1 in the CO data (more constant depletion time), and a steepening further out, these deviations are everywhere less than ±0.1dex. We conclude that a single power law (tdepl~(sSFR/sSFR(MS))-0.44±0.03 describes all data from the different methods. Magdis et al. (2012a) and Sargent et al. (2014) have proposed that there is a fairly sudden decrease of αCO by -0.5 to -0.7 dex between δMS=0 and +0.6, motivated by the findings of Downes & Solomon (1998) in local ULIRGs. Our analysis does not support the presence of such a large change in αCO, confirming the findings of G15, now with the dust-1mm technique added as another independent anchor in the argument (see also Scoville et al. 2016).
22
4.2.3
Mass dependence
In the third step we analyze the residuals of depletion time along the MS, as a function of stellar mass (Figure 3 bottom right panel), once both redshift and SFR-dependences are removed. Over the mass range covered by all three techniques (log(M*/M=10-11.6) the depletion time scale data do not depend significantly on mass, and the relation is flat within ±0.08 dex (2) in the slope. If the lower mass SFGs in the CO COLD GASS-LOW survey are added (Saintonge et al. 2017, in preparation, log(M*/M)=9-10.2), or more weight is given to the COLD GASS+COLD GASS-LOW survey as a whole, the slope increases slightly (D ~0.05 to 0.1), but the trend remains marginal. At face value the data are better described by a curved relation: log tdepl=0.04 -0.19(log(M*)-10.76)2. However, both the steepening of the relation and the potential curvature vary strongly on the metallicitydependence of αCO. To demonstrate this, we show four different recipes for that dependence in the bottom right panel of Figure 3, from no correction (strongest negative deviations), to the Accurso et al. (2016) conversion function, which almost flattens the relationship. It thus remains unclear whether these second order depletion time variations with mass are intrinsic, or whether they are indicative of αCO-metallicity dependences that are not captured in equation (2). On balance we recommend a logtdepl-logM* dependence with a flat or very shallow slope (D=0.06).
4.2.4
Size dependence
Finally we looked for any size or surface density dependences, which have not yet been explored in previous work due to the limited sample sizes. Such dependences could well be related to the dependence of tdepl on sSFR. For example, Wuyts et al. (2016) found that the baryon fraction in SFGs is strongly correlated with surface density (of baryons, or stars). The residual size dependence of tdepl is shown in the upper right panel of Figure 3. We plot the residuals, after correcting for z, sSFR and M*-dependencies, as a function of rest-frame optical size. We derive the sizes from exponential fits to the observed H-band or R-band emission, and then correct to rest-frame 5000 Å effective radii according to the prescription in van der Wel (2014; their Equation 2), after removing the mean population trends as a function of redshift and stellar mass (van der Wel et al. 2014). In the local 23
Universe optical continuum and CO sizes of main sequence galaxies correlate well empirically (e.g. Young & Scoville 1991, Leroy et al 2009, 2013), and the first spatially resolved CO sizes in large z~1-2 disks seem to support this assumption as well (Tacconi et al. 2013; Lippa et al. 2017 in prep.). The distribution in the upper right panel of Figure 2 is flat or marginally increasing (E~0.15±0.08). However, it is probably premature to conclude that there is no surface density dependence of tdepl . High-z disks are dusty and the optical sizes may not represent the true molecular/dust effective radii. In fact recent 1mm dust imaging for a fraction of very massive (>1011 M) z~2-2.5 SFGs suggest very compact, centrally concentrated dust concentrations, with radii typically half those measured in the rest-frame optical (Tadaki et al. 2015, 2016; Barro et al. 2016). In summary, considering the binned data, each of which is an average of 20 to 50 individual detections or stacks, all individual averages corrected for zero-point offsets as described above, scatter with ±0.085 dex around a linear fit line. Individual depletion time measurements have a median 1 uncertainty of ±0.26 dex (combined statistical (SNR) and systematic (calibration etc.) uncertainties). For purely white noise this should integrate down to ±0.047 dex per average of ~30 points. This means that the simple fitting approach proposed in equation (5) describes the 1300 data points used in the fit at better than ~2. We conclude that any additional systematics due to the input assumptions of the different molecular mass determination methods, or any undiscovered hidden correlations, are modest and the scaling relations describe the data at the ±0.1 dex level, or better.
4.3
New Results for Gas Fraction Scaling Relations
We now repeat the same exercise for the molecular gas to stellar mass ratio, μgas=Mmolgas/M*, using equation 6 as the basis of our fitting. Figure 4 and Table 3 show the results. We first fit for the dependence of μgas as a function of redshift normalized to the MS-reference line of Speagle et al. (2014), applying the zero-point corrections to the different data sets. The result is shown in the left panel of Figure 4. The decline in μgas over cosmic time is consistent with the results found previously in the literature based on fewer data points (see Table 1). We find that fitting the redshift-dependence of μgas across 24
the entire range requires a curved, second order function in log(1+z)-logμgas-space, and the best-fit with β=2 is given in Table 3 and clearly improves the quality of the fit over the simple power-law. This second order fitting function reflects the shape of sSFR in equation (1), and demonstrates that sSFR and μgas of MS galaxies track each other, as found in Tacconi et al. (2010, 2013). Because of this curvature of μgas with local slope getting flatter the higher the mean z, fitting subsets of data with only partial redshift coverage will reflect this systematic flattening, for instance when only fitting the FIR dust or 1mm dust data that do not have data at z4
-0.60.2
dSFR/dMmolgas dSFR/dmolgas 1.180.24
1.250.15
1.10.15 increases with δMS 0.90.1
Reference Saintonge+11a,b,12, 13,16a, Huang & Kauffmann 14, Accurso+16 Bigiel +08,11 Leroy+08,13, Schruba +11 Tacconi+10,13 Genzel+10 Daddi +10b, Magdis+12a, Sargent+14, Bethermin+15 Santini+14 Genzel+15
Scoville+16 Popping+15 Genel+14 Lagos+15a
Table 2. Source Physical Properties (Full version available online) Source G3-7652 838945 834187 831870 GN3-5128 G3-4097 G3-8310 … stack Magnelli+14, Berta+16 stack Magnelli+14, Berta+16 stack Magnelli+14, Berta+16 stack Magnelli+14, Berta+16 stack Magnelli+14, Berta+16 stack Magnelli+14, Berta+16 stack Magnelli+14, Berta+16 …
Survey/Method
Redshift
log Mgas (M)
log M* (M)
log SFR (M yr-1)
Log reff (kpc)
PHIBSS2/CO PHIBSS2/CO PHIBSS2/CO PHIBSS2/CO PHIBSS2/CO PHIBSS2/CO PHIBSS2/CO …
0.502 0.502 0.502 0.502 0.503 0.509 0.509 …
9.8 9.9 10.5 10.2 9.9 10.3 10.1 …
10.5 10.7 11.1 10.2 10.3 11.3 10.4 …
0.9 0.6 1.3 1.5 0.7 1.6 1.0 …
0.90 1.03 0.84 0.86 0.81 1.17 0.91 …
PEP+HerMES/dust
0.400
10.6
11.2
0.0
PEP+HerMES/dust
0.401
10.5
10.9
1.4
PEP+HerMES/dust
0.401
10.2
10.6
1.3
PEP+HerMES/dust
0.405
9.9
10.1
1.1
PEP+HerMES/dust
0.406
10.5
11.2
1.7
PEP+HerMES/dust
0.407
11.1
11.6
1.6
PEP+HerMES/dust …
0.407 …
10.0 …
10.4 …
1.3 …
37
…
Table 3. Fit parameters for equations (5) and (6) obtained from error-weighted, multi-parameter regression: log tdepl (Gyr) = A + B*log(1+z) + C*log(sSFR/sSFR(MS,z,M*)) + D*(logM*-10.7) +E*log(Re/Re0(z,M*)) log Mmolgas/M* = A + B*(log(1+z)-F)β + C*log(sSFR/sSFR(MS,z,M*)) + D*(logM*-10.7) +E*log(Re/Re0(z,M*))c
Data all (error weighted) (after removal of z