Hindawi Publishing Corporation Mathematical Problems in Engineering Volume 2015, Article ID 297392, 13 pages http://dx.doi.org/10.1155/2015/297392
Research Article A Line-Based Adaptive-Weight Matching Algorithm Using Loopy Belief Propagation Hui Li,1 Xiao-Guang Zhang,1 and Zheng Sun2 1
School of Mechanical and Electrical Engineering, China University of Mining & Technology, Xuzhou 221116, China College of Mechanical and Electrical Engineering, Zao Zhuang University, Zaozhuang 277160, China
2
Correspondence should be addressed to Xiao-Guang Zhang;
[email protected] Received 22 July 2014; Accepted 22 March 2015 Academic Editor: Hakim Naceur Copyright © 2015 Hui Li et al. This is an open access article distributed under the Creative Commons Attribution License, which permits unrestricted use, distribution, and reproduction in any medium, provided the original work is properly cited. In traditional adaptive-weight stereo matching, the rectangular shaped support region requires excess memory consumption and time. We propose a novel line-based stereo matching algorithm for obtaining a more accurate disparity map with low computation complexity. This algorithm can be divided into two steps: disparity map initialization and disparity map refinement. In the initialization step, a new adaptive-weight model based on the linear support region is put forward for cost aggregation. In this model, the neural network is used to evaluate the spatial proximity, and the mean-shift segmentation method is used to improve the accuracy of color similarity; the Birchfield pixel dissimilarity function and the census transform are adopted to establish the dissimilarity measurement function. Then the initial disparity map is obtained by loopy belief propagation. In the refinement step, the disparity map is optimized by iterative left-right consistency checking method and segmentation voting method. The parameter values involved in this algorithm are determined with many simulation experiments to further improve the matching effect. Simulation results indicate that this new matching method performs well on standard stereo benchmarks and running time of our algorithm is remarkably lower than that of algorithm with rectangle-shaped support region.
1. Introduction Stereo vision is a fundamental technique for extracting 3D information of a scene from two or more 2D images. It is widely applied in robot navigation, remote sensing, and industrial automation. One of the key technologies of stereo vision is stereo matching, which produces a disparity map. The stereo matching algorithm can be classified into two broad categories: global-based and local-based algorithms. Global-based matching algorithms follow the energy minimization principle. First, an energy function is established, consisting of a data term and a smoothness term. Next, this function is minimized with a global optimization method. Dynamic programming [1], loopy belief propagation (LBP) [2, 3], and graph cut [4, 5] are usually employed to identify the minimum energy required for a global-based algorithm. Comprehensive global constraint information can produce a more accurate disparity map in a global-based algorithm.
A local-based matching algorithm is a simple and effective method for stereo matching that is commonly used. An important underlying principle of local-based matching is that pixels in a support region have an approximately equal disparity. To satisfy this principle, it is very important to determine the support region size. The support region must contain enough pixels for intensity variation, and the support region must include only those pixels with the same disparity. Thus, the traditional, local-based matching method is prone to false matching for pixels from the depth discontinuities region, since those pixels are from different depths. To ensure that a local-based matching algorithm performs well in practical applications, various approaches have been proposed. For example, adaptive windows have been used to improve matching results. These methods search an appropriate support region for each pixel, greatly improve the performance of matching results, and outperform standard local-based methods [6–10]. However, it is difficult to search a support region with an arbitrary shape and size, and most of
2
Mathematical Problems in Engineering
Left image
Right image
Computing cost with new adaptiveweight method
Matching cost of left image
Initial disparity map of left image Loop belief propagation
Matching cost of right image
Initial disparity map of right image
Iterative left-right consistency checking
Segmentation voting
Final disparity map
Disparity map refinement
Disparity map initialization
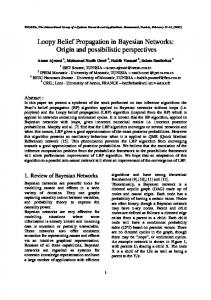
Figure 1: Block diagram of our algorithm.
these methods have a high computational complexity. Other researchers assign different support-weights to the pixels in a support region, keeping the size and shape of a support region constant [11–13]. In recent years, several methods for acquiring satisfactory effect of stereo matching have been adopted. Yang et al. [17] presented a stereo matching algorithm which integrates color-weight, belief propagation, left-right checking, color segmentation, plane fitting, and depth enhancement. Mei et al. [18] integrated the AD-census cost measurement function, the cost aggregation method based cross-based region, the scanline optimize method, the multistep refinement method, and the accelerative algorithm based on CUDA into their algorithm. The algorithm presented in this paper is inspired from adaptive-weight matching algorithm. In this paper, the aim is to propose a low computation complexity and high accuracy stereo matching algorithm. So the rectangle-shaped support region is substituted for the line-shaped support region. Lacking of enough pixel information is a main weakness of the line-shaped support region, which is easy to cause error matching. Adaptive-weight can make full of limited pixel information, by analyzing the characteristic of the adaptiveweight model proposed in [13] on disparity accuracy, we use neural network (NN) to determine the spatial proximity and mean-shift based segmentation method to effectively describe the color similarity. In addition, several approaches are applied to complete the algorithm. We develop a new pixel dissimilarity measurement function which combines Birchfield pixel dissimilarity measurement function and census transform to compute the matching cost. The loopy belief propagation method proposed in [2] is employed to estimate the initial disparity map, which is optimized with min convolution and image pyramid. There are several measurable improvements for the initial disparity map. To further improve the accuracy of the initial disparity map, iterative left-right consistency (LRC) checking and segmentation voting are used to refine the disparity map by analyzing the features of the initial disparity map.
2. Algorithm Description The algorithm presented in this paper can be divided into two steps: a disparity map initialization step and a refinement step. The framework of the algorithm is shown in
p
Figure 2: The assumption of segmentation-based stereo matching.
IMn
wx
f 𝛽
OMn 1
1
IT
f
−1.5
x
fc (Δgpq )
−1 𝛽
1
Figure 3: Spatial proximity described by neural network.
Figure 1. A detailed description of this algorithm is given in the following sections. 2.1. Adaptive-Weight Based Cost Aggregation Method. Assuming the two pixels 𝑝 and 𝑞, the disparity of center pixel 𝑝 wants to be computed. 𝑆(𝑝) is the support region of pixel 𝑝, while 𝑞 is a neighboring pixel of 𝑝 in the support region. The supportweight of 𝑞 is assigned by the following according to [12]: 𝑤 (𝑝, 𝑞) = 𝑓𝑐 (Δ𝑐𝑝𝑞 ) 𝑓𝑐 (Δ𝑔𝑝𝑞 ) ,
(1)
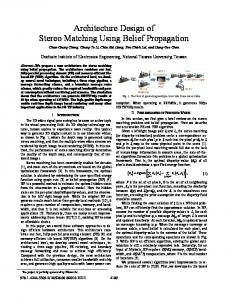
where 𝑓𝑐 (Δ𝑔𝑝𝑞 ) represents the spatial proximity, 𝑓𝑐 (Δ𝑐𝑝𝑞 ) represents the color similarity, and 𝑤(𝑝, 𝑞) is the supportweight. Our algorithm is designed on the basis of this framework. The list of variables used in this paper is shown in the end of the paper. 2.1.1. The Model of Line-Based Adaptive-Weight. Wang et al. [13] noted that when the support region is large enough, color similarity plays a major role in computing the center pixel disparity within a certain range. As shown in Figure 2, red represents the support region 𝑆(𝑝). We used the pixels in 𝑆(𝑝) to compute the disparity of 𝑝. The effects of spatial proximity can be neglected in the pale blue region according to [13]. We call this region the transition area, represented by 𝑇(𝑝). To satisfy this principle, the neural network can be applied in the design of this spatial proximity model. Figure 3 shows the spatial proximity model established by neural network. The position of a pixel is the input, the spatial
Mathematical Problems in Engineering
3
0.6
fc (Δgpq )
0.55 0.5 0.45 0.4 0.35 −15 −12
−9
−6
−3
0
3
6
9
12
15
x
Figure 4: Spatial proximity proposed in this paper when 𝛼 = 1, 𝛽 = 8, and 𝐿 𝑠 = 15.
proximity is the output, and the connect weights are shown as in the figure. In fact, the distance 𝑥 − 𝑥𝑝 is the input of neural network. To simplify the notations, suppose that the center point 𝑝 is at 𝑥𝑝 = 0, the distance 𝑥 − 𝑥𝑝 can be simplified into 𝑥 which represents the position of a pixel. The concrete form of the spatial proximity is expressed by 𝐼𝑀1 = 𝑥 + 𝛽, 𝐼𝑀2 = −𝑥 + 𝛽, 𝑂𝑀𝑖 = 𝑓 (𝐼𝑀𝑖 ) , 2
(2)
𝐼𝑇 = ∑𝑂𝑀𝑖 − 1.5,
∑𝑞∈𝐿 𝑝 ,𝑞𝑑 ∈𝐿 𝑝 𝑤 (𝑝, 𝑞) 𝑤 (𝑝𝑑 , 𝑞𝑑 ) 𝑒 (𝑞, 𝑞𝑑 ) 𝑑
∑𝑞∈𝐿 𝑝 ,𝑞𝑑 ∈𝐿 𝑝 𝑤 (𝑝, 𝑞) 𝑤 (𝑝𝑑 , 𝑞𝑑 )
,
(4)
𝑑
𝑓𝑐 (Δ𝑔𝑝𝑞 ) = 𝑓 (𝐼𝑇 ) , where 𝑓(𝑥) = 1/(1 + 𝑒−𝛼𝑥 ) is the sigmoid function. Figure 4 demonstrates the varied trend of the spatial proximity according to the position of a pixel. In Figure 4, the space between the two blue lines is the transition area and the support region is represented by the whole 𝑥-axis. It can be seen from Figure 4 that (1) the spatial proximity of pixel in the transition area is significantly greater than that of pixel in other area, which accords with the spatial proximity model of traditional adaptive-weight theory; (2) there is not much difference between these pixels in the transition area for the spatial proximity, which means that the influence of spatial proximity can be neglected. According to the segmentation-based stereo matching principle [14, 19], a new model of color similarity is established by the following in [20]: if seg (𝑞) = seg (𝑝) otherwise.
2.1.2. Cost Aggregation. The matching cost of pixel 𝑝 with disparity 𝑑 is represented by 𝐸 (𝑝, 𝑑) =
𝑖=1
1 { { { 𝑓𝑐 (Δ𝑐𝑝𝑞 ) = { Δ2 𝑐𝑝𝑞 { {exp (− ) 𝛾𝑐 {
𝑝 and its neighbor pixel 𝑞 when 𝑝 and 𝑞 belong to the same segmentation. That color similarity model based on image segmentation can achieve good performance, as introduced in [13]. Meanshift is a nonparametric estimation iterative technique, and its application domains include computer vision, clustering, and image processing [21]. In this work, we use mean-shift as the segmentation method.
(3)
Equation (3) shows that color similarity contributes enormously to measure the dissimilarity between center pixel
where 𝑝𝑑 and 𝑞𝑑 are the corresponding pixels of 𝑝 and 𝑞, respectively, when the disparity of the center pixel is 𝑑. The pixel dissimilarity measurement function 𝑒(𝑞, 𝑞𝑑 ) in (4) is very important for cost aggregation. The absolute difference and Birchfield function [22] are widely used in cost aggregation. To improve the matching accuracy of the textureless and repetitive regions, the pixel dissimilarity measurement function is described by combing Birchfield function and census transform: 𝑒 (𝑞, 𝑞𝑑 ) = min (𝐶Birch (𝑞, 𝑞𝑑 , 𝐼𝑅 , 𝐼𝐿 ) , 𝑇Birch ) + min (𝐶Census (𝑞, 𝑞𝑑 ) , 𝑇Census ) .
(5)
To validate the effect of this cost aggregation method, simulation results on Teddy and Cones with Birchfield method and our method are shown in Figure 5. 2.2. Initial Disparity Determination. The winner-take-all (WTA) searching strategy is a common method for determining disparity, which can be expressed by 𝐷 (𝑝) = arg min 𝐸 (𝑝, 𝑑) . 𝑑
(6)
4
Mathematical Problems in Engineering
(a)
(b)
(c)
Figure 5: (a) Part of the origin image. (b) Disparity results which are computed with our cost aggregation method. (c) Disparity results which are computed with Birchfield pixel dissimilarity measurement function.
(1) Computing matching cost 𝐸 by (4) Initializing pyramid level 𝑙 and down sampling factor 𝜂 = 0.5 (2) Pyramid initialization Pyramid(1).cost = 𝐸 (3) Establishing pyramid structure with 𝑙 and 𝜂 (4) For each level 𝑖 (5) For each iteration 𝑗 (6) Updating left, right, up and down direction message for each pixel (7) End (8) End (9) Determining disparity for each pixel by max-product principle Algorithm 1: The procedure of initial determination procedure.
WTA tends to produce a low accuracy disparity map. Therefore, we adopt an efficient LBP algorithm proposed in [2] in this paper. In this LBP algorithm, FFT convolution and image pyramid are integrated into LBP, which can effectively decrease the complexity of LBP and increase the matching effect. The flowchart of the initial determination procedure is shown in Algorithm 1. 2.3. Disparity Refinement. It is inevitable that initial disparity maps will contain many error-matched pixels. To refine the disparity map, a two-step postprocessing method is put forward in this section.
2.3.1. Left-Right Consistency Check. The disparity map 𝐷𝐿 for the left image is computed by previous steps. The disparity map 𝐷𝑅 for the right image is computed in a similar manner. In [15, 17], pixels are classified into several types according to 𝐷𝐿 , 𝐷𝑅 , and 𝐸𝑅 to remove outliers. Then different strategies are designed for different type of pixels to determine its disparity. In this work, we analyzed the property of initial disparity map. Figure 6 shows the distribution of bad pixels after executing the disparity initialization step of our algorithm for Tsukuba. It can be seen from this figure that most of the bad pixels concentrate in the occluded region. According to this result, most of the pixels match correctly and the initial
Mathematical Problems in Engineering
5
(1) Establishing the table of pixel type 𝑆𝑡𝑖 according to (7)-(8) (2) 𝑆𝑡 ← 𝑆𝑡𝑖 (3) For each iteration 𝑘 (4) For each undependable pixel 𝑝𝑖 which is determined by 𝑆𝑡 (5) Searching the nearest dependable pixel 𝑝𝑖𝐿 and 𝑝𝑖𝑅 (6) 𝑑(𝑝𝑖 ) ← min(𝑑𝑜 (𝑝𝑖𝐿 ), 𝑑𝑜 (𝑝𝑖𝑅 )) //where 𝑑𝑜 (⋅) represents initial disparity of pixel (7) If 𝑑(𝑝𝑖 ) ≠ 𝑑𝑜 (𝑝𝑖 ) (8) Set 𝑝𝑖 as dependable pixel in 𝑆𝑡 (9) End (10) End (11) End (12) End Algorithm 2: The disparity map after execution of left-right consistency checking.
Table 1: The error percentages in different region for disparity refinement step.
Initial disparity map Left-right consistency Segmentation voting
Nonocc 1.21% 1.17% 0.95%
All 3.20% 2.40% 1.62%
Disc 6.42% 6.30% 5.07%
Figure 7: The disparity map after execution of left-right consistency checking.
Figure 6: The distribution of bad pixels for initial disparity map of Tsukuba. Bad pixels are marked with red points.
disparity in the nonocc region should be trusted. Therefore an iterative left-right consistency check is proposed for handling this. Pixels can be divided into two types: undependable pixels and dependable pixels. Pixel 𝑝 is classified as dependable when it meets the following condition: 𝐷𝐿 (𝑝) = 𝐷𝑅 (𝑝 − 𝐷𝐿 (𝑝)) .
(7)
Pixel 𝑝 is considered to be undependable if it fits the following condition: 𝐷𝐿 (𝑝) ≠ 𝐷𝑅 (𝑝 − 𝐷𝐿 (𝑝)) .
(8)
The new disparity of the undependable pixel can be computed as in Algorithm 2. Figure 7 shows the result after the execution of iterative left-right consistency checking. Table 1 shows the detailed data for the role of iterative left-right consistency checking.
p
Figure 8: Pixelwise region for segmentation voting.
2.3.2. Segmentation Voting. The pixelwise region shown in Figure 8 is established according to color consistency. This region can be represented by 𝑈(𝑝). Pixels in 𝑈(𝑝) satisfy the following condition: 𝐼𝑞 − 𝐼𝑝 < 𝜏, 𝑞 ∈ 𝑈 (𝑝) , 𝑥𝑞 − 𝑥𝑝 < 𝐿 sv , (9) 𝑦𝑞 − 𝑦𝑝 < 𝐿 sv . Let 𝐻(𝑑) represent the frequency distribution of disparity 𝑑 in 𝑈(𝑝). The new disparity is updated by Algorithm 3.
6
Mathematical Problems in Engineering
Figure 9: The disparity map of Tsukuba obtained by segmentation voting.
2.1
4.2
1.7
3 0
10
20
30
40
50
60
1.3 70
Error percentage in all region (%)
Error percentage in all region (%)
5.4
18.5
14.5
17.5
14
16.5
13.5
15.5
13
14.5
12.5
13.5
12
12.5
11.5
11.5
11
10.5
0
10
20
30
Ls
Tsukuba Venus
40
50
60
10.5 70
Ls
Teddy Cones (a)
(b)
Figure 10: (a) Performance evaluation of the proposed method when varying 𝐿 𝑠 (Tsukuba and Venus). (b) Performance evaluation of the proposed method when varying 𝐿 𝑠 (Teddy and Cones).
(1) 𝐻(𝑑) ← 0 (2) For each 𝑞 ∈ 𝑈(𝑝) (3) For each 𝑑 ∈ [𝑑min , 𝑑max ] (4) If 𝑑 == 𝐷𝐿 (𝑞) (5) 𝐻(𝐷𝐿 (𝑞)) ← 𝐻(𝐷𝐿 (𝑞)) + 1 (6) End (7) End (8) End (9) 𝐷𝐿 (𝑝) = arg max 𝐻(𝑑) 𝑑
Algorithm 3: Disparity determination of segmentation voting.
The 3 × 3 median filter is applied to the left disparity map. Figure 9 shows the effect of segmentation voting on the accuracy of the disparity map.
3. Results and Discussion 3.1. Parameters Determining. The parameters involved in our algorithm greatly affect the performance of the algorithm. In this section, we present the parameter settings. We considered eight main parameters: 𝐿 𝑠 , 𝛼, 𝛽, 𝛾𝑐 , ℎ𝑆 , ℎ𝐼 , 𝐿 sv , and 𝜏, which are kept constant for all benchmarks. Figure 10 shows the influence of 𝐿 𝑠 on the accuracy of disparity map obtained by our algorithm. When 𝐿 𝑠 varies from 35 to 65, our algorithm is insensitive to 𝐿 𝑠 . Figure 11 demonstrates that the performance of our algorithm varies with 𝛼 and 𝛽. From these figures, it can be noted that (1) generally speaking when 𝛽 is larger than 15, the influence of 𝛼 over algorithm performance is small for Tsukuba, Venus, and Teddy. (2) Our algorithm shows good performance for Tsukuba and Teddy when 𝛽 ∈ [0, 45] and 𝛼 ∈ [0.3, 1]. (3) The error percentage tends to decrease with a decreasing 𝛼 when 𝛽 is smaller than 15. (4) In regard to Cones,
7 1.44 3.7
3.8 3.6
3.6
3.4
3.5
3.2 3.4 3 2
3.3
1.5
1.5
1.42
1.45
1.4
1.4
1.38
1.35
1.36
1.3 2
1.34 1.5
1
𝛼
Error percentage in all region (%)
Error percentage in all region (%)
Mathematical Problems in Engineering
0.5
20
10
0 0
50
40
30
3.2
1
𝛼
0.5 10
0 0
𝛽
Error percentage in all region (%)
13.8 14
13.6
13.5
13.4
13
13.2
12.5
13
12 2
11.4 11.35 12
0.5
20
10
0 0
50
40
30
11.25 11.2
11
11.15 10.5 2
11.1 11.05
1.5
1.5 1
11.3
11.5
12.8
𝛼
30 𝛽
(b)
Error percentage in all region (%)
(a)
20
1.32
50
40
12.6
11
1
𝛼
0.5
𝛽
20
10
0 0
(c)
50
40
30
10.95 10.9
𝛽
(d)
Figure 11: (a) Performance evaluation of the proposed method according to 𝛼 and 𝛽 for Tsukuba. (b) Performance evaluation of the proposed method according to 𝛼 and 𝛽 for Venus. (c) Performance evaluation of the proposed method according to 𝛼 and 𝛽 for Teddy. (d) Performance evaluation of the proposed method according to 𝛼 and 𝛽 for Cones.
Error percentage in all region (%)
3.8
1.5
3.6
1.4
1.3
3.4
3.2
0
2
4
6
8
10 𝛾c
Tsukuba Venus
12
14
16
18
1.2 20
Error percentage in all region (%)
1.6
4
18
13.5
17
13
16
12.5
15
12
14
11.5
13
11
12
10.5
11
0
2
4
6
8
10 𝛾c
12
14
16
18
10 20
Teddy Cones (a)
(b)
Figure 12: (a) Performance evaluation of the proposed method when varying 𝛾𝑐 (Tsukuba and Venus). (b) Performance evaluation of the proposed method when varying 𝛾𝑐 (Teddy and Cones).
Mathematical Problems in Engineering
Error percentage in all region (%)
7.5 7 8
6.5
7
6
6
5.5
5
5
4
4.5
Error percentage in all region (%)
8
4
3 20 15
20 hS
10 5
0 0
2 1.9
2
1.8 1.7
1.5
1.6 1.5
1 20
1.4 15 hS
3.5
15
10
5
2.1
2.5
1.3 10
hI
5 0
1.2
hI
(b)
14
14.5
13.8
14
13.6
13.5
13.4
13
13.2 12.5
13
12 20
12.8 12.6 15
hS
12.4 10 5
2
4
6
8
10 hI
12
14
16
Error percentage in all region (%)
Error percentage in all region (%)
(a)
15
10
5
20
12 12.5 11.8 12 11.6 11.5 11.4
11
11.2
10.5 20 20
15
12.2
hS
10
10
5
5 0
(c)
15
11
hI
(d)
Figure 13: (a) Performance evaluation of the proposed method according to ℎ𝑆 and ℎ𝐼 for Tsukuba. (b) Performance evaluation of the proposed method according to ℎ𝑆 and ℎ𝐼 for Venus. (c) Performance evaluation of the proposed method according to ℎ𝑆 and ℎ𝐼 for Teddy. (d) Performance evaluation of the proposed method according to ℎ𝑆 and ℎ𝐼 for Cones.
the performances of this algorithm improve as 𝛼 increases, and when 𝛽 lies between 15 and 30. Figure 12 shows the influence of 𝛾𝑐 on performance. The trend of the error percentage is U-shaped for Tsukuba when 𝛾𝑐 is smaller than 20. The error percentage bottom out when 𝛾𝑐 is between 7 and 13. The error percentage for Venus follows a downward trend. For Teddy and Cones, the error percentage is inversely proportional to 𝛾𝑐 . When 𝛾𝑐 is larger than 12, the error percentage is insensitive to 𝛾𝑐 . Figure 13 shows the performance of our algorithm according to ℎ𝑆 and ℎ𝐼 . From these figures, our algorithm has a good ability of robustness with different values of ℎ𝑆 . When ℎ𝐼 ∈ [3, 8], the error percentage of the disparity map obtained by our algorithm is still fairly low. For the disparity map refinement step, two main parameters must be set. 𝐿 sv and 𝜏 are previously introduced. Figure 14 shows the influence of 𝐿 sv and 𝜏 on performance. When 𝐿 sv ∈ [5, 20] and 𝜏 ∈ [7, 10], all data sets show good performance.
Table 2: Parameter setting for Middlebury benchmark. 𝐿𝑠 40
𝛼 1
𝛽 15
𝛾𝑐 8
ℎ𝑆 15
ℎ𝐼 5
𝐿 sv 7
𝜏 12
3.2. Experimental Results. We evaluate our algorithm on Middlebury benchmarks [23] with error threshold 1. The test platform hardware consists of T9600 CPU and 5 GB memory. Software consists of MATLAB 2014a and VS2012. Parameters are shown in Table 2. Simulation results on Middlebury data sets are presented in Figure 15. The quantitative performance of our algorithm is shown in Tables 3 and 4. Our algorithm ranks 5th in the Middlebury data set (July 1, 2014). These results demonstrate our algorithm has a good performance. However, it is difficult to decrease the error percentages in the three regions (nonocc, all, and disc) at the same time. This is because many pixels with correct disparity
Mathematical Problems in Engineering
9
2.6
3
2.4
2.5
2.2
2
2
1.5 25 20 20
15
𝜏S
0.7
5
5
0.6
0.8
0.55 0.6
0.5
0.4
0.45
0.2 25
0.4 20
20 15
15 𝜏S 10 V
10 L SV
0 0
0.65
1
15
10
V
1.8
0.75 Error percentage in all region (%)
Error percentage in all region (%)
2.8
5
5
0.35 0.3
10 L SV
0 0
(a)
(b)
10.5 11.5
10.8
11
10.6
10.5
10.4
10
10.2
9.5 30
10 20 𝜏S
V
20 10
5
0 0
10 L SV
15
Error percentage in all region (%)
Error percentage in all region (%)
11 11
10
10.5 10
9.5
9.5 9
9
8.5 8 30
8.5 20
20
9.8
𝜏
15 10
5
0 0
(c)
10 L SV
(d)
Figure 14: (a) Performance evaluation of the proposed method according to 𝐿 sv and 𝜏 for Tsukuba. (b) Performance evaluation of the proposed method according to 𝐿 sv and 𝜏 for Venus. (c) Performance evaluation of the proposed method according to 𝐿 sv and 𝜏 for Teddy. (d) Performance evaluation of the proposed method according to 𝐿 sv and 𝜏 for Cones. Table 3: Quantitative evaluation results for Middlebury benchmark. Algorithm AdaptingBP CoopRegion [14] Our algorithm RDP [15] MultiRBF [16]
Tsukuba Nonocc All 1.1122 1.379 0.875 1.162 0.898 1.5923 0.9711 1.3911 1.3347 1.5620
Disc 5.7924 4.614 4.789 5.0011 6.0232
Nonocc 0.104 0.115 0.115 0.2139 0.1311
Venus All 0.217 0.215 0.3624 0.3829 0.172
Disc 1.448 1.5414 1.4911 1.8924 1.8421
Teddy Nonocc All 4.2217 7.0615 5.1630 8.3120 4.3318 9.9332 4.8422 9.9433 5.0928 6.368
Disc 11.818 13.025 11.217 12.622 13.429
Cones Nonocc All 2.4822 7.9228 2.7939 7.1814 2.8141 8.4645 2.5325 7.6920 2.9048 6.768
Disc 7.3227 8.0147 7.8540 7.3828 7.1024
Table 4: The results of whole performance evaluation for Middlebury benchmark. Algorithm AdaptingBP CoopRegion Our algorithm RDP MultiRBF
Average rank 16.5 12.2 22.8 22.9 23.2
Average percent bad pixels 4.23 4.41 4.48 4.57 4.39
10
Mathematical Problems in Engineering
(a)
(b)
(c)
Figure 15: (a) The final disparity map obtained by our algorithm. (b) Error maps. (c) Ground truth.
Mathematical Problems in Engineering
11
Table 5: Comparison between standard LRC checking and iterative LRC checking presented in Section 2.3.1. Algorithm Initial disparity Standard LRC checking Iterative LRC checking
Nonocc 1.21% 1.43% 1.17%
All 3.20% 2.10% 2.40%
Disc 6.42% 7.54% 6.30%
Table 6: The average running time of each part of our algorithm for Tsukuba. Mean-shift 7.37
Cost aggregation 19.23
LBP 0.78
Iterative LRC 0.24
Segmentation voting 0.30
Table 7: The variation of average running time of cost aggregation of our rectangle-based algorithm under different size of support region. The size of support region Running time
11 × 11 37.02
15 × 15 69.81
Figure 16: Erroneous disparity distribution determined by (7)-(8) for the Tsukuba image.
are classified as undependable, according to (8). Tsukuba can be used as an example. Figure 16 represents the bad pixels detected by (7)-(8). Figure 6 shows the bad pixels obtained by comparing the initial disparity map and ground truth. Figure 6 indicates that true bad pixels are distributed in the occlusion region. However, it can be inferred from Figure 16 that many pixels in nonocc and disc regions are mistakenly classified as undependable. When standard LRC checking is used, misclassified pixels in the disc region may be assigned a wrong disparity, as shown in Figure 17. Table 5 shows quantitative comparison results for standard LRC checking and iterative LRC checking. Thus, it can be seen that the error percentage in the disc region greatly increases after applying standard LRC checking. Because the disc region is part of the nonocc region, the error percentage in the nonocc region also increases. Our iterative LRC checking method can effectively improve the performance of our stereo matching algorithm. 3.3. Running Time of Our Algorithm. In this section, we investigate the computation running time of our algorithm. The running time directly reflects computational complexity. Without a loss of generality, our algorithm runs 50 times and
19 × 19 106.53
23 × 23 154.41
27 × 27 213.94
Figure 17: Erroneous disparity distribution after executing standard LRC checking for Tsukuba.
average running time was calculated. Results are shown in Table 6. The new rectangle-based adaptive-weight method can be obtained by imposing the 𝑦-direction constraint on the new weight model. Table 7 displays the running time of cost aggregation of our algorithm with the rectangle-shaped support region under different sizes of support region. The rectangle-based algorithm also runs 50 times under each size of support windows. Our algorithm with the rectangle-shaped support region performed best when the size of the support region is 27 × 27; the error percentages of the initial disparity map in nonocc, all, and disc regions are 1.45%, 3.42%, and 7.08%, respectively. Tables 5–7 show that our algorithm produced notable results in decreasing computation complexity and improving performance.
4. Conclusions In this work, we proposed a new line-based adaptive-weight stereo matching algorithm that integrates several methods. The main conclusions that can be drawn from our results are as follows.
12
Mathematical Problems in Engineering (1) Cost aggregation is the most time-consuming part of stereo matching algorithm. Using a line-shaped support region can dramatically reduce the elapsed time of cost aggregation. (2) The adaptive-weight model proposed in this paper can produce a rather satisfactory initial disparity map in the absence of enough pixel information. (3) Experimental results show that the algorithm proposed in this paper can attain a better matching effect with less running time.
Although our algorithm has a good performance on Middlebury data sets, there is still much room for improvement. (1) There are too many parameters in our algorithm to accommodate different image pairs. In further research, we will analyze the intrinsic relationship among the parameters and reduce the number of parameters. (2) Figure 13 indicates that image characteristics have a significant impact on the optimum values of 𝛼 and 𝛽. In future studies, we will explore how the optimum values of 𝛼 and 𝛽 vary according to the texture of image.
List of Variables 𝐿 𝑠: 𝛼: 𝛽: ℎ𝑆 : ℎ𝐼 : 𝐿 sv : 𝜏:
The half-length of support region Shape controlling parameter The half-length of transition region Spatial radius of mean-shift Color radius of mean-shift The half-length of segment for segmentation voting Confidence level of color similarity for segmentation voting.
Conflict of Interests The authors declare that there is no conflict of interests regarding the publication of this paper.
Acknowledgments The authors express their appreciation for the financial support of the Shandong Natural Science Foundation, Grant no. ZR2013FL033. They also extend their sincere gratitude to reviewers for their constructive suggestions.
References [1] J. C. Kim, K. M. Lee, B. T. Choi, and S. U. Lee, “A dense stereo matching using two-pass dynamic programming with generalized ground control points,” in Proceedings of the IEEE Computer Society Conference on Computer Vision and Pattern Recognition (CVPR ’05), pp. 1075–1082, San Diego, Calif, USA, June 2005. [2] P. F. Felzenszwalb and D. P. Huttenlocher, “Efficient belief propagation for early vision,” International Journal of Computer Vision, vol. 70, no. 2, pp. 41–54, 2006.
[3] J. Sun, Y. Li, S. B. Kang, and H.-Y. Shum, “Symmetric stereo matching for occlusion handling,” in Proceedings of the IEEE Computer Society Conference on Computer Vision and Pattern Recognition (CVPR ’05), pp. 399–406, San Diego, Calif, USA, June 2005. [4] V. Kolmogorov and R. Zabih, “What energy functions can be minimized via graph cuts?” IEEE Transactions on Pattern Analysis and Machine Intelligence, vol. 26, no. 2, pp. 147–159, 2004. [5] H. Li and G. Chen, “Segment-based stereo matching using graph cuts,” in Proceedings of the IEEE Computer Society Conference on Computer Vision and Pattern Recognition (CVPR ’04), vol. 1, pp. 74–81, Washington, DC, USA, June 2004. [6] T. Kanade and M. A. Okutomi, “Stereo matching algorithm with an adaptive window: theory and experiment,” IEEE Transactions on Pattern Analysis and Machine Intelligence, vol. 16, no. 9, pp. 920–932, 1994. [7] X.-Z. Zhou, G.-J. Wen, and R.-S. Wang, “Fast stereo matching using adaptive window,” Chinese Journal of Computers, vol. 29, no. 3, pp. 473–479, 2006. [8] Y. Boykov, O. Veksler, and R. I. Zabi, “A variable window approach to early vision,” IEEE Transactions on Pattern Analysis and Machine Intelligence, vol. 20, no. 12, pp. 1283–1294, 1998. [9] O. Veksler, “Fast variable window for stereo correspondence using integral images,” in Proceedings of the IEEE Computer Society Conference on Computer Vision and Pattern Recognition (CVPR ’03), vol. 1, pp. 556–561, Madison, Wis, USA, June 2003. [10] K. Zhang, J. Lu, and G. Lafruit, “Cross-based local stereo matching using orthogonal integral images,” IEEE Transactions on Circuits and Systems for Video Technology, vol. 19, no. 7, pp. 1073– 1079, 2009. [11] Y. Xu, D. Wang, T. Feng, and H.-Y. Shum, “Stereo computation using radial adaptive windows,” in Proceedings of 16th International Conference on Pattern Recognition (ICPR ’02), vol. 3, pp. 595–598, Quebec, Canada, August 2002. [12] K.-J. Yoon and I. S. Kweon, “Adaptive support-weight approach for correspondence search,” IEEE Transactions on Pattern Analysis and Machine Intelligence, vol. 28, no. 4, pp. 650–656, 2006. [13] F. Wang and D. Huang, “Improved Yoon stereo matching algorithm based on adaptive weight,” Journal Electronic Measurement and Instrument, vol. 24, no. 7, pp. 632–637, 2010. [14] A. Klaus, M. Sormann, and K. Karner, “Segment-based stereo matching using belief propagation and a self-adapting dissimilarity measure,” in Proceedings of the 18th International Conference on Pattern Recognition (ICPR ’06), pp. 15–18, Hong Kong, China, August 2006. [15] X. Sun, X. Mei, S.-H. Jiao, M.-C. Zhou, and H. Wang, “Stereo matching with reliable disparity propagation,” in Proceedings of the International Conference on 3D Imaging, Modeling, Processing, Visualization and Transmission (3DIMPVT ’11), pp. 132–139, Hangzhou, China, May 2011. [16] X.-Z. Zhou and P. Boulanger, “New eye contact correction using radial basis function for wide baseline videoconference system,” in Proceedings of 13th Pacific-Rim Conference on Multimedia (PCM '12), pp. 68–79, Singapore, December 2012. [17] Q. X. Yang, L. Wang, R. Yang, H. Stew´enius, and D. Nist´er, “Stereo matching with color-weighted correlation, hierarchical belief propagation, and occlusion handling,” IEEE Transactions on Pattern Analysis and Machine Intelligence, vol. 31, no. 3, pp. 492–504, 2009. [18] X. Mei, X. Sun, M.-C. Zhou, S.-H. Jiao, H. Wang, and X. Zhang, “On building an accurate stereo matching system on
Mathematical Problems in Engineering
[19]
[20]
[21]
[22]
[23]
graphics hardware,” in Proceedings of the IEEE International Conference on Computer Vision Workshops (ICCV ’11), pp. 467– 474, Barcelona, Spain, November 2011. Z.-F. Wang and Z.-G. Zheng, “A region based stereo matching algorithm using cooperative optimization,” in Proceedings of the 26th IEEE Conference on Computer Vision and Pattern Recognition (CVPR ’08), pp. 1–8, Anchorag, Alaska, USA, June 2008. F. Tombari, S. Mattoccia, and L. D. Stefano, “Segmentationbased adaptive support for accurate stereo correspondence,” in Proceedings of 2nd Pacific-Rim Symposium on Image and Video Technology (PSIVT ’07), pp. 427–438, Santiago, Chile, December 2007. D. Comaniciu and P. Meer, “Mean shift: a robust approach toward feature space analysis,” IEEE Transactions on Pattern Analysis and Machine Intelligence, vol. 24, no. 5, pp. 603–619, 2002. S. Birchfield and C. Tomasi, “Depth discontinuities by pixel-topixel stereo,” International Journal of Computer Vision, vol. 35, no. 3, pp. 269–293, 1999. “Middlebury Stereo Vision Page,” http://vision.middlebury.edu/ stereo/.
13
Advances in
Operations Research Hindawi Publishing Corporation http://www.hindawi.com
Volume 2014
Advances in
Decision Sciences Hindawi Publishing Corporation http://www.hindawi.com
Volume 2014
Journal of
Applied Mathematics
Algebra
Hindawi Publishing Corporation http://www.hindawi.com
Hindawi Publishing Corporation http://www.hindawi.com
Volume 2014
Journal of
Probability and Statistics Volume 2014
The Scientific World Journal Hindawi Publishing Corporation http://www.hindawi.com
Hindawi Publishing Corporation http://www.hindawi.com
Volume 2014
International Journal of
Differential Equations Hindawi Publishing Corporation http://www.hindawi.com
Volume 2014
Volume 2014
Submit your manuscripts at http://www.hindawi.com International Journal of
Advances in
Combinatorics Hindawi Publishing Corporation http://www.hindawi.com
Mathematical Physics Hindawi Publishing Corporation http://www.hindawi.com
Volume 2014
Journal of
Complex Analysis Hindawi Publishing Corporation http://www.hindawi.com
Volume 2014
International Journal of Mathematics and Mathematical Sciences
Mathematical Problems in Engineering
Journal of
Mathematics Hindawi Publishing Corporation http://www.hindawi.com
Volume 2014
Hindawi Publishing Corporation http://www.hindawi.com
Volume 2014
Volume 2014
Hindawi Publishing Corporation http://www.hindawi.com
Volume 2014
Discrete Mathematics
Journal of
Volume 2014
Hindawi Publishing Corporation http://www.hindawi.com
Discrete Dynamics in Nature and Society
Journal of
Function Spaces Hindawi Publishing Corporation http://www.hindawi.com
Abstract and Applied Analysis
Volume 2014
Hindawi Publishing Corporation http://www.hindawi.com
Volume 2014
Hindawi Publishing Corporation http://www.hindawi.com
Volume 2014
International Journal of
Journal of
Stochastic Analysis
Optimization
Hindawi Publishing Corporation http://www.hindawi.com
Hindawi Publishing Corporation http://www.hindawi.com
Volume 2014
Volume 2014