cation systems, whether this be mobile telephony or VoIP com- munications [1]. ... olution power spectral density (PSD) estimate Pxx,k(fl), M overlapping ...
ICICS-PCM 2003 15-18 December 2003 Singapore
1A4.4
A Low Complexity Statistical Voice Activity Detector with Performance Comparisons to ITU-T / ETSI Voice Activity Detectors Alan Davis and Sven Nordholm Western Australian Telecommunications Research Institute. 39 Fairway, Nedlands, WA 6907, Australia.
Abstract Traditionally voice activity detection algorithms are based on any combination of general speech properties such as temporal energy variations, periodicity, and spectrum. This paper describes a statistical method for voice activity detection using a signal-to-noise ratio measure. The method employs a low-variance spectrum estimate and an adaptive threshold to make a statistical voice activity decision. An added advantage of the method is that it only requires low resources such as memory and computational time. Furthermore the method has been compared to modern standard voice activity detection algorithms with results indicating good performance in babble, white and vehicle noise.
1 Introduction Voice activity detection (VAD) is becoming increasingly important and relevant in modern telecommunication and speech enhancement systems. This increase can be largely attributed to the desire to lower the average bit-rate of speech communication systems, whether this be mobile telephony or VoIP communications [1]. The VAD mechanism simply decides if speech is present. This information is then used to selectively encode and transmit data. The result from this selectivity is the aforementioned data savings, but also power savings for mobile devices [2], co-channel interference reduction in mobile telephony [3] and greater noise suppression in speech enhancement. Traditionally, VAD algorithms are based on heuristics or fuzzy rules, and general speech properties, for example see [4], [5], [6]. This design methodology makes it difficult to optimize relevant parameters and obtain consistent results. Recently, attempts have been made to develop a statistical model-based VAD [7], [8]. These schemes adopt the model proposed by Ephraim and Malah [9]. The model assumes that Fourier coefficients are statistically independent Gaussian random variables and is motivated by the central limit theorem. Using this model a likelihood ratio is developed and a statistical hypothesis test conducted. This paper proposes a VAD scheme that addresses the short comings of current statistical model-based voice activity detectors. The proposed scheme incorporates a low variance spectrum estimate and a statistical detection mechanism. The scheme removes the need to estimate undesirable parameters such as the a priori signal to noise ratio. Instead the scheme
0-7803-8185-8/03/$17.00 © 2003 IEEE
depends on the expected noise power spectral density and the variance of a ’signal to noise ratio measure’ estimated during periods of noise. These two parameters are simple to estimate during an initial silence period. Further, the proposed VAD also addresses the issue of threshold determination for the hypothesis test. This is commonly ignored in statistical model-based VADs [7], [8]. An expression is developed for a threshold based on noise statistics and the desired performance of the VAD. In this manner the proposed VAD adapts to the current noise environment and can be configured using only a single meaningful parameter. The combination of these methods results in a statistical test that is computationally efficient and elegant in its implementation. Finally, this paper presents a possible implementation. The proposed implementation is evaluated and compared to modern standard algorithms, namely the ETSI AMR VAD options 1 and 2 [4] and the ITU G729 Annex B VAD [5]. The evaluation indicates that the proposed scheme yields good results through a range of different noise environments and range of signal to noise ratios. The most interesting aspect of the results is the highly consistent nature of the proposed algorithm, indicating a good correlation between theory and the observed results.
2 Signal-to-Noise Ratio Measure Consider the case in which a received speech signal is corrupted by stationary additive noise. The framed received signal may thus be modelled in the following way, xk (n) = sk (n) + vk (n),
(1)
where sk (n) and vk (n) are the clean speech and additive noise of the k th frame respectively. In order to analyze the received signal, spectrum estimation techniques are commonly employed. Typically a periodogram is used, however it is well known that the periodogram is an inconsistent spectral estimator. Therefore low-variance spectrum estimation techniques should be used to accurately evaluate the spectral content of the received signal. Techniques such as the Welch and Bartlett methods were investigated for this purpose. The Welch method of overlapping windows was found to give a good trade off between variance reduction and spectral resolution reduction. To generate a reduced variance, reduced resolution power spectral density (PSD) estimate Pxx,k (fl ), M overlapping sub-frames with a length of L each are used. The sub-frames are overlapped 50% and windowed with a hanning window.
The aforementioned low-variance spectrum estimation tech- 3 Statistical Detection using the SNR niques generally do not produce coefficients that follow a Measure zero mean Gaussian distribution. In order to develop a more tractable detection problem, a zero mean Gaussian distribution In order to make a VAD decision two hypotheses are considis preferable. We define a ’signal-to-noise ratio’ measure as ered, the null and the alternative. These can be represented in follows, the following manner, Pxx,k (fl ) ψk (fl ) = − 1, (2) Pvv,k (fl ) Pˆvv (fl ) H0 : ψk (fl ) = − 1, Pˆvv (fl ) ˆ where Pvv (fl ) is the expected value of the noise PSD and Pvv,k (fl ) + Pss,k (fl ) Pxx,k (fl ) is the PSD of the current frame k. The measure repH1 : ψk (fl ) = − 1, Pˆvv (fl ) resents the ratio of a PSD estimate to a long average of the noise PSD. It is therefore a represention of the signal-to-noise ratio where H0 indicates the null hypothesis where speech is not in the flth spectral bin. present, H1 represents the alternative where speech is present The expected value of the noise PSD is calculated as the sam- and Pss,k (fl ) is the PSD estimate of the speech. The distribuple mean over an initial period of non-speech activity. This is tion of the SNR during periods of noise is best estimated using found as, a Gaussian distribution given as, K−1 ! X 1 Pˆvv (fl ) = Pxx,k (fl ), (3) 1 −ψk2 (fl ) , (6) p(ψk (fl )|H0 ) = q exp K 2 (f ) k=0 2σv,k 2 (f ) l 2πσv,k l where K is the number of frames during the initial period. 2 where σv,k (fl ) is the variance of the SNR during periods of noise in the flth spectral bin. Similarly during periods of 2.1 Expected Value of SNR Measure speech, It is important to understand the behavior of the SNR measure. 1 To that end the expected value of the measure under the conp(ψk (fl )|H1 ) = q 2 (f ) + σ 2 (f )] 2π[σv,k dition that speech is absent (noise only), should be evaluated. l s,k l (7) ! During periods of noise only x = v, the SNR estimate be−ψk2 (fl ) comes, · exp , 2 (f ) + σ 2 (f )] Pvv,k (fl ) 2[σv,k l s,k l − 1, (4) ψk (fl ) = Pˆvv (fl ) 2 where σs,k (fl ) is the variance of the SNR during periods of where Pvv,k (fl ) is the PSD estimate of the noise. Taking the speech in the f th spectral bin. l expected value of equation (4), A likelihood ratio may now be determined on the basis of " # these two distributions. The likelihood ratio is defined as, Pvv,k (fl ) E[ψk (fl )] = E −1 , ∆ p(ψk (fl )|H1 ) Pˆvv (fl ) Λk (fl )= , (8) p(ψk (fl )|H0 ) 1 = E [Pvv,k (fl )] − 1, where Λk (fl ) is the likelihood ratio in the flth spectral bin. This ˆ Pvv (fl ) can now be expanded and simplified to give the following rep≈ 0. (5) resentation, s 2 (f ) Therefore the expected value of the SNR measure during periσv,k l Λk (fl ) = ods of noise is approximately zero. 2 2 (f ) σv,k (fl ) + σs,k l (9) ! 2 2 ψk (fl )σs,k (fl ) 2.2 Distribution of SNR measure · exp . 2 (f )[σ 2 (f ) + σ 2 (f )] 2σv,k l v,k l s,k l The statistical nature of the measure should also be evaluated. A statistical Bayes test may now be carried out on the basis of The distribution of the periodogram Pxx,k (f ) has been investigated on many occasions and has been found to be Chi-square the likelihood ratio. This is done by comparing the likelihood (χ2 ) distributed with two degrees of freedom [10]. Therefore ratio to a pre-determined threshold in the following way, the low variance PSD estimate Pxx,k (fl ) is made up of a sum of PH0 (CH1 H0 − CH0 H0 ) 1 · = η, (10) Λk (fl ) ≷H M χ2 random distributions with two degrees of freedom each, H0 PH1 (CH0 H1 − CH1 H1 ) 2 resulting in a χ distribution with 2M degrees of freedom. The SNR is made by scaling Pxx,k (fl ) by the constant Pˆvv (fl ) and where η is a threshold, PH0 is the probability of occurrence only, PH1 is the probability of occurrence of speech shifting the mean by -1. The SNR ψk (fl ) may thus be consid- of noise (CH1 H0 −CH0 H0 ) 2 and ered χ with 2M degrees of freedom. (CH0 H1 −CH1 H1 ) is a cost function associated with making Using the Welch method with overlapping windows, M be- each of those decisions. The values CH0 H0 and CH1 H1 reprecomes large, and thus the number of degrees of freedom be- sent the costs of making a correct decision and are commonly comes large. The distribution of ψk (fl ) thus tends toward set to zero. CH0 H1 and CH1 H0 represent the cost of making a Gaussian [11]. As such the SNR may be considered to be Gaus- miss-detection and false-alarm respectively, and should be determined on the basis of the desired system performance. sian distributed.
4 Threshold Adaptation
D = 0 D =1 D = 0
The threshold η is determined on the basis of a cost function and a-priori probabilities of speech and noise occurrence. This means that the threshold remains fixed throughout and consequently leads to limited performance. It is therefore desirable to develop an adaptive threshold that is based on meaningful parameters. Another representation of the likelihood ratio in equation (9) is the log-likelihood ratio, ! 2 σv,k (fl ) 1 log(Λk (fl )) = log 2 (f ) + σ 2 (f ) 2 σv,k l s,k l (11) 2 2 ψk (fl )σs,k (fl ) h i. + 2 (f ) σ 2 (f ) + σ 2 (f ) 2σv,k l v,k l s,k l The log-likelihood ratio is commonly used to simplify analysis. The decision problem in equation (10) is manipulated with the log-likelihood ratio to give, v h i u 2 2 (f ) + σ 2 (f ) u 2σv,k (fl ) σv,k l l s,k t H1 ψk (fl )≷H 2 (f ) 0 σs,k l v" !# (12) u 2 (f ) u σv,k l 1 t · log(η) − log , 2 (f ) + σ 2 (f ) 2 σv,k l s,k l 1 0 ≷H H0 ηk (fl ),
where ηk0 (fl ) is a new threshold determined from the speech and noise statistics. Namely the variance of the SNR during periods of speech or noise. The probability of detection, false-alarm and miss-detection can be easily found, based on the Gaussian assumption made earlier. For the false-alarm probability we find, P r(ηk0 (fl ) < ψk (fl ) < ∞|H0 ) ! Z ∞ 1 −ψk2 (fl ) q δψk (fl ). = exp 2 (f ) 2σv,k 2 (f ) l ηk0 (fl ) 2πσv,k l
VAD =1
VAD =1
D =0
D =0
VAD =1
VAD =1
D = 1
VAD =1
D =0
D = 0
D = 1
VAD =1
D = 1
D = 0
D =1 VAD =0
VAD =1
D = 1 D = 1 D = 1 D =1
D =0
VAD =1
D = 1
D =1 D = 1
VAD =1
D = 1
VAD =1
D =0 D = 0
D = 1
VAD =1 D = 0
VAD =1
D =0
VAD =1 D =0 D =0
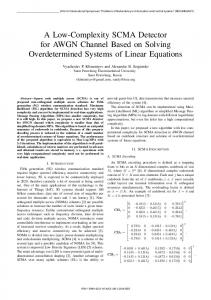
Figure 1: Hang Over Scheme State Machine. It is now clear that the threshold ηk0 (fl ) can be determined from noise statistics alone. Thus the threshold is set for each individual spectral bin depending on the noise variance in each of those bins. The probability of false-alarm PF A is fixed to a constant level and therefore the expression erf c−1 (2PF A ) is only calculated to a high degree of accuracy once. Therefore the decision is made on a statistical basis depending on the noise statistics and desired performance of the VAD. The final VAD decision is made by comparing the algebraic means of the SNR ψk (fl ) and the threshold ηk0 (fl ), L−1 L−1 1 X 1 Xq 2 −1 1 erf c (2P ) · ψk (fl ) ≷H 2σv,k (fl ). F A H0 L L fl =0
fl =0
(16) Speech is decided if the average SNR is larger than the average threshold ηk0 , otherwise noise is decided.
5 Hang Over Scheme
In a practical implementation, a hang over scheme is required to lower the probability of miss-detection [7]. The hang over scheme does this by reducing the risk of a low energy portion of speech at the end of an utterance being miss-detected, by It is clear that the threshold ηk0 (fl ) can be determined from this arbitrarily declaring a period of speech activity after a period false-alarm probability. Manipulating equation (13) we find, of speech has already being detected. This is based on the idea that speech occurrences are highly correlated with time. A hang P r(ηk0 (fl ) < ψk (fl ) < ∞|H0 ) over scheme can be implemented as a state machine and is best ! Z ∞ 2 visualized in this manner. 1 −ψk (fl ) q = δψk (fl ), exp Figure 1 shows the state machine hang over scheme as im2 2σv,k (fl ) 2 (f ) ηk0 (fl ) 2πσv,k l plemented in the VAD. The parameter D in the figure indicates � 2� Z ∞ the decision as made by testing the SNR with the threshold. D 1 −y (14) = η0 (f ) √ exp δy, is assigned 1 if the SNR is larger than or equal to the threshold 2 k l 2π σv,k (fk ) or 0 if the SNR is less than the threshold. This value is then used to determine which state the machine should be in. The 0 1 η (fl ) parameter VAD then specifies the final VAD decision. = erf c q k , 2 2 (f ) 2σv,k The hang over scheme influences the behavior of the VAD l in a two distinct ways. Firstly the scheme delays the transition where erf c(u) is the complementary error function [12]. Solv- from the noise state to the speech state. This is done in such a ing for ηk0 (fl ) we find, way that if the statistical test result D indicates speech (D = 1), then the final VAD decision is always speech. The delay q 2 (f ) · erf c−1 (2P (15) is introduced to ensure the hangover scheme does not move ηk0 (fl ) = 2σv,k l F A ), into the speech state as a result of a false-alarm. For the state where PF A is the probability of false-alarm. machine indicated in Figure 1, four consecutive false-alarms (13)
would be required to inadvertently trigger a speech state. The scheme secondly delays the transition from the speech state to the noise state. Meaning even if the statistical test indicates noise (D = 0), the VAD will not necessarily decide noise, but will begin to progress through the transition states to the noise state. This effectively delays the transition from the speech state to the noise state and results in a reduction in missdetections. The VAD is thus quick to react to a change from noise to speech, but is slow to react to a change from speech to noise. This methodology results in a simple, effective and practical implementation in either software or hardware. It has the added advantage of very low memory and computational requirements.
x x t
xk (n) Welch Method X = V?
Pxx,k (fl )
Pvv,k (fl )
0 Pxx,k (fl )
Exponential Average
hP
vv,k (fl )
ˆvv (f ) P l
Pˆvv (fl )
5.1 Final System The final implemented system is shown in Figure 2. Initially the raw data x is framed. The Welch method of overlapping sub-frames is used to estimate the reduced-variance, reducedresolution PSD, Pxx,k (fl ). A high pass filter is also applied at this point to remove undesirable low frequency components. Following that, the SNR ψk (fl ) is calculated using the noise power Pˆvv (fl ) and the current PSD estimate. The noise power is found by averaging the PSD estimate during periods of nonspeech activity as defined by an initial silence, or by the VAD’s own decisions. The current SNR ψk (fl ) is then applied to a short exponential average. The arithmetic mean is then found and compared to the threshold η 0 . The threshold η 0 is found by first calculating the variance of 2 the SNR during periods of noise. Once the variance σv,k (fl ) is obtained it is then exponentially averaged. The threshold ηk0 (fl ) is calculated according to section 4. This threshold is also exponentially averaged. The arithmetic mean is then found and compared to the SNR. After the comparison, the raw decision D is subjected to the state machine based hang over scheme as described in section 5. Finally, a decision is made.
σv2 (fl ) =
ψk (fl ) =
0 Pxx,k (fl ) ˆvv (f ) P l
−1
i2
σv2 (fl ) Exponential Average
−1
σ ˆv2 (fl ) ψk (fl ) η 0 (fl ) =
p 2ˆ σv2 (fl )erf c−1 (2PF A )
Exponential Average ˆ l) ψ(f
η 0 (fl )
ψˆ > ηˆ?
ηˆ0 (fl )
Exponential Average
D Hangover Scheme VAD
Figure 2: Implemented System Block Diagram.
6 Voice Activity Detector Evaluation VAD evaluation was carried out in a statistical manner. The VAD was tested on two speech sources, namely one male and one female speaker. The clean speech was then added to noise from the NOISEX-92 database namely, babble noise, white noise and Volvo car noise. The VAD was then tested with the noisy speech and the final decisions were recorded. These decisions were then compared on a frame-by-frame basis to a set of hand-labelled speech decisions. The results were then analyzed and the percentage of correct decisions (%C), miss-detections (%MD) and false-alarms (%FA) were all determined. The speech utterance used was made up of a portion of male speech and a portion of female speech. The sequence was 21.12 seconds long and was composed of 40.46 % silence and 59.44 % speech. The noise was added to produce noisy speech yielding a suitable average SNR. The proposed scheme’s threshold was configured with a PF A of 0.05. The ETSI AMR VAD algorithms and the ITU G.729B VAD algorithms were taken from the C implementations provided by the respective authors [13], [14]. The ETSI AMR VAD Option 2 is commonly
used as the benchmark for VAD testing. Results show the proposed scheme is either comparable or superior to all VADs in all instances. It has a consistently lower false-alarm rate and comparable correct detection rate whilst maintaining a low miss-detection rate. It is interesting to note that the false-alarm rate stays almost constant over all SNRs in all environments as compared to the other VAD algorithms that flucutate wildly depending on the environment and SNR. This is a direct consequence of the adaptive SNR that is determined from the noise statistics.
7 Conclusion A new voice activity detection method based on a statistical decision has been presented. The proposed VAD removes the need to estimate redundant features such as speech variance, incorporates a low variance spectrum estimation technique and a method for determining the adaptive threshold based on noise statistics. These innovations result in a reduced computational
Table 1: VAD Performance for various SNRs and Noise Environments Environment Noise SNR White -5dB White 0dB White 5dB White 10dB White 15dB Babble -5dB Babble 0dB Babble 5dB Babble 10dB Babble 15dB Vehicle -5dB Vehicle 0dB Vehicle 5dB Vehicle 10dB Vehicle 15dB
AMR Option 1 %C %MD %FA 92.63 7.37 40.91 96.71 3.29 21.53 97.96 2.04 25.84 97.96 2.04 25.84 98.12 1.88 30.14 89.66 10.34 76.56 97.81 2.19 72.01 99.69 0.31 85.65 99.53 0.47 61.72 99.69 0.31 57.18 100.00 0.00 22.97 100.00 0.00 13.88 100.00 0.00 15.07 100.00 0.00 22.97 100.00 0.00 22.73
AMR Option 2 %C %MD %FA 45.61 54.39 2.87 84.17 15.83 5.98 96.08 3.92 8.61 97.65 2.35 13.40 98.59 1.41 14.59 83.86 16.14 25.36 94.83 5.17 27.27 97.96 2.04 27.27 98.12 1.88 23.44 99.84 0.16 30.14 100.00 0.00 16.27 100.00 0.00 19.38 100.00 0.00 18.18 100.00 0.00 19.62 100.00 0.00 19.38
complexity when compared to similar statistical VADs whilst maintaining a high detection rate and a low error rate. A possible algorithm implementation has been outlined along with a state machine based hang over scheme. The implementation was tested and compared to current standard VAD algorithms. Evaluations indicate excellent VAD performance in white noise, vehicle noise and babble noise environments.
References [1] R. V. Prasad, A. Sangwan, and Jamadagni, “Comparison of Voice Activity Detection Algorithms for VoIP,” International Symposium on Computers and Communications, 2002.
%C 14.09 32.48 49.28 64.01 76.59 50.32 56.53 64.65 74.52 86.31 87.58 91.64 95.70 95.94 96.10
G729B %MD 85.91 67.52 50.72 35.99 23.41 49.68 43.47 35.35 25.48 13.69 12.42 8.36 4.30 4.06 3.90
%FA 15.12 15.12 15.58 16.05 16.16 34.77 31.98 31.63 30.70 29.65 31.86 21.28 21.86 28.60 25.00
Proposed Scheme %C %MD %FA 93.79 6.21 8.98 96.74 3.26 12.49 98.65 1.35 12.25 98.73 1.27 14.82 99.92 0.08 21.12 76.99 23.01 22.17 95.30 4.70 12.60 98.09 1.91 11.67 98.25 1.75 10.50 98.49 1.51 12.49 98.65 1.35 12.72 98.73 1.27 13.54 98.73 1.27 13.65 98.73 1.27 13.89 98.73 1.27 13.89
[6] F. Beritelli, S. Casale, and A. Cavallaro, “A Robust Voice Activity Detector for Wireless Communications Using Soft Computing,” IEEE Journal on Selected Areas in Communications, vol. 16, pp. 1818–1829, Dec. 1998. [7] J. Sohn, N. Kim, and W. Sung, “A statistical model-based voice activity detection,” IEEE Signal Processing Letters, vol. 6, Jan. 1999. [8] Y. D. Cho, K. Al-Naimi, and A. Kondoz, “Improved voice activity detection based on a smoothed statistical likelihood ratio,” Acoustics, Speech, and Signal Processing, 2001. Proceedings. (ICASSP ’01). 2001 IEEE International, vol. 2, pp. 737–740, May 2001. [9] Y. Ephraim and D. Malah, “Speech enhancement using a minimum mean-square error short-time spectral amplitude estimator,” IEEE Transactions on Acoustics, Speech and Signal Processing, vol. 32, Dec. 1984.
[2] ETSI, GSM 06.71: Digital cellular telecommunications series (Phase 2+); Advanced Multi-Rate (AMR); Speech Processing Functions; General Description. European [10] A. Leon-Garcia, Probability and random processes for Telecommunications Standards Institute, 1998. electrical engineering. New York: Addison-Wesley, 1994. [3] F. Beritelli, S. Casale, and G. Ruggeri, “Performance evaluation and comparison of ITU-T/ETSI Voice Activty De- [11] S. Kay, Fundamentals of Statistical Signal Processing: Detection Theory. New-Jersey: Prentice Hall, 1998. tectors,” International Conference on Acoustics, Speech and Signal Processing, 2001. [12] S. Haykin, Communications Systems. John Wiley and Sons, 3 ed., 1994. [4] ETSI, GSM 06.94: Digital cellular telecommunications system (Phase 2+); Voice Activity Detector (VAD) for [13] ETSI, Digital cellular telecommunications system (Phase Adaptive Multi-Rate (AMR) speech traffic channels; 2+); Adaptive Multi Rate (AMR) speech; ANSI-C code General Description. European Telecommunications for AMR speech codec. European Telecommunications Standards Institute, 1999. Standards Institute, 1998. [5] ITU, Coding of speech at 8kbit/s using conjugate structure algebraic-code-excited linear-prediction (CSACELP) Annex B: A silence compression scheme for G.729 optimised for terminals conforming to Recommendation v.70. International Telecommunication Union, 1996.
[14] ITU-T, Coding of speech at 8kbit/s using Conjugate Structure Algebraic Code - Excited Linear Prediction. Annex I: Reference fixed-point implentation for integrating G.729 CS-ACELP speech codig main body with Annexes B,D and E. International Telecommunication Union, 2000.