Apr 17, 2012 - by AJAX and other dynamic scripting features do influence the outcome of Web ... al [8] and assess some of the Web characteristics examined.
A macroscopic Web accessibility evaluation at different processing phases Nádia Fernandes, Luís Carriço LaSIGE/University of Lisbon Campo Grande, Edifício C6 1749-016 Lisboa, Portugal
{nadiaf,lmc}@di.fc.ul.pt ABSTRACT
In fact, the Web is used by people with diverse pro�les
This paper details a comparative experimental study to understand the di�erence of the Web's accessibility properties regarding two di�erent evaluation approaches: using WCAG 2.0 techniques and targeting the pages as they reach the browser; using WCAG 2.0, but evaluating the pages after the browser processing, thus as they will be delivered to the end-user. For that, we evaluated over 20000 Web pages using already established accessibility metrics. We then compared the results obtained from the WCAG 2.0 evaluation of the two processing phases. We observed some changes in the macroscopic properties of the evaluation. Regarding the comparison between the two phases, we observed a narrower distribution of quality, i.e., the worst pages are in fact not that bad, and the best ones not that good.
Categories and Subject Descriptors
and characteristics, with miscellaneous capabilities, including those with special needs. Thus, Web sites/pages should be designed so that information can be perceived by everyone, i.e., should be accessible. This way, it is important to guarantee that Web content is accessible for as many possible users, no matter their disabilities, and for that it is important that the evaluations are performed in the content that users use and perceive. A framework [5] was proposed for the evaluation of Web pages, using WCAG 2.0 [4], at two di�erent processing phases: before and after Web Browser processing.
The �rst cor-
responds to the typical context for automated evaluation, which works on the result of the �rst HTTP request. The second is the context where users interact with the Web, after loading the initial scripts. It was been proved
[5] that the di�erences introduced
by AJAX and other dynamic scripting features do in�uence
H.4 [Information Systems Applications]: Miscellaneous;
the outcome of Web accessibility evaluation practices. The
D.2.8 [Software Engineering]: Metrics�complexity mea-
results of the automated Web accessibility evaluation before
sures, performance measures
processing yield incorrect and incomplete results.
General Terms
ences between these two processing phases. We extend the
In this paper, we perform a deeper analysis of the di�ersample to over 20000 Web pages thus reaching a macroscopic
Measurement, Human Factors.
analysis. Moreover, we use the metrics proposed by Lopes et al [8] and assess some of the Web characteristics examined
Keywords
by that study, now in light of WCAG 2.0 techniques [3], and
Web accessibility, Web science, Web browser processing, Automated evaluation.
1.
2.
INTRODUCTION
RELATED WORK
Web accessibility evaluation (WAE) is an assessment pro-
The Web has became a universal platform and is constantly growing in size and complexity.
particularly at the after browsing processing phase.
It is increasingly
in our everyday life, being now progressively indispensable for almost all our activities (i.e. public, business, personal e�ciency or improvement of subsistent) [2]. Accessing the Web is nowadays such an important asset that is considered as a fundamental right.
cedure to analyse how well the Web can be used by people with di�erent levels of disabilities [7]. Unfortunately, current studies show that many Web sites still cannot be accessed in the same conditions, by a large number of people [7, 9]. WCAG is one of the most used technical standards for accessibility evaluations, encouraging creators (e.g., designers, developers) in constructing Web pages according to a set of best practices. If this happens, a good level of accessibility can be guaranteed [7, 9].
Although these guidelines exist
and are supposed to be followed by the creators, most Web
Permission to make digital or hard copies of all or part of this work for personal or classroom use is granted without fee provided that copies are not made or distributed for profit or commercial advantage and that copies bear this notice and the full citation on the first page. To copy otherwise, to republish, to post on servers or to redistribute to lists, requires prior specific permission and/or a fee. W4A2012 - Communication, 16-17th April 2012 - Lyon, France. Copyright 2012 ACM 978-1-4503-1019-2 ...$5.00.
sites still have accessibility barriers making its utilization very di�cult or even impossible for many users [7]. Thus, WCAG can also be used as a benchmark for analysing the accessibility quality of a given Web page. The results of an accessibility evaluation can be used to measure quantitatively the level of accessibility of a Web page. Furthermore, metrics are important to facilitate un-
derstanding, controlling, and improving products and pro-
The results of the evaluation are presented in terms of
cesses in software development [6]. Additionally, in terms of
PASS, WARN and FAIL: pass or fail, if the elements veri-
accessibility metrics can also help the user to understand if
�ed by the techniques are in agreement or disagreement with
a Web page/site can be used by them.
the W3C recommendations for the techniques, respectively;
2.1
and warning � if it is not possible to identify certain char-
Automatic Evaluation
acteristic of an element as right or wrong, without the need
Automatic evaluation is performed by software, without
of an expert intervention.
the need of direct human intervention, and with expertise
We used the metrics already applied in Lopes et al [8],
embedded in a software framework/tool. The major bene�ts
namely: conservative rate, optimistic rate and strict rate.
are scalability and objectivity [9].
However, it has limita-
Each is normalized into a percentage, where the results are
tions that direct or users evaluations do not have (e.g., the
between accessible (100%) and not accessible (0%). These
depth and completeness of analysis).
metrics use the PASS, WARN and FAIL as follows:
However, the auto-
matic version of the evaluation allows to perform analysis
Conservative rate - The worst-case scenario on accessi-
with bigger sets of Web pages, enabling large-scale stud-
bility evaluation (WARN results are interpreted as failure):
ies, like [8] for example. That study in particular revealed rateconservative
several macroscopic properties of web accessibility, with an evaluation using WCAG 1.0 checkpoints.
=
passed applicable
(1)
Traditionally, automated evaluations has been performed
Optimistic rate - A best-case scenario where warnings
with source documents that are returned on the �rst HTTP
are dismissed as accessibility issues that were taken into ac-
request.
count (WARN results are interpreted as passed):
However, nowadays, Web pages are mostly dy-
namic, the content presented to the user is often very different from what is obtained in that request.
It has been
rateoptimistic
=
showed that the di�erences of assessed elements, fails, warnings and passes between the evaluations done before and after browser processing are statistically signi�cant [5]. Con-
Strict rate - WARN results are dismissed (thus account-
on the material that is assessed, targeting the rendered or
ratestrict
transformed HTML.
4.
EXPERIMENTAL STUDY
(2)
ing only the actual FAIL results):
sequently, it is paramount that the WAE tools also evolve
3.
passed + warnings applicable
=
passed applicable − warnings
(3)
RESULTS
The evaluation of the Web documents collection yield re-
To perform the accessibility evaluation, we used the Qual-
sults for 24,462 Web pages. Our evaluation yielded di�er-
Web evaluation framework [1], but we simulated the process-
ences in the HTML documents, in terms of the number of
ing of the Web browser using Phantom.js .
HTML elements for each of the analysed phases. Before pro-
1
Phantom.js is a command-line tool that uses WebKit [10],
cessing the pages contained 24,918,720 elements, whereas af-
it works like a WebKit-based web browser. Besides, it can be
ter processing the number of elements raised to 41,967,072.
controlled using Javascript, being consistent with our imple-
This corresponds to a growth of approximate 68%.
mentation.
look at the average size of a page in terms of number of ele-
Moreover, it o�ers mechanisms to access both
processing phases.
We now issue only one request to get
the evaluation target, the Web page, and use two di�erent functions to simulate both processing phases.
If we
ments, the increase from 1010 to 1710 corresponds to a 69% growth. We focused our study in two main sets of results: �rst,
This solution solves all the issues discovered in the pre-
the di�erence of evaluation outcomes (fail, pass, warning )
vious work [1]: 1) it avoids data injection at the browser
between the two phases; and second, the di�erences of dis-
level; 2) it guarantees that the evaluated Web page before
tribution of the rates mentioned between evaluations.
and after browser processing is exactly the same; and 3) it enables the integration of the evaluation framework with a crawler to perform intensive simulation.
4.1
Evaluation Outcomes
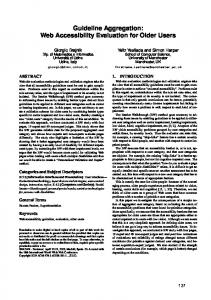
In Figure 1, we present the three evaluation outcomes, for
After that, we performed an experimental study that aims
each of the phase, as de�ned above:
at understanding the impact of the delivery processing phase, and of the usage of WCAG 2.0 on the accessibility charac-
•
Pass : An average of approximately 9 elements passes
teristics of the Web, as they emerge from a large-scale study.
their respective evaluation criteria before browser pro-
We formulate the following research question:
cessing.
This number highly increases after browser
processing, to an average of 87 elements, a growth of How do the macroscopic properties emerging from
approximately 867%;
Web accessibility change in respect to the process-
•
ing phase of delivery?
Fail :
An average of approximately 46 elements fails
their respective evaluation criteria before browser proWe used some Web pages from the Web sites provided by the Portuguese Web Archive (PWA)
2
cessing. After browser processing, this number rises to
(version of 2008),
an average of approximately 176 elements, an increase
and 18 HTML WCAG 2.0 techniques already implemented in [5].
1 http://www.phantomjs.org/ 2 http://www.fccn.pt/
of approximately 282%;
•
Warning : An average of approximately 262 elements
had warnings in their respective evaluation criteria before browser processing, a rise of approximately 72%.
worse and the worst accessibility quality values get better. Thus, we can conclude that Web pages can possess higher uniformity. We believe the reason for that emerges from the usage of templates and particularly, reusable code, such as libraries. Considering that the number of elements increases between before and after processing for each page, and that the accessibility rates get more uniform, then the browser processing phase must introduce more uniformly code with a medium accessibility rate, i.e., not that bad and not that good. If some of that that code is reused than the uniformity of results would occur. This observation concurs with the argument that the usage of templates and libraries will
Figure 1: Average of outcome per page between evaluations.
improve the accessibility of the Web, provided that they are accessible. Of course our results only con�rmed uniformity. The goal is that since reusable code is usually done by non-novice programmers and designers then the novices' ac-
It is interesting to notice that the biggest relative growth
cessibility mistakes will be minimized. Moreover, the acces-
occurs for the elements that pass the criteria, amounting to 3
sibility quality of templates/libraries will certainly improve,
times the increase of fails and 12 times the one for warnings.
with frequent revisions of the reused material, as well as with
In the following sections, we detail the di�erences arising from the comparison of the application of rates already mentioned.
4.2
the improvement of the designers' accessibility expertise. The aforementioned arguments answer the research question, showing the di�erences on the macroscopic properties
Rates Before and After Processing
For the comparison of rate values between the evaluation
of web accessibility between evaluation settings. They also stresses the advantages of using WCAG 2.0 and of performing accessibility evaluation after browser processing.
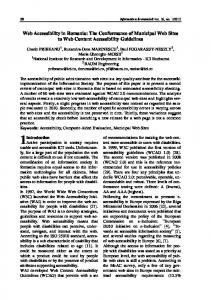
before and after browser processing we will present in detail the results for each of the rates. Figures 2, 3 and 4 present the distributions of before processing and after processing for conservative rate, optimistic rate and strict rate, respectively.
For the conservative rate is clear (Figure 2), that the average quality assessed increases in the after processing. We can also notice that the majority of the results with quality between 60% and 90% disappeared in after processing. For the conservative rate (Figure 3), the average quality assessed decreases in the after processing, from approximately 80% to around 70%. We can observe that there is a decrease of the number of pages that have accessibility quality lower than 20%.
Thus worst pages tend to be as-
sessed with higher quality after processing. There is also a decrease on the number of pages with higher accessibility quality, leading to a lower accessibility average. For the strict rate (Figure 4), the average is approximately 0.11 before processing and after processing is approximately 0.35. However, it can be seen that the majority of the results higher than 85% disappeared in after processing. Generally the trend is similar to the other rates: worst pages before processing get higher scores in after processing evaluation and better pages are ranked lower.
5.
DISCUSSION Our study addresses aspects related with emerging macro-
scopic properties deriving from Web accessibility evaluation, exploring the perceived di�erences on those properties depending on the browser processing phase, i.e., before or after browser processing.
5.1
Impact on Designing Accessible Web Pages
The results of the experiment can also be used to improve the design of accessibility Web pages. We can conclude that Web pages which reuse code tend to have not as bad (or relatively better) accessibility quality, so it can be positive to use libraries or templates. However, it is important that developers/designers with expertise in accessibility design those templates/libraries, to ensure their correction. Additionally, to capitalize the corrections of the templates/libraries is important to share reusable code. This way, the accessibility problems are being discovered and corrected by the multiple users.
5.2
Impact on the Perception of Accessibility
The current study allowed us to detect di�erences between rates. This might indicate that using WCAG 2.0 evaluator may provide a better perception of accessibility problems, which may lead to the creation of Web pages with better accessible quality. Regarding the processing phases, the impact in perception is also relevant. Considering that users interact with Web pages after processing, it is important that evaluations assess that phase, especially because results are di�erent, as this study shows.
Note that these results, and thus the users'
perception of accessibility will tend to be more pronounced as the Web evolves towards dynamic content and HTML 5.
5.3
Limitations of the Experiment
Our experiment has faced some limitations on the type of results that can be extrapolated, including:
Regarding the di�erences between processing phases, the results obtained for this experimental study con�rm and em-
•
Techniques coverage:
we used the 18 HTML WCAG
phasize, considering the scale, the previous results of [5].
2.0 implemented techniques of QualWeb (correspond-
This rea�rms that evaluation should be done after browser
ing to 15 success criteria). However, it would be impor-
processing.
tant to have CSS techniques implemented and adopt
When looking at accessibility distribution after processing, we can verify that the best accessibility quality values get
new emerging techniques that will, for sure, emerge from the conformance to HTML 5 new features;
Figure 2: Box-plot comparing conrate before and after browser processing.
servative
•
Figure 3: Box-plot comparing optimistic rate before and after browser processing.
Dynamic content: to be able to pick the dynamic trig-
ger action in the browser processing;
Figure 4: Box-plot comparing strict rate before and after browser processing.
[2] R. Baguma and J. T. Lubega. A web design framework for improved accessibility for people with disabilities (wdfad). In Proceedings of the 2008
•
Automated evaluation: since this experiment is centred
international cross-disciplinary conference on Web
on automated evaluation of Web accessibility quality,
accessibility (W4A), W4A '08, pages 134�140, New
it shares all of the inherent pitfalls.
York, NY, USA, 2008. ACM. [3] M. Cooper, G. Loretta Reid, G. Vanderheiden, and
6.
CONCLUSIONS AND FUTURE WORK This article presented a large-scale study of accessibility
on the Web, using a Web document collection from 2008, collected from the Portuguese Web Archive (PWA). The results allowed us to characterize some accessibility properties of the Web, pointing some di�erences: between the common way of assessing Web pages -, before browser processing,- and a recent proposal of assessment -, after browser processing and closer to what the end-users perceive. The results obtained on the evaluation of pages after browser processing tend to be more homogeneous than before, i.e., bad pages tend to be assessed as better and good pages are actually worse. De�nitely, there is a di�erence between what is available before and after processing. Considering that the end-user interacts with the �after processed pages� then most studies about Web quality should be redone. Facing with the obtained results, on-going work is being conducted in the following directions: 1. Enlarge the coverage of WCAG 2.0 implemented tests, in particular considering the analysis of CSS;
B. Caldwell. Techniques for WCAG 2.0 - Techniques and Failures for Web Content Accessibility Guidelines 2.0. W3C Note, World Wide Web Consortium (W3C), October 2010. Last accessed on November 26th, 2010, from
http://www.w3.org/TR/WCAG-TECHS/.
[4] M. Cooper, L. G. Reid, G. Vanderheiden, and B. Caldwell. Techniques for WCAG 2.0 - Techniques and Failures for Web Content Accessibility Guidelines 2.0. W3C Note, World Wide Web Consortium (W3C), October 2010. Last accessed on November 26th, 2010, from
http://www.w3.org/TR/WCAG-TECHS/.
[5] N. Fernandes, R. Lopes, and L. Carriço. On web accessibility evaluation environments. In W4A '11: Proceedings of the 2009 International Cross-Disciplinary Conference on Web Accessibililty (W4A), New York, NY, USA, 2011. ACM.
[6] A. P. Freire, R. P. M. Fortes, M. A. S. Turine, and D. M. B. Paiva. An evaluation of web accessibility metrics based on their attributes. In Proceedings of the 26th annual ACM international conference on Design of communication, SIGDOC '08, pages 73�80, New
York, NY, USA, 2008. ACM. 2. Evaluate Web applications, considering that they are conquering the Web;
[7] S. Harper and Y. Yesilada. Web Accessibility. Springer, London, United Kingdom, 2008. [8] R. Lopes and L. Carriço. Macroscopic
3. Perform a comparative set of studies that relate the evolution of accessibility in PWA for recent years.
characterisations of web accessibility. New Review of Hypermedia and Multimedia, 2010.
[9] R. Lopes, K. V. Isacker, and L. Carriço. Rede�ning
7.
ACKNOWLEDGMENTS
This work was funded by Fundação para a Ciência e Tecnologia (FCT) through the QualWeb national research project PTDC/EIA-EIA/105079/2008, the Multiannual Funding Programme, and POSC/EU.
8.
REFERENCES
[1] Omitted for blind review purposes.
assumptions: Accessibility and its stakeholders. In The 12th International Conference on Computers Helping People with Special Needs (ICCHP). Springer, 2010.
[10] Webkit. The webkit open source project, 2011. Available from: http://www.webkit.org/.