A Measurement-Based Approach to Modeling Link Capacity in 802.11-Based Wireless Networks Anand Kashyap
Samrat Ganguly
Samir R. Das
Computer Science Dept. Stony Brook University Stony Brook, NY, USA
NEC Laboratories America Princeton, NJ, USA
Computer Science Dept. Stony Brook University Stony Brook, NY, USA
[email protected]
[email protected]
[email protected]
ABSTRACT We present a practical, measurement-based model that captures the effect of interference in 802.11-based wireless LAN or mesh networks. The goal is to model capacity of any given link in the presence of any given number of interferers in a deployed network, carrying any specified amount of offered load. Central to our modeling approach is a MAC-layer model for 802.11 that is fed by PHY-layer models for deferral and packet capture behaviors, which in turn are profiled based on measurements. The target network to be evaluated needs only O(N ) measurement steps to gather metrics for individual links that seed the models. We provide two solution approaches – one based on direct simulation (slow, but accurate) and the other based on analytical methods (faster, but approximate). We present elaborate validation results for a 12 node 802.11b mesh network using upto 5 interfering transmissions. We demonstrate, using as comparison points three simpler modeling approaches, that the accuracy of our approach is much better, predicting link capacities with errors within 10% of the base channel datarate for about 90% of the cases.
Categories and Subject Descriptors C.4 [Performance of Systems]: Measurement techniques, Modeling techniques; C.2.1 [Network Architecture and Design]: Wireless communication.
General Terms Experimentation, Measurement.
Keywords Wireless network capacity, wireless interference, 802.11.
1.
INTRODUCTION
Practical models for predicting the wireless link capacity are crucial to an efficient operation and deployment of wireless network. The performance of network protocols
Permission to make digital or hard copies of all or part of this work for personal or classroom use is granted without fee provided that copies are not made or distributed for profit or commercial advantage and that copies bear this notice and the full citation on the first page. To copy otherwise, to republish, to post on servers or to redistribute to lists, requires prior specific permission and/or a fee. MobiCom’07, September 9–14, 2007, Montréal, Québec, Canada. Copyright 2007 ACM 978-1-59593-681-3/07/0009 ...$5.00.
Figure 1: Example of problem. and algorithms such as QoS routing, load balancing, admission control and channel assignment can be significantly improved with an accurate model of link capacity. Capacity models are also required as analysis tools to efficiently explore a gamut of network configurations and traffic load scenarios for performance evaluation. Recently, the proliferation of 802.11 based wireless LAN and mesh networks has lead to several research efforts focussing on predicting the capacity of an 802.11-specific wireless link [19, 20]. What makes the accurate estimation of 802.11 link capacity an inherently challenging task is that the link capacity is an ensemble effect of physical layer behavior, complex CSMA-based MAC layer interaction, and interference effect from multiple active sources. The objective of our work is to characterize and model the impact of interference caused by active traffic from multiple surrounding nodes on the link capacity. For example, referring to Figure 1, consider a set of active links (CA, BD and EF) with specified amounts of offered traffic loads (in Mbps, for example). Our goal is to create a model that can predict the throughput capacity of any given link (e.g., BC or AB), i.e., the maximum amount of traffic (in Mbps) that the link can carry. Unlike the plethora of modeling work in existing literature [5, 11, 17] that uses purely analytical approaches, our end goal is to estimate link capacities in a real deployed network. Characterizing the impact of interference: Interference impacts the sender by reducing its maximum sending rate as determined by the CSMA based 802.11 MAC layer interaction. Interference also impacts the receiver by reducing the probability of successful packet reception by causing collisions at the receiver. The specifics of the MAC protocol (e.g., random backoff) as well as implementation-specific physical layer components such as carrier sense threshold (i.e., what received power must be sensed to decide that the medium is busy) and packet capture threshold (i.e., threshold of signal-to-noise-plus-interference ratio to be able to receive a packet successfully) are other factors which affect the interference-limited capacity of a wireless link.
Existing models for single-hop [5, 17] and multi-hop [11] 802.11 networks suffer from the limitation that they are based on the assumption of idealized channel condition where each link is lossless. They also assume that interference is ‘pairwise’ (i.e., happens between node or link pairs only) and ‘binary’ (i.e., interference is either present or absent). The popularly used protocol model of interference [12] is an example of such interference modeling. However, recent measurement studies [19, 9, 21] have shown that interference is neither pairwise or binary. The effect of multiple interferers and effect of realistic channel and interface behavior must be accounted for accurate modeling. Measurement-based capacity model: Evidently, a model built on actual measurement of appropriate metrics can avoid the unrealistic assumptions. However, such models must be of a reasonable measurement complexity to be practical and must also be robust to potentially changing operating conditions. To that end, a recent model based on measuring just signal strengths between node pairs has been proposed by Reis et al. [20] to predict capacity of a link. Their model however is described for the case of single interferer and does not address the general and realistic case where the effect of simultaneous multiple interferers on link capacity must be considered. The case for multiple interferers is challenging because of the following reasons. The model has to consider every possible combination of interfering transmitters, because any number of them could be transmitting at a time. The model also has to capture the effect of any possible traffic load scenarios at the interferers. Main contributions: The contributions in our work are as follows. i. We develop a general framework for modeling 802.11 networks (Sections 3 and 4). This presents a novel “coupled” approach, where a MAC-layer model uses a measurement-based PHY-layer model and seeds it using measurements from the target network. These measurements consist of easily measurable link metrics and can be done in O(N ) steps for an N node network. ii. We develop a tractable analytical solution approach for the model (Sections 5 and 6), that – while approximate relative to direct simulations – presents an excellent tradeoff for speed and accuracy. We show how this approach is able to estimate the throughput capacity of a given link with any number of interferers with given traffic loads. iii. We provide extensive validations using direct measurements from the testbed (Section 8). Our validation results show, for example, that the model is able to predict the link capacity for over 90% of cases within an error less than 10% of the channel bitrate. We present validation results up to 5 interferers providing a very complete study. iv. We also demonstrate why modeling approaches like ours is important. Existing algorithmic and analytical work uses very simple and unrealistic capacity models for evaluation. We pick three such models and show that such models often fare very poorly in estimating link capacities in real networks relative to our approach (Section 8.2.1).
2. RELATED WORK The capacity of a wireless link depends upon the quality of the link and the amount of interference. Several measurement studies [8, 4, 16, 6] have been done in literature to study the link quality in 802.11-based wireless networks. Similarly, several works have looked at the issue of interference in such networks in addition to link quality [14, 9, 19, 20, 7]. In [14], authors investigated the impact of carrier sensing. In [7], the authors developed a model for the physical layer capture. In [19], Padhye et al. developed a measurement-based methodology to characterize link interference in 802.11 networks. They pointed out that interference between links is not “binary” in practice unlike assumed in many analytical work that use simple graph-based conflict models. In [9], the authors showed that pairwise interference modeling is often not accurate and multiple interferers must be accounted for. The work by Reis et al. [20] is the most related to our current work. They proposed a model to use the measured signal strength between pair of nodes, thus requiring only O(N ) experiments, to characterize link quality as well as to create a physical layer model for deferral and collision. The model, though useful for a single interferer case, is not trivially extensible to multiple interferer scenarios. Our approach is similar to that of [20] in terms of measurement complexity. However, the main focus of our work is to develop a very general model that captures the effect of multiple interferers and any loading scenario for the interferers. There have been several studies in characterizing and evaluating the capacity of wireless networks using analytical modeling. The capacity in this context is the network capacity for multihop flows. Prominent examples include asymptotic capacity modeling in [12] and capacity modeling using concepts from network flow maximization in [13, 18]. They all use various abstract link interference models – from pairwise models, such as protocol model, to more general models, such as physical interference model, based on SINR (signal to interference plus noise ratio). Typically, simple path loss models are assumed for RF propagation. Even with the most realistic models, instantiating such models in a real network is hard without actual measurements, as models come with several unknown parameters. The papers in this category are interested in performance bounds and typically do not use any MAC protocol model except slotted TDMA scheduling. Finally, several papers have considered analytical modeling of 802.11 MAC protocol in multihop context to determine throughput and fairness characteristics. For example, Garetto et al. [11] extended Bianchi’s single hop analytical model [5] to a multi-hop 802.11 network to derive the perflow throughput in a multi-hop network. Gao et al. [10] have proposed another analytical model to determine the end-to-end throughput capacity of a path carrying a flow in a multi-hop 802.11 network. However, all these works still use simple pairwise (or protocol) model of interference. The advantage of using such pairwise model is that a node that is not an interferer in isolation cannot become an interferer in conjunction with other nodes. However, in SINR-based physical interference model, this is a possibility. Our work is complementary to many of these analytical approaches as it provides a vehicle to characterize interference modeling via real measurements. A fresh modeling approach is needed to enable use of real measurements due to
Target Network
Profiling (one time) Measurement (Sec 8.1,8.2)
MAC model (Sec 4)
Model for capture
Model for deferral
Sender-side model
Solution for capacity (Sec 5,6) Validation of solutions (Sec 8.2)
Receiver-side model
Simulation
Analytical
Direct capacity measurements
PHY model (Sec 4,5)
RSS measurements
Validation
Figure 2: Overview of the modeling approach. the requirement that we handle SINR-based physical interference unlike the above analytical approaches.
3.
MODELING APPROACH
In this section, we formally present the problem we are addressing, and present our approach towards solving it.
3.1 Problem Formulation We are interested in determining the capacity of a specific link in a 802.11 network given the offered load on a set of other links. More formally, assume an N node network with all nodes in the same channel and using the same PHY-layer bit rate. Assume a subnetwork with n + 1 nodes consisting of a set of n transmitters, Z = {z1 . . . zn }, and a receiver, x. We are interested in evaluating the throughput capacity of the link from one of the transmitters (say, zi ) to the receiver x. In this case, zi acts as sender and all nodes in Z − {zi } act as interferers. All other nodes in the network outside the subnetwork above are assumed silent. We will use the sender notation Creceiver (set of interferers) to designate throughput capacity of the link. Thus, we are interested in determining the throughput capacity, Cxzi (Z − {zi }), of the link zi to x, given the offered load li on each transmitter in Z. The capacity of an 802.11 wireless link depends on the following factors – (i) channel quality that determines the bit error rate for a given PHY-layer bit rate (governed by modulation used); this translates to packet loss rate from the point of view of an upper layer protocol; (ii) interference from other transmissions in the network that influences how the 802.11 MAC protocol behaves at the sender side and whether packet collisions occur at the receiver side. Our goal is to develop a measurement based model that captures the “time averaged” behavior of the physical and MAC layers in 802.11, and thereby predicts the throughput capacity of a wireless link in presence of any number of interferers and with any given traffic load matrix. Note that given the time varying nature of wireless channels, “instantaneous” behaviors are very hard to model using measurement based approaches.
3.2 Overview of Approach A high level block diagram of our approach is shown in Figure 2 with pointers to sections where different parts are described in this paper. The centerpiece is a MAC-layer model of 802.11 that is fed by a PHY-layer model. The PHY layer model models two behaviors that MAC depends on: (i)
deferral, whether enough interference power is received to indicate carrier busy, (ii) packet capture, whether the SINR is high enough such that packet is received correctly. These dependencies are modeled via measurements in a one-time profiling experiment. The profiling is done for each interface card model or type, and can be reused. These models are seeded by link-wise measurement of RSS (received signal strength) values in the target wireless LAN or mesh network. The RSS values can be measured by having each node taking turn and sending a set of broadcast packets. For a given broadcasting sender, rest of the nodes record RSS. For an N node network, the measurement requires O(N ) measurement steps and provides the metrics for all the N (N − 1) links. This seeding now makes the MAC-layer model amenable to numeric solution. The solution evaluates how long the model stays in appropriate states that contribute to capacity. We propose two solution approaches - (a) analytical method and (b) simulation. The analytical method (Section 5) translates the model to a set of coupled equations that are solved using numerical methods. The method uses certain (reasonable) assumptions to make it analytically tractable, which also makes the solutions approximate. Simulation, on the other hand, accurately follows the MAC-layer model (described in Section 4), but results in much slower computation. We will demonstrate this further in the evaluation section in Section 8. We validate the entire approach by comparing the link capacities estimated via this modeling approach with direct measurements on the target mesh network testbed. Note that the dotted blocks in Figure 2 are not needed for capacity evaluation in a deployed network. The profiling is to be done one time only and should be available as a library for different interface card models. The validation step is also not necessary. It is used only to demonstrate the power of our approach in this paper and also for comparison with other approaches of estimating link capacities.
4. MODELING 802.11 BEHAVIOR We begin by stating an assumption that we have made in most of the paper for modeling convenience. We assume that 802.11 is using only broadcasts, i.e., implementing unicast using broadcasts. Broadcast does not have link-layer ACKs, and exponential backoffs. This simplifies the model to some extent. It has also been shown that interference between links carrying unicast traffic can be well predicted by the amount of interference computed when they carry broadcast traffic [19, 20]. Note that we are merely using this simplification for brevity. The modeling approach is general and can be extended to unicasts, as will be shown in Section 7.2. We present the behavior of 802.11 MAC protocol from the point of view of a single node as a discrete time Markov chain (see Figure 3). For this we discretize time, albeit somewhat artificially, into slots. These slots are different from 802.11 slots. The size of the slots is chosen such that they are small enough that the protocol state does not change within a slot, and the duration of any protocol state has only integer number of slots. There are five possible states – IDLE, DIFS, BACKOFF, DEFER or XMIT. Each of these states consists of many sub-states denoting the number of slots they span. We need multiple sub-states because the sub-states are not independent of each other. When the node is not attempting any
IDLE l
1-l
p DIFS(s-1)
1-p
p DIFS(s-2)
1-p
p DIFS(s-3)
1-p
1-p
DIFS(0)
p
BACKOFF(k-1)
p
1-p
1-p
BACKOFF(k-2)
p
DEFER(k-1)
1-p
1-p
p
DEFER(k-2)
1-p
BACKOFF(0)
p
DEFER(k-3)
p
p
1-p
BACKOFF(k-3)
1-p
DEFER(0)
p
p 1-p
XMIT(m-1)
1
XMIT(m-2)
1
1
XMIT(m-3)
l
XMIT(0)
1-l
Figure 3: State transition diagram for 802.11 on the sender-side. transmission, it is in the IDLE state. When in IDLE state, in every slot the node checks if it has any packet to transmit. This depends on the offered load li for the node zi , and represents the probability to begin packet transmission. When traffic is backlogged, a node never enters the IDLE state. When, the node has a packet to transmit, it moves to the DIFS state (this is an inter-frame spacing defined in the protocol standard), which has s sub-states, where s is the number of slots a node has to be in DIFS state. If the node senses the channel busy during this period, it goes back to the beginning of DIFS, i.e., DIF S(s − 1). The probability of channel being busy is given as p, also called the probability of deferral. This probability is a PHY-layer aspect and depends on the aggregate power from other nodes reaching this node. This in turn depends on the current state of the other nodes. After successful completion of the DIFS period, i.e., upon reaching DIF S(0), the node chooses a random BACKOFF period, spanning k slots, where 0 < k < CWmin , and moves to the sub-state BACKOF F (k − 1). It then counts down the BACKOFF timer, and thus progressing from one BACKOFF sub-state to the other, but only if the channel is sensed idle. If the channel is sensed busy (again with probability p), the node goes into the DEFER state, where it freezes the BACKOFF timer. It remains in the DEFER state as long as the channel is busy. The node goes back to the BACKOFF state with the probability of the channel being idle (probability 1 − p). Having counted down the BACKOFF timer to 0, the node starts transmitting the packet. This brings it to the XMIT state. Assume that the XMIT state stays for m slots depending on the PHY-layer bit rate and packet size. After completing the packet transmission, the node goes back to IDLE state if there is no other packet to transmit, or prepares for the next transmission with another DIFS. One key approximation made in this model is that the deferral probability p is assumed to be constant during the evolution of the Markov process.1 This probability depends 1 Note similar approximations are used in popular models of 802.11 albeit in a different context, e.g., in [5].
on the activity of the other nodes. Thus, the state transitions of other nodes are closely coupled. When we solve this model using a direct simulation (i.e., simulating the Markov chain) we do not make such constant p assumption and use the value p as computed at that slot. When we solve the chain using the analytical approach in the following section, p is the “average” deferral probability. This averaging works due to an inherent approximation used in the analytical solution approach to be described momentarily. So far we have described only the transmitter side. On the receive side, the model is simpler. A node not in XMIT state can receive a complete packet slot by slot, assuming it receives it error-free in each slot. The probability of errorfree reception of a complete packet (packet capture probablity) depends on the bit-error rate (BER) in the PHY-layer which in turn depends on the SINR (signal to interference plus noise ratio). Ignoring error correction coding, the probability of packet capture is (1−BER)b , where b is the packet size in bits. Thus, packet capture probability depends on SINR. Both probabilities for deferral and packet capture are functions of one or more powers (signal, interference and noise). They are input to the model. We will determine these functions via profiling experiments and seed them by power measurements in the target network.
5. ANALYTICAL APPROACH Due to the coupling of the Markov chains of individual nodes as mentioned before, solving an equivalent Markov chain for the network as a whole is computationally hard. This is because of a state-space explosion, as all possible combinations of states for all nodes can be a potential state in the combined Markov chain. Direct simulation of the Markov chain is of course viable, and we will indeed use simulation as our one solution approach. However, as we will see later in our evaluation, simulations are slow. In this section, we develop an alternative solution approach using analytical modeling. The analytical approach makes an approximation that the current state of the process does not depend on the previous state. This is similar to the approximation made in [11] for modeling tractability. With this approximation, the process can move to any of the above five states (ignoring sub-states for now) based on a constant probability at the end of a slot. These probabilities depend only on the average behavior of network nodes. Much of the work in the modeling here is formulating these probabilities. Once formulated, one can write up the steady state equations, one for each of the n transmitters, and then solve these equations to derive the fraction of time a node is in the XMIT state, thus giving the transmission capacity of this node. On the receiver side, the approach is similar. Instead of bit-error rate, packet capture probability is used directly. This again depends on the activities of other nodes. Any receiver x in a slot receives correctly a packet on the air (only one slot worth) from a designated sender zi with this probability. This contributes to the throughput capacity of the link from zi to x. Going forward, we start by assuming a saturated traffic regime. This means that all transmitters are always backlogged. This saturated traffic assumption is useful as it eliminates traffic load from the model and eliminates the IDLE state. We will later show in Section 7.1 that the analyt-
ical approach is easily amenable to consideration of nonsaturated traffic.
5.1 Baseline Notations Consider an observation interval of Γ slots, where Γ → ∞. In each slot, a subset of the n transmitters in Z = {z1 , . . . , zn } may attempt transmission. The set Z does not change during the duration of Γ slots. Let us first define the following notations: • Ii is the set of time slots in which node zi is idle. This is when node zi is in the IDLE, DIFS or BACKOFF states. • Di is the set of time slots in which node zi defers because it can sense the transmission of other nodes. This is the period where zi freezes its backoff timer and goes into the DEFER state. • Ti is the set of time slots in which node zi transmits, denoted by the XMIT state. • ii = |Ii |/|Γ|, is the fraction of time node zi is idle. • di = |Di |/|Γ|, is the fraction of time node zi defers. • ci = |Ti |/|Γ|, is the fraction of time node zi transmits. So, ci is the normalized transmission capacity of node zi . • cY , where Y ⊆ Z, is the fraction of time all nodes in set Y transmit. Thus, ˛ ˛ ˛ ˛ ˛ ˛ \ (1) Ti ˛˛ /|Γ|. cY = ˛˛ ˛zi ∈Y ˛ • tY , where Y ⊆ Z, is the fraction of time when all nodes in Y transmit, while none of the other nodes (in Z −Y ) transmit. Thus, ˛ ˛ ˛ ˛ \ [ ˛ ˛ (2) Tj ˛˛ /|Γ|. Ti − tY = ˛˛ ˛ ˛zi ∈Y zj ∈Z−Y
If Y consists of a single node, say zi , we abuse the notation slightly to represent it as ti to represent t{zi } . ti is thus the fraction of time node zi transmits, and no other node in Z transmits.
• pYi , where Y ⊆ Z − {zi }, is the conditional probability that when all nodes in Y transmit in a slot, zi defers its transmission because it senses the channel to be busy. When Y has just one node, say zj , then we again abuse the notation to represent it as pji . Interference affects link capacity by limiting the transmission rate at the sender side and causing packet collisions at the receiver side. We denote these aspects as “sender-side interference” and “receiver-side interference” respectively and model them separately.
5.2 Sender-side Interference To compute the impact of sender-side interference, we determine the transmission capacity (ci ) of each node in Z. Using the notations defined above, Ii , Di and Ti are disjoint sets. Also, every slot is at least in one of these three sets for every node. Thus, Ii ∪ Di ∪ Ti = Γ. This implies that ii + di + ci = 1.
(3)
In the saturated traffic scenario, a node is idle only during DIFS or backoff period. This happens for every packet transmission. DIFS is constant; however the backoff period is random, uniformly chosen between 0 and CWmin slots of, say, size σ for broadcast packets.2 Knowledge of packet size and channel bit rate can now provide an expression for the ratio (α) of the idle and transmit times, on average: α=
DIF S + 21 CWmin σ ii . = ci (P + H)/W
(4)
Here, P is the packet payload size, H is the size of the headers, W is the channel bit rate. Using the standard values of DIFS, slot sizes, CWmin and various headers, we determine α at the lowest bit rate for 802.11b (1 Mbps) for 1400 byte packet payloads. This comes to 0.03 for 802.11b. Equation 3 can now be re-written as (1 + α)ci + di = 1.
(5)
In the above expression, di is the fraction of time slots node zi defers due to the transmission of other nodes. In each slot, there can be a set of nodes (say, Y ) that transmit. For each slot the conditional probability that zi defers to Y , given that all nodes in Y are transmitting is pYi . We can now add up the deferral probabilities in each slot for all possible combinations of Y to obtain di . Note that tY is the fraction of time slots in which all nodes in Y transmit. Thus, X di = pYi tY , (6) Y ∈P(Z−{zi })
where P(S) is the power set of set S. This leaves us with pYi and tY to be determined for each possible Y , such that Y ⊆ Z − {zi }.
5.2.1 Determining pY i Recall that pYi is the conditional probability that zi defers when all nodes in Y are transmitting. Here, we need to model the MAC protocol’s interaction with the physical layer, as this probability should depend on the aggregate signal powers received at zi from all nodes in Y . To make further progress, the relationship between the deferral probability and received signal strengths must be modeled. Since this is intimately related to the actual radio interface used, we use a measurement driven strategy here. The first step is to create an empirical relationship for the probability of deferral between two nodes based on received signal strengths. We express this relationship as a function f (·), such that pji = f (rssji ), where rssji denotes the average of measured signal strength value of packets transmitted from zj and received at zi . We determine function f (·) from a prior profiling study. Note that this function models interface properties rather than wireless propagation in an 2 Note that here there is no exponential backoff as there is no retransmission.
actual deployment. Thus, such prior profiling study is possible. However, in our experience, individual cards do not need to be profiled in this fashion, only card types or card models need to be profiled. These profiles can be reused from a library for different modeling applications. This is in contrast to a similar profiling approach used in [20], where individual cards are profiled. Note that our approach is general and is not restricted to a homogenous system using identical cards. However, for brevity, our experimental results show results from a homogeneous deployment. The profiling methodology to determine f (·) will be discussed in Section 8. Once the function f (·) describing the relationship between the deferral probability and signal strengths is determined, pYi can be expressed as in the following. 0 1 X Y j pi = f @ rssi A . (7) zj ∈Y
This is true since the deferral only depends on the aggregate signal strengths. Now, if the measurements of the pairwise rssji values in the deployed network are available, pYi can be determined for any Y . Note that measuring all rssji values requires O(N ) measurement steps.
5.2.2 Determining tY Recall from equation 2 that tY is the fraction of time all nodes in set Y transmit, and all nodes in the complement set Z − Y remain silent. cY on the other hand is the fraction of time nodes in Y transmit, but nodes in set Z − Y may or may not transmit. We determine tY in terms of cY using equations 1 and 2. From these equations, ˛0 1 0 1˛ ˛ ˛ \ [ ˛ \ ˛ Ti A @ tY = cY − ˛˛@ Tj A˛˛ /|Γ|. ˛ zi ∈Y ˛ zj ∈Z−Y
The second term on the right hand side can be expanded using the principle of inclusion and exclusion of set theory, which after evaluation reduces to the following – X tY = (−1)|X| cY ∪X , (8) X∈P(Z−Y )
where P(S) denotes the power set of S. We still need to determine cY , which is the fraction of time nodes in Y transmit together. Nodes in Y transmit together when every node in Y does not defer for every other node in Y . Thus, cY can be expressed as, Y cY = (1 − piY −zi )ci . (9) zi ∈Y
Equations 6, 7, 8 and 9 can be used to obtain di and then used in equation 5 to write an equation consisting of ci ’s and rssji as the only unknowns. rss values come from the measurements, leaving only ci ’s as unknowns. Now, for each value of the subscript i (i.e., a transmitter) one such equation is obtained, giving n equations for n transmitters. We solve these equations to derive the normalized transmit capacity ci for each transmitter.
5.3 Receiver-side Interference So far, we have modeled transmission capacity of the transmitter. We now need to model receiver-side interference to determine how much of the transmission capacity actually
translates into throughput. Receiver-side interference causes collisions. Thus, if the sender and multiple interferers transmit concurrently, we need to model the probability of packet capture at the receiver. As discussed before, this is done by deriving a relationship between the capture probability and the SINR. This is done in the same fashion as in the case of deferral probabilities in the previous section. Exactly as before, we relate packet capture probabilities to SINR via a function g(·) that is profiled via independent measurements. The profiling methodology to determine g(·) will be discussed in Section 8. Define delivery ratio drij from zj to zi as the fraction of packets received by zi that are transmitted by zj in the absence of any other interfering transmitter. Let us define drij (Y ) as the delivery ratio from zj to zi in presence of the set of interferers Y . Our first task is to model drij as drij = g(rssji /noise). This simply relates packet capture probability to SNR, the ratio of the received signal strength and noise. Here rssji denotes the average signal strength of packets received from zj to zi in absence of interference. We have observed that the function g(·) does not change even if we consider multiple interferers for a link, and the signal strengths of all interferers can be summed up to calculate SINR. This is in constrast to the results of [21] for the Mica2 motes with CC1000 radios. Once the function g(·) has been modeled, drij (Y ) can be expressed as follows: “ ” drij (Y ) = g SIN Rij (Y ) , (10)
where,
SIN Rij (Y ) = P
k∈Y
rssji . rsski + noise
(11)
As in the case of equation 7, the above equation also requires only pairwise measured rss values in the deployed network.
5.4 Capacity of Link Now, we combine the sender and receiver-side interferences to determine the capacity of the link. Let us choose zi as the designated sender from the set Z, and let x be the receiver. All the other transmitters are interferers for this link. Assume that only a subset Y of the set of interferers Z − {zi } is active in a slot and the others are silent (due to deferral or idleness). By definition, tY is the fraction of slots with this property. t{zi }∪Y is thus the fraction of time the sender zi transmits along with some subset of the interferers. This models the packets that are transmitted from the sender notwithstanding sender-side interference. This quantity multiplied by drxi (Y ) models how many of them are captured at the receiver x notwithstanding receiver-side interference. Thus, the overall link capacity (in bits per sec) from the sender zi to receiver x in the presence of a set of interferers Z − {zi } is given by, X P Cxzi (Z − {zi }) = ×W × drxY × t{zi }∪Y . P +H Y ∈P(Z−{zi })
(12)
The first term models the header overhead and the second term specifies the channel bit rate. The third term models the above argument. Consideration of the power set is necessary as any set of interferers can be active in a slot. The
summation over all these possibilities works as they are all mutually exclusive. In Section 5.2 we indicated how to compute ci ’s. tY ’s can be determined using equations 8 and 9. dr’s come from the measurement-based modeling directly. Thus, the link capacity C can be determined using equation 12. The approach of solving equations is described in the following section.
6.
solution for 802.11b (α = 0.03) is (c1 = 0.49, c2 = 0.49) and (c1 = 0.97, c2 = 0.97) respectively. The three transmitter case is a little more involved. As an example, the equation for a single node (z1 ) is (1 + α)c1 + p21 t2 + p31 t3 + p2,3 1 t2,3 = 1, where t2 = c2 − c2,3 , t3 = c3 − c2,3 , t2,3 = c2,3 ,
SOLVING EQUATIONS
The first and hardest step in the solution is solving for the sender-side model as described at the end of Section 5.2. This generates a set of non-linear equations involving ci ’s as the only unknowns, which need to be solved to determine numeric values for ci ’s. This is the computationally intensive part of the model solution. Once ci ’s are determined, the rest of the steps needed to determine the capacity Cxzi (Z − {zi }) is relatively straightforward, as they need only value substitutions. Thus, for brevity, we only discuss the senderside solution (determining ci ’s). There are n equations, one for each transmitter zi . The number of terms in each equation can be exponential in n involving all possible combinations of ci ’s in a product form, i.e., terms like ci , ci cj , ci cj ck , etc., going upto c1 c2 . . . cn . The equations are solved using numerical methods. More on this is in Section 8.3. In our validation work, we have often had opportunities to simplify the equations that reduces the number of terms involved and thus the computation time. Two types of simplifications are possible (see below). This is easily understood by looking at equation 6. • pYi = 0 : This means that the node zi does not defer for the nodes in Y . In such cases, the term pYi tY becomes 0. • pkj = 1 and pjk = 1 : This means that node zk and zj can hear each other perfectly, and their transmissions never overlap each other (t{zj ,zk } = 0). In such a case, the term
{z ,z } pi j k t{zj ,zk }
becomes 0.
Also, these terms do not need to be perfectly 0 or 1 to be eliminated. Terms close enough to 0 or 1 can be approximated as 0 or 1. In our testbed, we found many such opportunities to reduce the number of terms in each equation.
6.1 Examples: Two and Three Transmitters To get a better understanding about these equations, we will consider two sets of examples below – one with 2 transmitters (z1 and z2 ), and other with 3 transmitters (z1 , z2 and z3 ). For notational convenience, we will write t{zi ,zj } {z ,z }
as ti,j . Similarly, we write pi j k as pj,k i . The equations for two transmitters case are: (1 + α)c1 + p21 c2 = 1 (1 + α)c2 + p12 c1 = 1
(13)
The solutions are c1 =
(14)
(1 + α) − p21 (1 + α) − p12 , c2 = . 2 1 2 (1 + α) − p1 p2 (1 + α)2 − p12 p21
Let us consider two special cases, one in which both nodes can hear each other perfectly (p21 = p12 = 1), and another, where neither can hear the other other (p21 = p12 = 0). The
c2,3 = (1 − p32 )(1 − p23 )c2 c3 , p2,3 = f (rss21 + rss31 ). 1 To show how our model can detect the starvation caused due to the classical ‘flow-in-the-middle’ problem [11], we present the set of equations for a similar scenario from our testbed shown in Figure 4. Nodes 4, 6 and 8 form a scenario where node 6 can hear both nodes 4 and 8 perfectly, which are hidden from each other. This leads to the starvation of node 6, which loses out of transmission opportunities because it has to defer for both nodes 4 and 8. Simple capacity models based on distance or delivery, as described later in Section 8.2.1 are unable to predict this, while our model predicts the starvation of node 6. The equations, their solutions and the measured capacity values for this case are shown in Table 1.
7. EXTENSIONS Now, we will pay our attention to the two simplifying assumptions we have used so far. The first is related to the assumption of saturated traffic in the analytical solution approach. The second is the consideration of broadcast transmission only. We will now discuss how to handle these issues.
7.1 Non-backlogged Interferers To model non-saturated conditions, we will need to account for the IDLE state in Figure 2. Assume first that there are only two transmitters z0 and z1 . Assume that z1 , the interferer, is not backlogged and has packets to transmit only l fraction of times. In other words, the normalized offered load at z1 is l. Let us now represent the capacity of link z0 to x in presence of such an unsaturated interferer as Cxz0 (z1 , l), with a little abuse of notation.3 We show how Cxz0 (z1 , l) depends on Cxz0 (z1 ), the capacity in presence of a saturated interferer. If l is greater than c1 , z1 ’s transmission capacity, the case is similar to the saturated interferer because node z must be always backlogged to satisfy its offered load. If l is less than c1 , node z1 ’s demand is satisfied, and z0 can use the silent period of z1 for transmitting packets. The fraction l/c1 , thus, can be seen as the fraction of time the two transmitters behave as if they are in backlogged conditions. The remaining fraction of time, 1 − l/c1 is monopolized by z0 ’s transmissions. Thus, i h i (h (1 − cl1 )Cxz0 (Φ) + cl1 Cxz0 (z1 ) , l < c1 z0 Cx (z1 , l) = Cxz0 (z1 ), otherwise. (15) We can extend this approach for solving for the nonbacklogged interferer to multiple such interferers. Assume, 3
Cxz0 ({z1 }, 1.0) is written as Cxz0 (z1 ).
Nodes in testbed
Equations
Predicted c 0 , c1 , c2
Delivery-based c0 , c1 , c2
Distance-based c0 , c1 , c2
Measured c0 , c1 , c2
1.03c0 + c1 + c2 − c1 c2 = 1 1.03c1 + c0 = 1 1.03c2 + c0 = 1
0.01 0.97 0.97
0.33 0.5 0.5
0.33 0.5 0.5
0.09 0.9 0.9
Table 1: Example contention scenarios for a three node set up: z 0 in black, z1 in red, z2 in green. The corresponding nodes in the testbed are 6, 4 and 8. A line between nodes shows that they do not interfere with each other.
node x is the receiver, node z0 is the sender, and a set of nodes Z = {z1 , . . . , zn } are the interfering nodes. Assume, the nodes in set Z have normalized offered loads L = {l1 , . . . , ln }, respectively. Let us consider the interferer, zi , with the smallest load, such that its demand can be satisfied. The fraction li /ci can be seen as the fraction of time when all the nodes have backlogged traffic. Thus, »„ « – li Cxz0 (Z, L) = 1 − × Cxz0 (Z − {zi }, L0 ) ci – » li × Cxz0 (Z) . (16) + ci 0
where L is the residual offered load vector after the load in the fraction of time with saturated conditions with zi has been satisfied. For zj , current residual load is lj0 . lj0 = lj −
li × cj . ci
(17)
The above equation can be further reduced by considering the next node with the smallest demand and so on, until we are left with backlogged nodes only.
7.2 Modeling Unicast Unicast transmission in 802.11 provides reliability using retransmissions when the packet is not delivered successfully, and an ACK is not received from the receiver. When retransmitting a packet, the backoff window is doubled. This is done repeatedly until the ACK is received, or the retry limit has been exceeded. The broadcast model presented in Section 4 and Figure 3 can be easily extended to handle ACKs and increased backoffs for each retransmission. This would require an extra transition from the XMIT(0) state to the BACKOFF(k 0 ) state with a probability equal to collision probability (modeled by 1 − dr) where k 0 is the new backoff window, 0 < k 0 < 2CWmin . Let us consider a scenario with sender z0 , receiver x, and interferers Z as before. The analytical approach presented in Section 5 needs following modifications to solve the unicast model. • Idle time computation : Due to retransmissions, and multiple backoffs for the transmission of a single packet, the ratio between normalized idle times (ii ) and transmit times (ci ) does not remain a constant. We can compute idle time by considering all possible subsets Y of the interferer set Z and the collision probability with each of these subsets, when they are active. For each Y , the backoff time evolution is a geometric pro-
cess with the collision probability as parameter. Thus, ii =
X
Y ∈P(Z)
DIF S + SIF S + bo(Y ) t{z0 }∪Y , (P + H)/W
(18)
where, bo(Y ) is the average backoff time spent for transmitting a packet (including retransmissions) from z0 to x when a subset of interferers Y is active: bo(Y ) =
m X
(1 − drxY )k 2k−1 CWmin σ.
(19)
k=0
Here, m denotes the retransmission limit for a packet. • Consideration of ACK : We keep equation 3 unchanged by considering ACK transmissions as part of a sender’s transmission. Thus, in any XMIT slot, a node may be transmitting data, or receiving ACK. ACK packets are small and their impact in causing interference is also small relative to data packets. Also, ACK is transmitted only once per successful packet transmission, while the packet may be retransmitted. Thus, for a single packet, the proportion of time slots occupied by ACK is very small compared to the time slots occupied by data. In the XMIT slots, ACK may impact the deferral probability, and the probability of collision by causing DATA-ACK, or ACK-ACK collisions. Both these probabilities may still be modeled by attributing a small (appropriately computed based on sizes) probability to a XMIT slot being occupied by an ACK transmission. Another simplified model could simply ignore the effect of ACK transmissions in causing interference. With the above modifications, the link capacity can be computed as in the case of broadcast following the same steps. Note that once the slots of the sender’s transmission has been identified, the unicast capacity for those slots is identical to the broadcast capacity. This is because if the probability of packet capture is fixed, it does not matter whether a packet is being transmitted or retransmitted. The throughput of the link will be the same in both cases, as throughput only depends on the number of unique packets successfully received. Summarizing, modeling unicast requires modifying the model for idle time computation, and considering the probability of collision and deferral for ACK packets. Even though the inclusion of these in the model makes the model more accurate, it adds an extra complexity for the analytical and simulation-based approaches. The impact of these factors are small because ACK packets are small in general, and
11
4 9 10
3
0.8 0.6 0.4 Fitted f(.) Measured
0.2 0
7 1
Figure 4: Locations of the nodes on the floor map and links with more than 90% delivery ratio. Width of the map is 60m. the extra idle time is much less than the packet transmission time for large packets. Also, as we argued above, retransmissions do not impact the capacity computation for a link except for the extra idle time. Given this, it is worth debating whether there is much benefit at all from modeling the more complex unicast. It has been shown before in [19, 20] that the interference between unicast transmissions can be well estimated by estimating the interference between broadcast transmissions. We also observed similar behavior in our testbed (not reported here).
8.
EXPERIMENTAL PROCEDURE
Our experimental testbed consists of 12 Dell Latitude D520 laptops running Linux 2.6.15 kernel. The testbed is located in one floor of a modern office-cum-lab environment. See Figure 4 for a network diagram. Each laptop uses a DLink AirPremier DWL-AG660 802.11a/b/g PC card with Atheros AR5212 chipset. The Madwifi driver, Version 0.9.6 [2] is used. The cards are configured in ad hoc mode when used as transmitter, and in monitor mode, when used as receiver. Thus, measurements of dr and rss values are done in the monitor mode. rss is in the prism monitoring header which is obtained whenever a packet is captured when the card is in monitor mode. The value reported by Atheros cards is the gain dB relative to the noise floor. In particular, the card reports the value 10 log 10 ( S+I ), where S is N the received signal power and I is the aggregate interference power, N is a fixed noise floor (fixed at -95dBm). According to the above representation, any external interference will influence the measured rss value between two links.4 To alleviate this problem, we have done all our experiments in the night in a relatively ‘quiet’ environment so that interference I from other 802.11 networks could be considered zero. Thus the measured rss is simply a dB gain over a fixed noise floor and can be easily converted to power (mW or dBm) to use in the formulation in Section 5. Instead of inventing new notations, we will be using the term rss everywhere. In the experiments it is in dB, in the analysis it is in dBm or mW. All experiments reported here are done for 802.11b. We also did a similar set of validations for 802.11a and had very similar experience. We choose to present 802.11b results here as it gives longer range links and has a rich set of in4
In other cards, for example, Prism2-based [3], it may be possible to measure the external interference as noise.
0.8 0.6 0.4 Fitted g(.) Measured
0.2 0
0
12
2
1
j
j
8
Capture probability dr i
1
6
Deferral probability p i
5
10 20 30 40 50 Signal Strength rssji (dB)
0
10
20 30 40 SINRji (dB)
50
(a) f (·) (b) g(·) Figure 5: Profile for functions f (·), probability of deferral, and g(·), probability of capture.
terferences in our testbed. All experiments are done at the lowest phy-layer rate (1 Mbps) and with large (1400 bytes) packet sizes. We have verified that profile for one packet size can be used for other packet sizes. Profiles also seem quite independent of the choice of channels. However, profiling needs to be done for each possible data rate. Needless to say, different card models must be profiled separately.
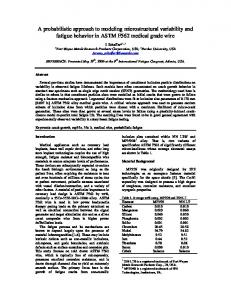
8.1 Profiling Experiments We do a set of measurements to create the profiles f (·) and g(·), which form the inputs to the 802.11 MAC model. Recall that function f (·) models the probability of deferral in terms of the received signal strength (equation 7), while function g(·) models the probability of packet capture in terms of SINR on the link (equation 10). To create the profiles, we use two laptops (as described above), say zi and zj , and place them at different random locations to create a large number of samples of average rssji and rssij values5 and then relate these samples to measured values of pji and pij . To do this, ci and cj are measured when both of the nodes have saturation UDP broadcast traffic, and i then equation 13 is used to compute pji = 1−(1+α)c , pij = cj 1−(1+α)cj ci
. Each hp, rssi pair thus obtained is plotted in Figure 5(a). A large number of such points are obtained by repeating the process for different random locations of zi and zj , which gives different samples of link quality and sender-side interference. To create the profile for g(·), we use similar random experiments using two nodes. (In fact both these experiments are done together to save effort). In this case, the SIN Rij is determined from equation 11 as (rssji /noise), as there is no interference. The delivery ratio drij is directly measured. As before, a plot is created (Figure 5(b)) relating capture probability and SINR. The figures show the measured values as scatterplot and also the fitted curves. The curves for the desired functions are fitted using a linear interpolation of average values in buckets of 2dB each. An interesting observation in the graphs is that the profile for packet capture probability is shifted to the right when compared to the profile for deferral probability. This is expected, as the threshold for deferral is lower than the threshold for successful packet delivery. 5
All averages are long term averages. Some methods of collecting stable average statistics for 802.11 are described in [19, 20]. We follow very similar techniques.
% of predictions
100
100
100
100
100
80
80
80
80
80
60
60
60
60
60
40
40
40
40
40
20
20
20
20
20
0
0
0
0
-1
-0.5 0 0.5 Error (1 interferer)
1
-1
-0.5 0 0.5 Error (2 interferers)
1
-1
-0.5 0 0.5 Error (3 interferers)
1
0 -1
-0.5 0 0.5 Error (4 interferers)
1
-1
-0.5 0 0.5 Error (5 interferers)
1
Analytical Simulation
% of predictions
Figure 6: CDF of error between the estimated and measured transmission capacity of senders, c i for node zi . 100
100
100
100
100
80
80
80
80
80
60
60
60
60
60
40
40
40
40
40
20
20
20
20
20
0
0
0
0
-1
-0.5 0 0.5 Error (1 interferer)
1
-1
-0.5 0 0.5 Error (2 interferers)
1
-1
-0.5 0 0.5 Error (3 interferers)
1
0 -1
-0.5 0 0.5 Error (4 interferers)
1
-1
-0.5 0 0.5 Error (5 interferers)
1
Analytical Model Simulation Delivery-based Model Distance-based Model Naive Model
Figure 7: CDF of error between the estimated and measured throughput capacity on links, C xzi (Z − zi ) for link from zi to x.
8.2 Model Evaluation and Validation Experiments This part of the work concentrates on the target network – the 12-node testbed described before. Average rss values for all link pairs in the network are collected. Here, each node takes turn to transmit UDP broadcast packets and every other node measures the average rss values. Again, this process is similar to measurements reported in [19, 20]. This takes O(N ) steps for an N node network. The profiles generated in the previous section and the values collected are used to seed the 802.11 model described in Section 4. Both analytical approach and direct simulation can now be used to solve the model to determine the throughput capacity of any given link. We have written a simulator in C which implements the Markov Chain based 802.11 model. We use a slot size of 10µs in 802.11b, which is small enough such that all protocol states span integer number of slots. We will later see in Section 8.3 that there is an accuracy vs. computation time tradeoff between these two methods. For validation, we perform direct measurements on the testbed to evaluate link capacities and then compare them with those estimated by the model. In each validation experiment, n nodes are chosen from the testbed as transmitters while the remaining 12 − n nodes act as receivers. Each transmitter then broadcasts packets as fast as possible (to model saturated traffic) for 60 seconds. At the end of this time period, the throughput on each one of the n(12 − n) links is measured by counting the number of packets received from each sender. For each such link, there are n−1 interferers. We also measure the transmission capacity (number of packets actually transmitted in the air per second) for each transmitter. This quantity is reported by the card to the Madwifi driver. We have performed validation experiments with up to 5 interferers. When n = 2, it is a single interferer scenario.
Here, we have measured all possible combinations of such scenarios, which require 66 experiments, and provide data for 132 transmitters, and 1320 links. When 3 ≤ n ≤ 6, we randomly pick 50 configurations of n transmitters each, which results in data for 50n transmitters, and 50n(12 − n) links. Thus, overall we have performed 266 sets of experiments resulting in 7820 data points in the plots to be presented next. Figure 6 shows the CDF of the absolute error (modeled − measured) in transmission capacity for both solution approaches – analytical and direct simulation. We specify capacity as a fraction of the channel bit rate. Note that the model performs quite well for fewer interferers, increasingly losing accuracy with more interferers, where the approximations used in the modeling and measurement errors start mattering more. Also, note that simulation provides better accuracy relative to the analytical method. This is expected due to the approximations used in the analytical method. Exactly similarly, we present the absolute error between estimated and measured link throughput capacities in Figure 7. Once again note the excellent accuracy. It may appear here that the accuracy is more than for transmission capacities in Figure 6. This appearance is due to the fact that throughput capacities are smaller than transmission capacities; thus absolute errors are also smaller. The horizontal scale of both the plots are the same. The summary statistics for the errors will be presented momentarily in the following subsection.
8.2.1 Comparison with Simpler Models It is instructive to compare our model with simpler models that one would use in absence of approaches such as ours. We use three simple models for comparison -(i) naive model (also used in [20]), where the link delivery ratio on a link is used as an estimate of link capacity; (ii) delivery-based
5
0.8
Analytical Model Simulation Delivery-based Model Distance-based Model Naive Model
0.6 0.4
Analytical Simulation - 95% CI 4 Simulation - 90% CI Time (sec)
% of predictions with |error| < 0.1
1
3 2
0.2 1
0 0
1
2
3
4
5
6
Number of Interferers
Figure 8: Summary error statistics for different models for different numbers of interferers. model, where sender-side interference is modeled by assuming that the normalized transmission capacity of the sender is 1/(1 + no. of neighbors)6 and then multiplying this number with the link delivery ratio; (iii) distance-based model, fashioned after the protocol interference model [12]). Here, transmit range, interference and carrier sensing ranges7 are first determined based on a set of independent measurements in the same environment. If two links have a receiver in interference range of the other sender, or have the senders in each others sensing range, then they are said to be in conflict. The normalized capacity of a link in this model is 1/(1 + number of conflicting links). The capacity is 0 for non-existent links (i.e., sender and receiver are outside transmit range). We compare these models with our analytical and simulation approaches. The CDFs for errors for these models are also plotted in Figure 7. Note that the naive model overestimates capacity a lot, as it ignores interference. The delivery-based model also overestimates significantly as it does not have any way to model the receiver-side interference. This is very apparent from the plots with small number of interferers. On the other hand, the distance-based model underestimates significantly. This is likely because of conservative range estimates and the mistaken assumption that the ranges are isotropic. For larger number of interferers, it appears that errors are going down for the deliverybased and distance-based models. This is an illusion as the capacities are also smaller with larger number of interferers and thus absolute values of errors are also smaller. Figure 8 summarizes the errors in estimating link capacities for all the models in terms of percentage of predictions with absolute error within 10%. This data directly comes from the CDF presented in Figure 7. Note again that the simulation-based solution is the most accurate, estimating capacities of links more than 90% of the times with an error that is within 10% of the channel bit rate. This goes down to about 80% of the times in the analytical approach. The simpler models typically perform much worse, though distance based model becomes competitive for larger number of interferers. Going back to the example in Section 6.1 note that both delivery and distance-based models do a very poor job in modeling the ‘flow-in-the-middle’ scenario (see Table 1).
8.3 Computation Time Recall the discussion on the complexity of solving the 6 Here, a node is a neighbor if it has a link with at least 90% delivery ratio. 7 90% probability for respective events are considered for estimating ranges.
0 0
2
4 6 8 Number of Interferers
10
12
Figure 9: Computation time for analytical and simulation approaches with increasing number of interferers.
equations for the analytical solution from Section 6. Long computation time will limit the applicability of our approach. We thus need to analyze the computation time issues. For the plots presented above, we have used Mathematica [1] to solve the equations. It uses the Newton’s method [15] for solution, which in turn uses a method of linear approximation. Newton’s method requires a set of good starting values for rapid convergence. We have seeded the variables with the values from the delivery-based model. Note that this model is computationally very cheap. We have set the maximum number of iterations to 1000. We have also specified the stopping criteria, such that the iterations stop when an accuracy of 10% has been achieved. For simulations, we have used the batch means method to ensure that simulations converge to a target level of confidence. Our target for the above validation plots has been 95% confidence interval of batch means being less than 5% of the overall mean statistics. Figure 9 shows the computation time for the analytical approach and the simulation approach. For simulations, we now also add the times for a less accurate simulation (90% confidence interval less than 5% of mean). This demonstrates a tradeoff between accuracy and computation time. Simulations are almost an order of magnitude slower than the analytical approach. The computation times are reported for a Dell PC with a 3 GHz Pentium processor with 4GB of RAM, running Linux. For the purpose of this plot, we have evaluated computation times up to 12 transmitters (i.e., 11 interferers) in our 12 node testbed. Note that the time to solve the analytical approach increases very slowly, and is approximately 0.35 sec even with 11 interferers. The trend indicates that with a powerful computer, the analytical solution approach should be useful even for on-line decision making for resource scheduling, at least at a coarse time scale (second or sub-second). For example, for applications such as coarse-grain channel assignment, admission control, centralized routing, etc. 0.11 second computation time is easily affordable. Studying the computational issues further is on our future research agenda.
8.4 Validation For Non-backlogged Interferers In this section we present some validation results to demonstrate that our model extends to the case when the interferer is not backlogged. We show the capacity of a link in presence of an interferer for three cases – when the interferer causes sender-side interference, when the interferer causes receiverside interference, and when the interferer does not affect the
Link Capacity (1→3)
1
1
Measured C3(2)
0.8
Modeled C13(2) Measured C13(4) 1 Modeled C3(4) 1 Measured C3(11) Modeled C13(11)
0.6 0.4 0.2 0 0 0.2 0.4 0.6 0.8 1 Offered load on Interferer
Figure 10: Capacity of a link (1,3) in presence of one non-backlogged interferer. Interferer 2 contends for channel with 1; 4 causes collisions, while 11 does not effect the link. link at all. To do this, we pick one link in the testbed and choose three suitable nodes as interferers to validate these three cases. In each case we determine the capacity of the link in question from our model and compare it with the measured capacity. Figure 10 shows the accuracy of our prediction using analytical modeling in each case.
9.
CONCLUSIONS
In this paper, we have addressed the challenging problem of modeling link capacities in a real, deployed 802.11 network. This is a departure from the existing methods of analytical or simulation-based modeling that often make unrealistic assumptions. Our model is based on the realistic physical interference model that drives a discrete time Markov chain-based model of 802.11 behavior. The physical interference model is profiled using measurements and is seeded again by measurements on the target network to be evaluated. The methods we proposed are practical – (i) The profiled measurements can be kept in a library and reused. (ii) The measurements on the target network are simple and take O(N ) steps. (iii) The analytical solution time is of “sub-second” scale opening up a lot of applications that use course-grain decision making, such as overlay MAC scheduling, routing, admission control and channel assignment. Our future work will explore some of these applications using the proposed model. While we have used a single channel, single packet size, single data rate and single interface card model in our work here, this is not a limitation. Profiling can be done for all these parameters separately. Some additional modeling can indeed help in profiling effort. For example, profiling for one size can possibly be extrapolated for other sizes. In principle, the modeling approach is able to handle heterogenous systems, where different nodes use different parameters, so long as cards with all such parameter settings have been profiled for. The harder problem is handling dynamically changing parameters, for example, auto rate control in 802.11. In this case, the rate control algorithm must be modeled as a part of our approach. Also, our approach is general enough such that extensions of 802.11 (e.g., 802.11e) can be modeled using a similar Markov model, though more states probably will make the solutions more compute intensive.
Acknowledgments Anand Kashyap and Samir Das’s work was partially supported by a research award from the NEC Labs, NSF grants CNS-0519734, OISE-0423460, CNS-0308631 and a grant from the SensorCAT center.
10. REFERENCES
[1] Mathematica 5.2. http://www.wolfram.com/. [2] Multiband Atheros Driver for WiFi (MADWIFI). http://sourceforge.net/projects/madwifi/. [3] HFA3863 Data Sheet: Direct Sequence Spread Spectrum Baseband Processor with Rake Receiver and Equalizer. Intersil Corporation, 2000. [4] Daniel Aguayo, John Bicket, Sanjit Biswas, Glenn Judd, and Robert Morris. Link-level Measurements from an 802.11b Mesh Network. SIGCOMM Comput. Commun. Rev., 34(4), 2004. [5] G. Bianchi. Performance Analysis of the IEEE 802.11 Distributed Coordination Function. IEEE J. Selected Areas of Communication (JSAC), 18(3):535–547, 2000. [6] Joseph Camp, Joshua Robinson, Christopher Steger, and Edward Knightly. Measurement Driven Deployment of a Two-tier Urban Mesh Access Network. In Proc. ACM MobiSys, 2006. [7] Hoon Chang, Vishal Misra, and Dan Rubenstein. A General Model and Analysis of Physical Layer Capture in 802.11 Networks. In Proc. IEEE Infocom, 2006. [8] D. De Couto and D. Aguayo and J. Bicket and R. Morris. A High-throughput Path Metric for Multi-hop Wireless Routing. In Proc. ACM MobiCom, 2003. [9] S. Das, D. Koutsonikolas, Y. Hu, and D. Peroulis. Characterizing Multi-Way Interference In Wireless Mesh Networks. In Proc. ACM WiNTECH Workshop, 2005. [10] Yan Gao, Dah-Ming Chiu, and John C.S. Lui. Determining the End-to-end Throughput Capacity in Multi-hop Networks: Methodology and Applications. SIGMETRICS Perform. Eval. Rev., 34(1):39–50, 2006. [11] Michele Garetto, Theodoros Salonidis, and Edward W. Knightly. Modeling Per-flow Throughput and Capturing Starvation in CSMA Multi-hop Wireless Networks. In Proc. IEEE Infocom, 2006. [12] P. Gupta and P. R. Kumar. The Capacity of Wireless Networks. IEEE Transactions on Information Theory, 46(2):388–404, March 2000. [13] Kamal Jain, Jitendra Padhye, Venkata N. Padmanabhan, and Lili Qiu. Impact of Interference on Multi-hop Wireless Network Performance. In Proc. ACM MobiCom, 2003. [14] Kyle Jamieson, Bret Hull, Allen K. Miu, and Hari Balakrishnan. Understanding the Real-World Performance of Carrier Sense. In Proc. ACM E-WIND Workshop, 2005. [15] C. T. Kelley. Solving Nonlinear Equations with Newton’s Method. SIAM, 2003. [16] Kyu-Han Kim and Kang G. Shin. On Accurate Measurement of Link Quality in Multi-hop Wireless Mesh Networks. In Proc. ACM MobiCom, 2006. [17] Anurag Kumar, Eitan Altman, Daniele Miorandi, and Munish Goyal. New Insights from a Fixed Point Analysis of Single Cell IEEE 802.11 Wireless LANs. In Proc. IEEE Infocom, 2005. [18] V. S. Anil Kumar, Madhav V. Marathe, Srinivasan Parthasarathy, and Aravind Srinivasan. Algorithmic aspects of capacity in wireless networks. SIGMETRICS Perform. Eval. Rev., 33(1):133–144, 2005. [19] J. Padhye, S. Agarwal, V. Padmanabhan, L. Qiu, A. Rao, and B. Zill. Estimation of Link Interference in Static Multi-hop Wireless Networks. In Proc. IMC, 2005. [20] Charles Reis, Ratul Mahajan, Maya Rodrig, David Wetherall, and John Zahorjan. Measurement-Based Models of Delivery and Interference in Static Wireless Networks. In Proc. ACM SIGCOMM, 2006. [21] Dongjin Son, Bhaskar Krishnamachari, and John Heidemann. Experimental Study of Concurrent Transmission in Wireless Sensor Networks. In Proc. ACM SenSys, 2006.