1
A method for automatically constructing the initial contour of the common carotid artery Yara Omran, and Kamil Riha
Abstract—In this article we propose a novel method to automatically set the initial contour that is used by the Active contours algorithm. The proposed method exploits the accumulative intensity profiles to locate the points on the arterial wall. The intensity profiles of sections that intersect the artery show distinguishable characterstics that make it possible to recognize them from the profiles of sections that do not intersect the artery walls. The proposed method is applied on ultrasound images of the transverse section of the common carotid artery, but it can be extended to be used on the images of the longitudinal section. The intensity profiles are classified using Support vector machine algorithm, and the results of different kernels are compared. The extracted features used for the classification are basically statistical features of the intensity profiles. The echogenicity of the arterial lumen, and gives the profiles that intersect the artery a special shape that helps recognizing these profiles from other general profiles. The outlining of the arterial walls may seem a classic task in image processing. However, most of the methods used to outline the artery start from a manual, or semi-automatic, initial contour. The proposed method is highly appreciated in automating the entire process of automatic artery detection and segmentation. Keywords—SVM, Ultrasound imaging, Segmentation, Carotid artery.
I. I NTRODUCTION
U
LTRASONIC imaging is a widely used non-invasive medical imaging procedure since it is economical, comparatively safe, portable and adaptable. However, one of its main weaknesses is the poor quality of images, making the processing of these images more challenging. Segmentation of Ultrasound images is an initial step for the analysis and diagnosis of the data in the image. Our goal in this article is to locate points on the arterial wall, the considered object is the artery (carotis communis) in a transverse section captured by a Sonographic device. The artery in this section has an approximately circular shape, and the artery wall appears as bright areas. This step of detecting the artery is important for making other processes fully automated; such a process is tracking the movement of the artery in a video sequence to obtain useful information from it, or to predict the existence of some diseases or irregularities. Circular pattern detection is one of the classic tasks in image processing; many approaches to achieve this goal were proposed such as (CHT) [2], correlation [3], maximal-likelihood [4] or Genetic Algorithms which are computationally expensive [5]. However, due to the special nature of medical Sonographic images with the high level of noise and the blurred edges, we are in need to new approaches. Authors are with the Department of Telecommunications, Brno University of Technology, Czech Republic (
[email protected],
[email protected]).
Many approaches to detect objects in medical images were presented such as [9], or trainable image segmentation [10]. Other approaches dealt specifically with detecting a circular object in medical images like [11], [12], with the exploitation of ellipse fitting. Golemati et al. [13], proposed a system for automatically extracting lines and circles from sequences of B-mode ultrasound images of longitudinal and transverse sections of the carotid artery, their methodology was based on the Hough Transform (HT). They used the CHT for automatically detecting the artery in the transverse section, and estimating the Arterial Distension Waveforms (ADW) as well as the diastolic and systolic diameters. For the longitudinal section, they used the HT for estimating the Intima-Media thickness (IMT). Mao et al. [14], proposed an interactive method based on dynamic contour model initialized manually with one seed, the used model combined geometric constraints, image gradient, and contrast features to control the contour and thus to optimize the segmentation process. In [11], a system for localizing the artery based on motion features was proposed, were the pulsatile character of the artery wall was used as information for localizing it after compensating other global movements. The method is based on the optical flow technique to detect the region of interest that contains the artery, followed by CHT (Circular Hough Transform) to estimate the center and radius of the artery. Golemati et al. [16] proposed an active contour based method to automatically extract lines and circles from longitudinal and transverse sections; the active contour was initialized by HT to detect the circle. This method used gradient vector flow to deform the contour, resulting in a random shaped boundary which follows more closely the actual wall - lumen interface than a circle. In [15], authors used a method based on watershed segmentation algorithm, their technique consisted of four major stages that are: preprocessing, watershed segmentation, region merging, and boundary extraction. In this article we assume that the ROI containing the artery is already defined by means of an object detector or any other methodology, our aim is to locate points on the arterial wall. The main contribution of the article is automatically finding the points that will form the initial contour to be passed to the Active Contour algorithm in order segment the artery in more detail. II. D ETECTING THE POINTS ON THE ARTERIAL WALL As mentioned in the introduction, many successful approaches for segmenting the artery used Active contour algorithms, the most weak point in these methods, is that they were initialized manually or semi-automatically. In this article we exploit the fact that the image intensity of the lumen area is approximately
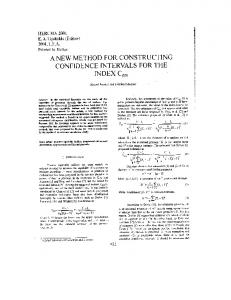
Fig. 1. Ultrasound image of CCA, extracted by an object detector, after thresholding and dilattion Fig. 2. Ultrasound image of CCA, image profiles are taken according to the vertical lines
uniform (it appears as a black area) since the lumen only contains blood, while the other areas are usually composed of variety of different tissues, and have a non-uniform intensity, which makes the image profiles of areas containing the artery distinguishable from those which don’t. The intensity profile in the vertical direction shown in Fig. 2 demonstrates the tissue variation. This variation allows us to analyze the variance of the profile data in different cuts to identify the location of points on arterial wall. As Fig. 3 shows, the intensity profiles of areas which contain the artery share a similar pattern (i.e. the gap in the profile which represents the lumen area), while intensity profiles of areas which don’t contain the artery have an arbitrary shape. In this article we classify these profiles into two groups, those which cross the artery, and those which do not. In this way we detect accurately the peaks in the profile which correspond to the edges of the artery wall see Fig. 3. We used the SVM classifier with different kernels, and we compared the performance of each one of these kernels in classifying the intensity profiles. A. Training and testing data A set of 29 B-mode ultrasound images, captured by Sonix OP, have been used for this experiment. All images are an outcome of an object detector as in [14], and they contain the CCA in transverse section (see Fig. 1). The images were scanned with different settings of acquisition hardware (frequency, depth, gain) and different positioning of a probe the size of each image is 142 × 142 pixels.
TABLE I T HE STATISTICAL MEASURES FOR EACH KERNEL
accuracy 87.13% accuracy 92.77% accuracy 52.60% accuracy 95.58% accuracy 91.57%
Polynomial kernel presicion 86.78% Radial kernel presicion 95.79% Multi-quadric kernel presicion 52.61% Anova kernel presicion 95.27% Dot kernel presicion 94%
recall 90.92% recall 90.64% recall 100% recall 96.86% recall 90.83%
the previously described images; these profiles were manually labeled into two groups, the first one is the positive group, which is the group of profiles of areas that cross the artery, and the second group is the negative profiles, which is the group of profiles for areas outside the artery. The profiles were taken in the vertical direction, and the starting point of each profile is shifted by 10 pixels from the adjoining profiles. Each profile consists of intensity values of pixels along the image, between the start point, at the first row, and he end point, at the last row of the image see Fig. 3. III. E XPERIMENTAL RESULTS
B. SVM classifier The classification was based on image local features obtained from a neighborhood of particular pixels, in addition to the pixels’ intensity itself. The appropriate selection of features is crucial for the performance of the classifier. It is important to select features that separate both classes. In this implementation, the selected features were- the mean value in the 8th neighborhood, the standard deviation, median value, the maximal and the minimal intensity, and others. The classifier was trained on 249 intensity profiles extracted from
We trained the SVM classifier using 5 different kernels (Polynomial, radial, anova, multi-quadric, and dot). The statistical measures: accuracy, precision, and recall were calculated for each used kernel, see equations 1. 2. and 3. The classifier performance was evaluated using the Cross-validation method; this method partitions the set of data into a number of complementary subsets, and performs the training on a group of subsets (called the training set), and validates the analysis on the other subsets (usually only one subset is used for validation, and it is called the testing set). To reduce the
(a)
(b)
(c)
(d)
Fig. 3. (a) image profile according to line number 1, (b) image profile according to line number 5, (c) image profile according to the last line, (d) image profile according to line number 6. The artery images are rotated by 90 degrees for illustration purpose
variability, multiple rounds of cross-validation are performed using different partitions (making the training and testing sets change roles), and the validation results are averaged over the rounds. In our case we used 10 subsets for training and testing. The results show a good performance of the SVM classifier for different kernels, except the multiquadric kernel which had a poor performance in classifying the profiles. accuracy =
TP + TN TP + FP + TN + FN
(1)
TP TP + FP
(2)
presicion = recall =
TP TP + FN
(3)
IV. C ONCLUSION In this article, we presented a new method for automatically constructing the initial contour that is then given to the Active contours algorithm. The proposed method is based on the classification of the intensity profiles of ultrasound images of the common carotid artery. The input of the method is the area containing the artery. The used classification algorithm is SVM. Different kernels are used, and their performance is compared. The proposed method is highly appreciated in systems that deal with artery detection and segmentation, as most of the methods used for segmentation are initialized manually or semi-automatically. The proposed methosd is applied on ultrasound images of the transverse section of the arterial wall, but it can be extended to be used on images of the longitudinal wall. ACKNOWLEDGEMENTS Acknowledgement: This research work is funded by the project: SIX CZ.1.05/2.1.00/03.0072, EU ECOP EE.2.3.20.0094, CZ.1.07/2.2.00/28.0062, Czech Republic. Supported by the Ministry of industry and trade of the Czech republic number TI-FR3/170. R EFERENCES [1] C. Loizou, C. Pattichis, M. Pantziaris, T. Tyllis, and A. Nicolaides, Quality evaluation of ultrasound imaging in the carotid artery based on normalization and speckle reduction filtering, Medical and Biological Engineering and Computing, Volume 44, Issue 5, 2006, Pages 414-426, ISSN 0140-0118, DOI:10.1007/s11517-006-0045-1. [2] C. P. Loizou, C. S. Pattichis, M. Pantziaris, and A. Nicolaides, An Integrated System for the Segmentation of Atherosclerotic Carotid Plaque, Information Technology in Biomedicine, IEEE Transactions on, vol.11, no.6, pp.661-667, Nov. 2007. doi: 10.1109/TITB.2006.890019. [3] F. Molinari, G. Zeng, and J. S. Suri, A state of the art review on intima–media thickness (IMT)measurement and wall segmentation techniques for carotid ultrasound, Computer Methods and Programs in Biomedicine, Volume 100, Issue 3, December 2010, Pages 201-221, ISSN 0169-2607, DOI:10.1016/j.cmpb.2010.04.007. [4] G. Treece, R. Prager, and A. Gee, Ultrasound attenuation measurement in the presence of scatterer variation for reduction of shadowing and enhancement, Ultrasonics, Ferroelectrics and Frequency Control, IEEE Transactions on, vol.52, no.12, pp.2346-2360, Dec. 2005 doi: 10.1109/TUFFC.2005.1563279. [5] I. B. Casella, C. Presti, R. M. P. Porta, C. R. D. Sabbag, M. A. Bosch, and Y. Yamazaki, A practical protocol to measure common carotid arteryintima-media thickness, Clinics, Volume 63, Issue 4, 2008, ISSN 1807-5932.
[6] J. E. Wilhjelm, M.- L. M. Gronholdt, B. Wiebe, S. K. Jespersen, L. K. Hansen, and H. Sillesen, Quantitative analysis of ultrasound B-mode images of carotid atherosclerotic plaque: correlation with visual classification and histological examination, Medical Imaging, IEEE Transactions on, vol. 17, no. 6, pp. 910-922, Dec. 1998, DOI: 10.1109/42.746624. [7] T. Elatrozy, A. Nicolaides, T. Tegos, AZ. Zarka, M. Griffin, and M. Sabetai, The effect of B-mode ultrasonic image standardization of the echodensity of symptomatic and asymptomatic carotid bifurcation plaque, International Angiology, September 1998, Volume 17, Issue 3, Pages 179–186. [8] E. Kyriakou, MS. Pattichis, C. Christodoulou, CS. Pattichis, S. Kakkos, M. Griffin, and A. Nicolaides, Ultrasound imaging in the analysis of carotid plaque morphology for the assessment of stroke, 2005, PMID: 15923744. [9] R. Benes, M. Hasmanda, K. Riha, Object localization in medical images, Telecommunications and Signal Processing (TSP), 2011 34th International Conference on, vol., no., pp.559-563, 18-20 Aug. 2011, DOI: 10.1109/TSP.2011.6043667. [10] . D. Gill, H. M. Ladak, D. A. Steinman, and A. Fenster, Segmentation of ulcerated plaque: A semi-automatic method for tracking the progression of carotid atherosclerosis, in Proc. World Congr. Med. Phys. Biomed. Eng., Chicago, IL, 2000, pp. 1–4, 2000. [11] . Zhang, C. R. McKay, and M. Sonka, Tissue characterization in intravascular ultrasound images, IEEE Trans. Med. Imag., vol. 17, no. 6, pp. 889–899, Dec. 1998. [12] . R. Cardinal, J. Meunier, G. Soulez, E. Th’erasse, and G. Cloutier, Intravascular ultrasound image segmentation: A fast-marching method, in Proc. MICCAI, LNCS 2879, 2003, pp. 432–439. [13] . Brusseau, C. L. De Korte, F. Mastick, J. Schaar, and A. F. W. Van der Steen, Fully automatic luminal contour segmentation in intracoronary ultrasound imaging: A statistical approach, IEEE Trans. Med. Imag., vol. 23, no. 5, pp. 554–566, May 2004. [14] OMRAN, Y.; R´IHA, K.; DUTTA, M. Automatic Estimation Of The Arterial Parameters In Ultrasound Video Sequence. In 36th International Conference on Telecommunications and Signal Processing (TSP). 2013. s. 10-14. ISBN: 978-1-4799-0403- 7.