This discussion paper is/has been under review for the journal Hydrology and Earth System Sciences (HESS). Please refer to the corresponding final paper in HESS if available.
Discussion Paper
Hydrol. Earth Syst. Sci. Discuss., 12, 4909–4932, 2015 www.hydrol-earth-syst-sci-discuss.net/12/4909/2015/ doi:10.5194/hessd-12-4909-2015 © Author(s) 2015. CC Attribution 3.0 License.
|
School of Geography, The University of Melbourne, Parkville, Victoria, 3010, Australia State Key Laboratory for Estuarine and Coastal Research, East China Normal University, Shanghai 200062, China 3 College of Water Conservancy and Hydropower Engineering, Hohai University, Nanjing 210098, China
Published by Copernicus Publications on behalf of the European Geosciences Union.
|
4909
Discussion Paper
Correspondence to: M. Webber (
[email protected])
|
Received: 19 March 2015 – Accepted: 23 April 2015 – Published: 13 May 2015
A method for calculating the duration and intensity of salt intrusions M. Webber et al.
Title Page
Discussion Paper
1
2
12, 4909–4932, 2015
|
M. Webber1 , M. T. Li2 , J. Chen2 , B. Finlayson1 , D. Chen3 , Z. Y. Chen2 , M. Wang1 , and J. Barnett1
Discussion Paper
A method for calculating the duration and intensity of salt intrusions: the Yangtze River estuary
HESSD
Abstract
Introduction
Conclusions
References
Tables
Figures
J
I
J
I
Back
Close
Full Screen / Esc Printer-friendly Version Interactive Discussion
5
Discussion Paper |
4910
|
25
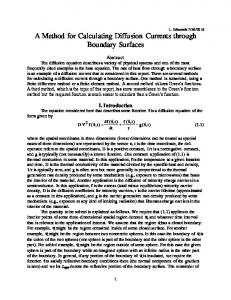
Shanghai’s industries and the more than 24 million people who live in the municipality now principally depend on the Yangtze River for their water supply. Yet, like other large estuaries (Gong, 2013), the estuary of the Yangtze River is affected by salt intrusions (Shen et al., 2003). The latest occurred in 2014 (CNTV 2014), the longest since 1993. So two storages have been built in the estuary to store water against the threat of salt intrusions (see Fig. 1 for locations): Chenhang reservoir supplies about 23 % of the municipality’s public water; Qingcaosha reservoir supplies about 54 % (Li et al. 2015b). Qingcaosha’s storage capacity is said to be equivalent to 67 days of Shanghai’s current
12, 4909–4932, 2015
A method for calculating the duration and intensity of salt intrusions M. Webber et al.
Title Page
Discussion Paper
20
Introduction
HESSD
|
1
Discussion Paper
15
|
10
Studies of intrusions of salt water into estuaries are typically constrained by both the short duration of discharge records and the paucity of observations of discharge and salinity. Thus studies of intrusions of salt water into estuaries typically seek to identify the conditions under which intrusions occur, using detailed observations for periods of 20–60 days. This paper demonstrates a method by which to identify the conditions under which intense intrusions of long duration occur and applies that method to the Yangtze River estuary. The paper constructs a model of the relationship between salinity and discharge and then employs Monte Carlo simulation methods to reconstruct the probability of observing intrusions of differing intensities and durations in relation to dis−1 charge. The model predicts that the duration of intrusions with chlorinity ≥250 mg L 3 −1 increases as the number of consecutive days with discharge ≤12 000 m s increases; consecutive days of discharges ≤8000 m3 s−1 predict the duration of intrusions with −1 chlorinity ≥400 or 500 mg L . In 26 of the 64 years analysed, the probability of an −1 intrusion of at least 60 days at ≥250 mg L is greater than 1 in 1000; in 17 years is greater than 1 in 100; and in ten years is greater than 1 in 10.
Discussion Paper
Abstract
Abstract
Introduction
Conclusions
References
Tables
Figures
J
I
J
I
Back
Close
Full Screen / Esc Printer-friendly Version Interactive Discussion
4911
|
12, 4909–4932, 2015
A method for calculating the duration and intensity of salt intrusions M. Webber et al.
Title Page
Discussion Paper | Discussion Paper
25
HESSD
|
20
Discussion Paper
15
|
10
Discussion Paper
5
consumption. The probability of long duration salt intrusions in the Yangtze estuary is thus of considerable social importance. Intrusions of salt in estuaries have been widely studied, by both numerical and theoretical methods. Most studies of the Yangtze estuary have been numerical (Kuang et al., 2009; Li et al., 2012; Liu et al., 2013; Xue et al., 2009). However, Zhang et al. (2011) have applied Savenije’s (1986, 1993) theoretical model. As Fig. 1 indicates, the Yangtze estuary is complex, with four outlets to the sea. Nevertheless, these studies confirm that salt water intrusions are primarily governed by a combination of low discharge and spring tide conditions, but are also influenced by wind speed and direction. The discharge of the Yangtze R is highly seasonal, with average discharges below 12 000 m3 s−1 in January and February, compared to over 40 000 m3 s−1 in June–August (Chen et al., 2013; Finlayson et al., 2013). In dry years, discharges in 3 −1 December through March are less than 12 500 m s (Wang et al., 2008). It is this period, December–March, in which intrusions are most likely to occur. When spring tides occur in December–March, intrusions are common: the lower the discharge and the higher the tide, the more intense the intrusion, especially when accompanied by strong south-easterly winds. The principal problem for these studies has been to examine the conditions under which oceanic water intrudes far up the estuary. They seek to predict an event – the −1 observation of water with chlorinity exceeding 250 mg L (ppm, equivalent to 0.45 on the Practical Salinity Scale), which is the Chinese standard for drinking water (National Standard GB 5749-2006). Since the usual treatment technologies in Shanghai’s water plants do not remove chlorides, it is also the standard for raw water that is to be processed into tap water (Surface Water Quality Standards GB 3838-2002). However, the duration of this event is also significant, especially for residents of Shanghai. An intrusion of a few days, no matter how intense, has little social significance, compared to an intrusion of a few months. Li et al. (2015a) demonstrate that the duration of intrusions is positively related to their intensity (chlorinity); unfortunately, Li et al. have only 11–13 data points to support this conclusion. Chen et al. (2013) also
Abstract
Introduction
Conclusions
References
Tables
Figures
J
I
J
I
Back
Close
Full Screen / Esc Printer-friendly Version Interactive Discussion
Method
|
This paper is statistical and predictive. We do not model the estuary dynamics, either theoretically or numerically, but estimate statistical relations between discharge and salinity to identify the probability of long duration salt intrusions. The paper draws on two principal sources of data. First, it employs published data about discharge and salinity for various periods to estimate the relationship between discharge and salinity. The salinity data refer to the Gaoqiao gauging station in the estuary (Fig. 1), the nearest station to Qingcaosha and
Discussion Paper
4912
|
25
12, 4909–4932, 2015
A method for calculating the duration and intensity of salt intrusions M. Webber et al.
Title Page
Discussion Paper
2
HESSD
|
20
Discussion Paper
15
|
10
Discussion Paper
5
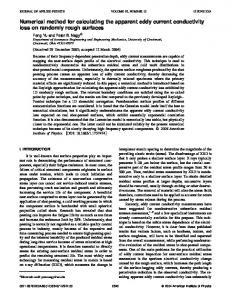
address duration, but they, like others (Chen et al., 2001; Gu and Yue, 2004; Wang et al., 2008; Yang, 2001; Zhao et al., 2009), identify a single threshold discharge below which intrusion is likely and above which intrusion is unlikely. In fact, salt intrusions may occur at a variety of discharges (Fig. 2), with a probability that varies inversely with discharge. The difficulty is that, while long discharge records for many rivers are generally available, measurements of salinity are not routinely collected by state agencies. Salinity thus needs to be measured for a specific purpose, such as a research project. Measurements of salinity are therefore expensive and not available in long records. It is thus important to find a method for using historical data about discharge to generalise the limited observations of salinity, and so obtain a long record of salinity, which identifies both the duration of a saline intrusion and the relative frequency of occurrence of such intrusions. It is this method that this paper presents, and then illustrates from the case of the Yangtze River estuary. This paper therefore addresses the following problems: how can the probability of long duration (up to 60 days) salt intrusions in the Yangtze estuary be identified? What is that probability? Subsequent questions, to be addressed in a later paper, concern the impact of increasing water abstraction from the Yangtze basin, increasing construction of hydro dams, climate change and sea level rise on this probability.
Abstract
Introduction
Conclusions
References
Tables
Figures
J
I
J
I
Back
Close
Full Screen / Esc Printer-friendly Version Interactive Discussion
|
in which the residuals, rt , are assumed to follow an inverse Gaussian distribution with autocorrelated variance structure, and α0 , . . ., α5 are parameters to be estimated. 4913
Discussion Paper
log Gt = α0 + α1 log Gt−1 + α2 (log Gt−1 )2 + α3 Qt−7 + α4 log Qt−7 + α5 (Qt−7 − Qt−8 ) + rt (2)
|
25
in which Gt , Gt−1 denote the salinity measure at Gaoqiao on day t and t − 1, respectively. Qt−7 denotes the discharge at Datong on day t − 7; at average discharges, it takes seven days for water to flow from Datong to Gaoqiao (Zhang et al., 2012). Such a model has a straightforward, intuitive meaning. Observations are numbered 1, 2, . . ., n within years, and the estimates are made through a generalised estimating equation (Garson, 2013). After testing a variety of functional forms for Eq. (1) and assumptions about the distribution of residuals, the specific estimated equation is:
12, 4909–4932, 2015
A method for calculating the duration and intensity of salt intrusions M. Webber et al.
Title Page
Discussion Paper
20
(1)
HESSD
|
Gt = function[Gt−1 , Qt−7 ],
Discussion Paper
15
|
10
Discussion Paper
5
are from Li et al. (2015a). The discharges are measured at Datong, the nearest gauging station which has a long record of discharge data. The observations refer to the periods 1 January 1979 through 30 April 1979 (120 observations); 13 February 1984 through 30 March 1984 (47 observations); 1 January 1987 through 17 April 1987 (107 observations); 24 January 1999 through 17 February 1999 (25 observations); 16 February 2007 through 4 March 2007 (17 observations). All 316 observations lie in periods in which the probability of low discharges and therefore of salt intrusions is high. Figure 2 illustrates the discharge and salinity conditions in these periods. These observations are neither logically nor statistically independent. They are not taken on a random sample of days between 1 January 1979 and 4 March 2007, and so are not logically independent. A casual observation of Fig. 2, confirmed by statistical tests, reveals that there is a pronounced lag structure to the salinity measures, so they are not statistically independent either. An appropriate estimate of the relationship between discharge and salinity must recognise this non-independence of the observations. Although an Artificial Neural Network could be constructed to model this relationship, we chose to estimate an equation of the form:
Abstract
Introduction
Conclusions
References
Tables
Figures
J
I
J
I
Back
Close
Full Screen / Esc Printer-friendly Version Interactive Discussion
4914
|
12, 4909–4932, 2015
A method for calculating the duration and intensity of salt intrusions M. Webber et al.
Title Page
Discussion Paper | Discussion Paper
25
HESSD
|
20
Discussion Paper
15
|
10
Discussion Paper
5
There are 312 usable observations, since the first day of each sequence is lost through the lag specification. There are four known sources of error in the data that have been used to construct this equation. First, unknown, but variable, amounts of water are extracted from the river or drain into the river between Datong and the salinity gauging station at Gaoqiao. Zhang et al. (2012) estimate that net abstractions are highest in periods of spring tide, in September, October and November and in years of drought (see also Dai et al., 2011). These differences are systematic, though with imperfectly understood characteristics, which create errors of estimation. Secondly, the influence of spring and neap tides is not included (Tong et al., 2010 illustrate these effects). However, the partial autocorrelation plots of the residuals from Eq. (2) do not reveal any significant autocorrelations beyond day 1. Third, there has been a rise in the long term level of the sea. Cai et al. (2009) estimate that the rate of relative sea level rise in the Yangtze −1 delta has been accelerating and in the past few decades was 6.6 mm yr . Over the period 1950–2010, this implies a rise of up to 40 cm, which may influence the probability of an intrusion at any given discharge. Fourth are errors of measurement within and differences in methods between the data sources, which are not known. The second data set consists of the record of daily discharges at Datong. These are available for the period 1950 through 2007 from the published yearbooks of the Changjiang Water Commission, with gaps that were kindly infilled by Klaus Fraedrich, and from 2004 through 30 September 2014 at the website of the Changjiang Shuiwei Guangli Xitong (Changjiang Water Level Management System, http://yu-zhu.vicp.net/). The record is converted from calendar years into “river years”, which run from 1 August for 305 days; in a normal year, the sequence ends on 1 June; in a leap year on 31 May. Intrusions have never been observed in June and July. Once the parameters of Eq. (2) were estimated, those parameters and the distribution of residuals were used to create 1024 simulations of the corresponding salinities for each year t, using random numbers generated from the inverse Gaussian distribution of the estimated residuals, rt . Thus, from the simulations we can then calculate for a year with the discharge characteristics
Abstract
Introduction
Conclusions
References
Tables
Figures
J
I
J
I
Back
Close
Full Screen / Esc Printer-friendly Version Interactive Discussion
| Discussion Paper
10
Discussion Paper
5
of year t, the probability of observing 1, 2, . . ., n consecutive days with salinity above the critical values of 250 mg L−1 (the upper limit of drinking water, according to the standard), 400 and 500 (values chosen to reflect the possibility of building water plants in Shanghai that can treat saline water to obtain drinking water). Repeating this calculation for each year provides the critical information which this paper seeks to present. The analysis concludes by illustrating the discharge characteristics of years in which the simulations reveal that the probability of long duration intrusions is high. The principal limitation of this analysis is the short duration of the time series of daily flows. There are only 64 river years of data from 1 January 1950 to 30 September 2014. Long periods of saline intrusion are relatively rare events, perhaps occurring no more than five times per century, so this record is clearly an insufficient basis from which to draw robust conclusions about the relationship between low frequency, long duration intrusions and river discharge.
HESSD 12, 4909–4932, 2015
A method for calculating the duration and intensity of salt intrusions M. Webber et al.
Title Page
|
3
|
4915
Discussion Paper
25
|
20
The model estimates and goodness of fit criteria are contained in Table 1. The effect of all variables is significant at p < 0.05, and the likelihoods are appropriately low. At the ranges of discharges to which the model was fit (6500 ≤ discharge < 16 000) salinity is negatively associated with discharge and positively associated with the previous day’s salinity. The proportion of the variance in log G that is accounted for by the model is 0.8893. Residuals are not significantly different from normal, according to a onesample Kolmogorov–Smirnov test; furthermore, the residuals are not correlated with the predicted values and their variance is approximately constant (Fig. 3). The model predicts a close relation between discharge and mean salinity, especially 3 −1 when discharge falls for long periods below about 10 000 m s . In 43 of the 64 years, the model predicts that there were periods in which mean salinity exceeded 250 mg L−1 , ranging in length from 1 through 97 days; in 30 years there were periods in which mean −1 salinity is predicted to have exceeded 400 mg L , ranging in length from 1 through
Discussion Paper
15
Results I: discharge and salinity
Abstract
Introduction
Conclusions
References
Tables
Figures
J
I
J
I
Back
Close
Full Screen / Esc Printer-friendly Version Interactive Discussion
Results II: discharge and intrusions
Discussion Paper
4
|
10
Discussion Paper
5
80 days; and in 25 years there were periods in which mean salinity is predicted to have −1 exceeded 500 mg L , ranging in length from 1 through 70 days (Fig. 4). The model predicts that in ten years – 1955, 1956, 1958, 1962, 1966, 1967, 1971, 1978, 1979 −1 and 1986, mean salinities of over 500 mg L lasted more than 30 days. The model suggests that the Changjiang has become less liable to long duration intense intrusions since 1986: no mean salinity of more than 500 mg L−1 is predicted to have exceeded ten days since then. However, the complete model is probabilistic, with a frequency distribution of residuals around these mean predictions, as illustrated in Fig. 3, so it is important to use these probabilistic predictions in order to understand the probability of encountering long duration intense intrusions under the discharge characteristics of the various years in the sample.
HESSD 12, 4909–4932, 2015
A method for calculating the duration and intensity of salt intrusions M. Webber et al.
Title Page
4916
|
| Discussion Paper
25
Discussion Paper
20
|
15
This model, with its known frequency distribution of residuals (Fig. 3), is therefore used to simulate salinity intrusions. These simulations follow Monte Carlo methods, in which the frequency distribution of residuals is repeatedly sampled, in conjunction with the other parameters of Eq. (2), in order to identify the probability that intrusions of given intensities and durations will occur. The results are first illustrated in detail for 1962, the year with the longest duration intense intrusion on record. Figure 5 reveals the frequencies with which salinities of 250, 400 and 500 mg L−1 for different lengths of time were observed in the simulations. Superimposed on the frequencies is a Weibull distribution, fitted by least squares. The most common intrusion of 250 mg L−1 lasts for 74 days, but even intrusions of at least 91 days occur with a probability of 0.05 and of at least 97 days occur with probability of 0.01. An intrusion of at least 73 days is as likely to occur as not. The most common intrusion of 400 mg L−1 lasts 67 days, while intrusions of at least 77 days have a probability of occurring of 0.05 and of at least 85 days occur with a probability of 0.01. Intrusions of 55 days are as likely to occur as not. The most −1 common length of an intrusion of 500 mg L is 67 days, but intrusions of 69 days occur
Abstract
Introduction
Conclusions
References
Tables
Figures
J
I
J
I
Back
Close
Full Screen / Esc Printer-friendly Version Interactive Discussion
4917
|
12, 4909–4932, 2015
A method for calculating the duration and intensity of salt intrusions M. Webber et al.
Title Page
Discussion Paper | Discussion Paper
25
HESSD
|
20
Discussion Paper
15
|
10
Discussion Paper
5
with a probability of 0.05 and of 77 days occur with a probability of 0.01. Intrusions of 47 days are as likely to occur as not. These are the model predictions of the duration of salinity intrusions for years in which the discharge characteristics are those of 1962. Similar calculations have been made to determine the probability of occurrence of −1 various durations of intrusions of 250, 400 and 500 mg L for every other year. Table 2 provides the simple correlations between the simulated frequencies of three durations (30, 50 and 60 days) and a variety of characteristics of discharge for all the years of −1 record. The probability that in a year chlorinity ≥ 250 mg L for at least 30 days consecutively is correlated with a variety of measures of low flow, especially the number 3 −1 of days for which discharge ≤ 12 000, 10 000 or 8000 m s . However, the probabili−1 ties of longer duration intrusions of ≥ 250 mg L and the probabilities of higher salinity intrusions are best predicted by measures of the number of days for which dis3 −1 charge ≤ 8000 m s . Across all the durations and chlorinity levels, the best predictor of the probabilities of duration-chlorinity pairs is the maximum number of consecutive 3 −1 days for which discharge falls below 8000 m s . Worringly for planners, no measures of discharge before the event predict long duration, high intensity intrusions. Figure 6 reveals in more detail how the probability of observing duration–chlorinity 3 −1 pairs depends on the duration of discharge less than 8000 m s . These graphs are the central results at which this method is aimed. The upper graph in Fig. 6 illustrates how the probability of 30, 40 and 50 day intrusions of ≥ 250 mg L−1 in a year varies in relation to the number of consecutive days in that year in which discharge ≤ 8000 m3 s−1 . If there are no such days in a year, then −1 the probability of there occuring at least 30 days with chlorinity ≥ 250 mg L varies between 0 and 0.4; in fact, only if there are at least 20 consecutive days in a year 3 −1 with discharge ≤ 8000 m s does the probability of there occuring at least 30 days with chlorinity ≥ 250 mg L−1 rise above 0.025. As the number of consecutive days in a year with discharge ≤ 8000 m3 s−1 rises from 0 to 20, the probability of there occuring at least 30 days with chlorinity ≥ 250 mg L−1 rises to 0.55–0.9. When the number 3 −1 of consecutive days in a year with discharge ≤ 8000 m s rises to 30 and then to
Abstract
Introduction
Conclusions
References
Tables
Figures
J
I
J
I
Back
Close
Full Screen / Esc Printer-friendly Version Interactive Discussion
5
Discussion Paper |
Unlike previous studies of intrusions of salt water into the estuary of the Yangtze River, this paper has sought to identify the conditions under which intense intrusions of long duration occur. Constrained by both the shortage of the discharge record and the 4918
|
25
Discussion
12, 4909–4932, 2015
A method for calculating the duration and intensity of salt intrusions M. Webber et al.
Title Page
Discussion Paper
5
HESSD
|
20
Discussion Paper
15
|
10
Discussion Paper
−1
40–50, the probability of there occuring at least 30 days with chlorinity ≥ 250 mg L −1 is 0.9 and 0.99, respectively. Longer duration intrusions of chlorinity ≥ 250 mg L are also closely related to the number of consecutive days with discharge ≤ 8000 m3 s−1 . If in a year the number of such days is less than eight, then 50 or 60 day intrusions of chlorinity ≥ 250 mg L−1 have probability less than 0.2; when the number of such days is −1 between nine and 30, then the probability of 50 days of ≥ 250 mg L lies between 0.1 and 0.5 and of 60 days lis between 0.1 and 0.3. The central graph in Fig. 6 illustrates how intrusions of chlorinity ≥ 400 mg L−1 vary in relation to the number of consecutive days in a year with discharge ≤ 8000 m3 s−1 , while the lower graph illustrates the same information for intrusions of ≥ 500 mg L−1 . In both cases, the probability of 30 day intrusions rises linearly as the number of consecutive low discharge days increases. In both cases, too, the probability of a longer intrusion (50 or 60 days) is less than 0.1 unless the number of consecutive days in a year with discharge ≤ 8000 m3 s−1 exceeds 30. In the record there are no years in which the number of consecutive days in a year with discharge ≤ 8000 m3 s−1 lay between 30 and 40; but in the two years in which more than 44 consecutive days ex3 −1 −1 hibited discharge ≤ 8000 m s , the probability of 50 or 60 day, chlorinity ≥ 400 mg L intrusions lay between 0.5 and 0.7 or lay between 0.25 and 0.5, respectively. The probability of 50 or 60 day, ≥ 500 mg L−1 intrusions is a little lower; even so, the probability of 50 day intrusions of chlorinity ≥ 500 mg L−1 is 0.25 or 0.47 if a year has 44 or 50, re3 −1 spectively, consecutive days with discharge ≤ 8 000 m s . This event occurred twice in the 64 year long record. This information is summarised in Table 3.
Abstract
Introduction
Conclusions
References
Tables
Figures
J
I
J
I
Back
Close
Full Screen / Esc Printer-friendly Version Interactive Discussion
4919
|
12, 4909–4932, 2015
A method for calculating the duration and intensity of salt intrusions M. Webber et al.
Title Page
Discussion Paper | Discussion Paper
25
HESSD
|
20
Discussion Paper
15
|
10
Discussion Paper
5
paucity of observations of discharge and salinity, the paper has constructed a model of the relationship between salinity and discharge and then employed Monte Carlo simulation methods to reconstruct the probability of observing intrusions of differing intensities and durations in relation to discharge. The model predicts that the dura−1 tion of intrusions with chlorinity ≥ 250 mg L increases as the number of consecutive 3 −1 days with discharge ≤ 12 000 m s increases; consecutive days of lower discharges (≤ 8000 m3 s−1 ) predict the duration of intrusions with chlorinity ≥ 400 or 500 mg L−1 . In 51 of the 64 years analysed, the probability of an intrusion of at least 30 days at −1 chlorinity ≥ 250 mg L is greater than 1 in 1000; in 37 years, is greater than 1 in 100; and in 15 years it is greater than 1 in 10. In 26 years, the probability of an intrusion of at least 60 days at ≥ 250 mg L−1 is greater than 1 in 1000; in 17 years is greater than 1 in 100; and in ten years is greater than 1 in 10. −1 In 26 years, the probability of an intrusion of at least 30 days at chlorinity ≥ 500 mg L is greater than 1 in 1000, in 19 years it is greater than 1 in 100; and in 10 years it is greater than 1 in 10. The most extreme event analysed in this paper, an intrusion of ≥ 500 mg L−1 for more than 60 days occurs with a probability greater than 1 in 1000 in 6 years, and is greater than 1 in 100 and 1 in 10 in only one year. Typically, estimates in the literature of discharges at which salinity intrusions occur in the Yangtze estuary are point estimates: they seek to identify a discharge below which intrusions are likely and above which intrusions are unlikely. Serious intrusions occurred near Chenhang Reservoir in 1978–1979, 2001–2002 and 2006–2007, when the maximum average monthly discharges in January and February were 7 103 m3 s−1 , 10 165 m3 s−1 and 11 777 m3 s−1 , respectively, leading Chen et al. (2013) to suggest 3 −1 that the critical discharge into the estuary is at least 11 777 m s . Gu and Yue (2004) 3 −1 suggested that a monthly mean Datong discharge of 11 000 m s was critical and 3 −1 Wang et al. (2008) identified 13 000 m s . Data in Li et al. (2015a) demonstrate that mean salinity levels near Qingcaosha are a negative exponential function of discharge at Datong seven days earlier; at discharges less than 11 500 m3 s−1 , mean salinity −1 exceeds 250 mg L . These results are broadly consistent with those reported in this
Abstract
Introduction
Conclusions
References
Tables
Figures
J
I
J
I
Back
Close
Full Screen / Esc Printer-friendly Version Interactive Discussion
| Discussion Paper
10
Discussion Paper
5
paper, though the estimate of Wang et al. (2008) is high. However, they are misleading in the sense that there is no critical discharge: at all discharges ≤ 16 000 m3 s−1 , the lower the discharge and the longer that low flow persists, the higher the probability of longer and more intense salt intrusions. The relationship between discharge and salinity is probabilistic as well as continuous. Nevertheless, the literature does identify other conditions besides discharge that affect the occurrence of salt intrusions, notably tide and wind conditions (Kuang et al., 2009; Li et al., 2012; Liu et al., 2013; Xue et al., 2009; Zhang et al., 2011). Zhang et al. (2012) also demonstrate that water abstractions from the Yangtze River below the gauging station at Datong are a significant proportion of total discharge, especially if years of relatively low discharge are also years of low rainfall in the estuary region. These are factors that an analysis of discharge data for the entire period 1950–2014 cannot take into account.
HESSD 12, 4909–4932, 2015
A method for calculating the duration and intensity of salt intrusions M. Webber et al.
Title Page
|
6
|
4920
Discussion Paper
25
|
20
This paper has demonstrated a method for calculating the probability of occurrence of long duration salt intrusions of specified chlorinity. The method shows that relationship between discharge and the intensity and duration of salinity intrusions is prob3 −1 abilistic and continuous. At discharges ≤ 16 000 m s , the lower the discharge and the longer that low flow persists, the higher the probability of longer and more intense salt intrusions. Combining this result with the known frequency of periods of low discharge during the period 1950–2014, the paper calculates that saline intrusions −1 (chlorinity ≥ 250 mg L ) of at least 30 days occur with p ≥ 0.01 in 37/64 years and with −1 p ≥ 0.1 in 15/64 years. Saline intrusions (chlorinity ≥ 250 mg L ) of at least 60 days occur with p ≥ 0.01 in 17/64 years and with p ≥ 0.1 in 10 years. Intrusions that can disrupt the supply of water to Shanghai’s residents are not rare events. However, the discharge and tidal characteristics of the Yangtze estuary are now being modified. Water is increasingly being abstracted from the river, for the South–North
Discussion Paper
15
Conclusion
Abstract
Introduction
Conclusions
References
Tables
Figures
J
I
J
I
Back
Close
Full Screen / Esc Printer-friendly Version Interactive Discussion
Discussion Paper
Acknowledgements. The authors gratefully acknowledge ARC research grant DP DP110103381, which supported the research reported in this paper. They are grateful to Klaus Fraedrich (University of Hamburg), Ma Ji and Xiong Xianzhe (University of Melbourne), who kindly supplied some of the data.
|
10
Discussion Paper
5
Transfer Project as well as for more local uses (Chen, 2013; Zhang et al., 2012), tending to increase the length and the intensity of periods of low discharge (Li et al., 2015a). Sea levels are rising on account of both global warming and the sinking of the Yangtze delta (Cai et al., 2009), which has an effect on intrusions that is equivalent to reductions in discharge. Finally, the Yangtze River is increasingly being dammed for large hydro-electric projects, that cumulatively can now store about 25 % of the annual flow; this capacity is planned to double by 2050 (Li et al., 2000). As hydro-electric dams, these constructions have limited effects on annual discharge, but do affect its seasonal distribution (Finlayson et al., 2013). All of these modifications will affect the probability of salt intrusions in the estuary and it is important to calculate their effects.
HESSD 12, 4909–4932, 2015
A method for calculating the duration and intensity of salt intrusions M. Webber et al.
Title Page
|
20
|
4921
Discussion Paper
Cai, F., Su, X. Z., Liu, J. H., Li, B., and Lei, G.: Coastal erosion in China under the condition of global climate change and measures for its prevention, Prog. Nat. Sci., 19, 415–426, 2009. Chen, D., Webber, M., Finlayson, B., Barnett, J., Chen, Z. Y., and Wang, M.: Impact of water transfers from the lower Yangtze River on water security in Shanghai, Appl. Geogr., 45, 303– 310, 2013. Chen, X., Zong, Y., Zhang, E., Xu, J., and Li, S.: Human impacts on the Changjiang (Yangtze) River basin, China, with special reference to the impacts on the dry season water discharges into the sea, Geomorphology, 41, 111–123, 2001. Dai, Z. J., Chu, A., Stive, M., Zhang, X. L., and Yan, H.: Unusual salinity conditions in the Yangtze esuary in 2006: impacts of an extreme drought or of the Three Gorges Dam?, Ambio, 40, 496–505, 2011. Finlayson, B. L., Barnett, J., Wei, T. Y., Webber, M., Li, M. T., Wang, M. Y., Chen, J., Xu, H., and Chen, Z. Y.: The drivers of risk to water security in Shanghai, Reg. Environ. Change, 13, 329–340, 2013.
|
25
References
Discussion Paper
15
Abstract
Introduction
Conclusions
References
Tables
Figures
J
I
J
I
Back
Close
Full Screen / Esc Printer-friendly Version Interactive Discussion
4922
|
| Discussion Paper
30
12, 4909–4932, 2015
A method for calculating the duration and intensity of salt intrusions M. Webber et al.
Title Page
Discussion Paper
25
HESSD
|
20
Discussion Paper
15
|
10
Discussion Paper
5
Garson, G. D.: Generalized Linear Models/Generalized Estimating Equations, Statistical Publishing Associates, Asheboro, NC, 2013. Gong, W. P., Shen, J., and Jia, L. W.: Salt intrusion during the dry season in the Huangmaohai Estuary, Pearl River Delta, J. Marine Syst., 111–112, 235–252, 2013. Gu, Y. and Yue, Q.: Analysis and prediction of saltwater intrusion in Chenhang water source region in Yangtze River estuary, Public Utilities, 18, 19–20, 2004. Kuang, C. P., Sun, B., and Liu, S. G.: Approach of moving boundary and its application in 3D tidal current simulation of Changjiang River estuary based on ECOMSED model, Acta Oceanol. Sin., 28, 78–85, 2009. Li, C. A., Yin, H. F., and Yu, L. Z.: Silt transform characteristics and latent effect on fluvial system environment in Yangtze River, Resources and Environment in the Yangtze Basin , 9, 504–509, 2000 (in Chinese with English abstract). Li, L., Zhu, J. R., and Wu, H.: Impacts of wind stress on saltwater intrusion in the Yangtze estuary, Science China – Earth Sciences , 55, 1178–1192, 2012. Li, M. T., Chen, Z. Y., Finlayson, B., Wei, T., Chen, J., Wu, X., Xu, H., Webber, M., Barnett, J., and Wang, M.: Water diversion and sea-level rise: potential threats to freshwater supplies in the Changjiang River estuary, Estuar. Coast. Shelf S., 156, 52–60, 2015a. Li, M. T., Finlayson, B., Webber, M., Barnett, J., Webber, S., Rogers, S., Chen, Z. Y., Wei, T. Y., Chen, J., Wu, X. D., and Wang, M.: Water quantity and water quality: vulnerability of Shanghai’s public water supply, in press, 2015b. Liu, S., Zhong, G., Kuang, C., Sun, B, Gou, H., and Huang, W.: Effects of South-to-North Water Transfer Project on salinity intrusion in Yangtze estuary, Coastal Hazards , 2013, 119–128, doi:10.1061/9780784412664.012, 2013. Savenije, H. H. G.: A one-dimensional model for salinity intrusion in alluvial estuaries, J. Hydrol., 85, 87–109, 1986. Savenije, H. H. G.: Predictive model for salt intrusion in estuaries, J. Hydrol., 148, 203–218, 1993. Shen, H. T., Mao, Z. C., and Zhu, J. R.: Saltwater Intrusion in the Changjiang Estuary, China Ocean Press, Beijing, 2003 (in Chinese with English summary). Tong, C. F., Zheng, J. H., Zhang, C., and Guilbaud, C.: Salinity response to the runoff from Yangtze River basin at Qingcaosha reservoir area in Yangtze estuary, in: Proceedings ASME 2010 29th International Conference on Ocean, Offshore and Arctic Engineering OMAE2010, Volume 4, Shanghai, 6–11 June 2010, 2010.
Abstract
Introduction
Conclusions
References
Tables
Figures
J
I
J
I
Back
Close
Full Screen / Esc Printer-friendly Version Interactive Discussion
Discussion Paper
15
|
10
Discussion Paper
5
12, 4909–4932, 2015
A method for calculating the duration and intensity of salt intrusions M. Webber et al.
Title Page
Discussion Paper | Discussion Paper |
4923
HESSD
|
Wang, Y. G., Huang, H. M., and Li, X.: Critical discharge at Datong for controlling operation of South-to-North Water Transfer Project in dry seasons, Water Science and Engineering , 1, 47–58, 2008. Xue, P. C., Chen, P., Ding, R. C., Beardsley, H., Lin, H., Ge, J., and Kong, Y.: Saltwater intrusion into the Changjiang River: a model-guided mechanism study, J. Geophys. Res., 114, C02006, doi:10.1029/2008JC004831, 2009. Yang, G.: Impacts of the construction of key water conservancy projects in the Yangtze River and sea level rise on water quality of Shanghai water intake, Acta Geographica Sinica , 21, 123–129, 2001. Zhang, E. F., Savenije, H. H. G., Wu, H., Kong, Y. Z., and Zhu, J. R.: Analytical solution for salt intrusion in the Yangtze Estuary, China, Estuar. Coast. Shelf S., 91, 492–501, 2011. Zhang, E. F., Savenije, H. H. G., Chen, S. L., and Chen, J. Y.: Water abstraction along the lower Yangtze River, China, and its impact on water discharge into the estuary, Phys. Chem. Earth, 47–48, 76–85, 2012. Zhao, R., Yang, Z., Sun, T., Chen, B., and Chen, G.: Freshwater inflow requirements for the protection of the critical habitat and the drinking water sources in the Yangtze River Estuary, China, Commun. Nonlinear Sci., 14, 2507–2518, 2009.
Abstract
Introduction
Conclusions
References
Tables
Figures
J
I
J
I
Back
Close
Full Screen / Esc Printer-friendly Version Interactive Discussion
Discussion Paper |
Parameter
1.761 0.0148 0.0069 0.0087 0.0032 −5
1.59 × 10 0.208 −5 1.15 × 10 0.0185 0.002
95 % Wald Confidence Interval Lower Upper
Hypothesis test Wald Chi-square
df
1.471 −0.044 −0.080 −0.102 0.004
7.814 0.972 95.507 95.230 10.084
1 1 1 1 1
0.005 0.324 < 0.001 < 0.001 0.001
4.042 5.405 6.562 141.042 17.497
1 1 1 1 1
0.044 0.020 0.010 < 0.001 < 0.001
8.374 0.014 −0.054 −0.068 0.016 −7
8.04 × 10 −0.890 −6 6.94 × 10 0.184 −0.012
−5
6.32 × 10 −0.076 −5 5.21 × 10 0.256 −0.004
Discussion Paper |
4924
A method for calculating the duration and intensity of salt intrusions M. Webber et al.
Title Page
|
Set to zero, as parameter is redundant. Corrected Quasi Likelihood Goodness of Fit: 20.341.
Significance
Discussion Paper
∗
4.923 −0.015 −0.067 −0.085 0.010 ∗ 0 −5 3.20 × 10 −0.483 −5 2.95 × 10 0.220 −0.008 0.001
Std Error
12, 4909–4932, 2015
|
Intercept Year = 1979 Year = 1984 Year = 1987 Year = 1999 Year = 2007 Qd Log Qd Qd Diff Log Glag Log Glag2 Scale
B
Discussion Paper
Table 1. Parameter estimates and goodness of fit.
HESSD
Abstract
Introduction
Conclusions
References
Tables
Figures
J
I
J
I
Back
Close
Full Screen / Esc Printer-friendly Version Interactive Discussion
Chlorinity > 250 for > (days) 30 50 60
Chlorinity > 400 for > (days) 30 50 60
Chlorinity > 500 for > (days) 30 50 60
Aug–May av Qd Dec–Mar av Qd Nov av Qd Dec av Qd Dec–Feb av Qd Jan–Feb av Qd No days Qd < 16 000 NC days Qd < 16 000 Av flow Qd < 16 000 No days Qd < 14 000 NC days Qd < 14 000 Av flow Qd < 14 000 No days Qd < 12 000 NC days Qd < 12 000 Av flow Qd < 12 000 No days Qd < 10 000 NC days Qd < 10 000 Av flow Qd < 10 000 No days Qd < 8000 NC days Qd < 8000 Av flow Qd < 8000
−0.42 d −0.64 −0.23 −0.49 d −0.66 −0.66d 0.36 0.52 −0.63d 0.43 d 0.62 c −0.077 0.58 0.80b −0.87b b 0.80 0.91a b −0.81 0.88b b 0.83 −0.19
−0.40 −0.48 −0.27 −0.39 −0.50 −0.48 0.34 0.40 −0.45 0.33 0.43 −0.57 0.41 0.60d −0.68d 0.59 0.73c c −0.70 a 0.93 a 0.94 −0.43
−0.37 −0.43 −0.23 −0.33 −0.43 −0.41 0.34 0.36 −0.36 0.31 0.37 −0.48 0.36 0.52 −0.59 0.52 0.65d d −0.61 0.88b a 0.92 −0.43
|
Indicator
Discussion Paper
Table 2. Correlations between probabilities of chlorinity above stated levels for stated lengths of time and selected discharge characteristics, annual scale.
−0.24 −0.29 −0.09 −0.10 −0.23 −0.27 0.26 0.26 −0.22 0.23 0.24 −0.29 0.24 0.34 −0.40 0.34 0.40 −0.39 0.68d 0.77 −0.38
−0.15 −0.24 −0.04 −0.04 −0.17 −0.22 0.19 0.22 −0.20 0.19 0.20 −0.24 0.20 0.29 −0.33 0.30 0.32 −0.33 0.57 0.69 −0.37
|
4925
Discussion Paper
Note: the average flows for Qd < 16 000, 12 000, 10 000 or 8000 are computed for the period from the first discharge < the stated value to the last discharge < this value. NC: number of consecutive days. a Absoloute value r ≥ 0.90. b Absoloute value r ≥ 0.80. c Absoloute value r ≥ 0.70. d Absoloute value r ≥ 0.60.
A method for calculating the duration and intensity of salt intrusions M. Webber et al.
Title Page
|
−0.21 −0.27 −0.08 −0.07 −0.21 −0.25 0.24 0.25 −0.21 0.22 0.22 −0.27 0.22 0.32 −0.38 0.33 0.38 −0.38 0.65d c 0.76 −0.38
Discussion Paper
−0.28 −0.32 −0.13 −0.15 −0.28 −0.31 0.30 0.29 −0.25 0.25 0.26 −0.33 0.26 0.38 −0.45 0.38 0.47 −0.46 0.76c b 0.84 −0.40
12, 4909–4932, 2015
|
−0.36 −0.42 −0.20 −0.26 −0.40 −0.42 0.34 0.36 −0.35 0.31 0.37 −0.46 0.36 0.52 −0.58 0.50 0.62d −0.59 0.89b a 0.90 −0.33
Discussion Paper
−0.39 −0.49 −0.25 −0.38 −0.50 −0.49 0.34 0.40 −0.44 0.34 0.44 −0.57 0.42 0.61d −0.68 d 0.60 0.74c d −0.69 0.94a a 0.92 −0.33
HESSD
Abstract
Introduction
Conclusions
References
Tables
Figures
J
I
J
I
Back
Close
Full Screen / Esc Printer-friendly Version Interactive Discussion
Average probability of −1 intrusion ≥ 250 mg L lasting 30 days 50 days 60 days
0 days 1–7 days 8–17 days 19–29 days 44–50 days
42 7 10 3 2
0.050 0.289 0.703 0.910 0.998
0.004 0.034 0.261 0.431 0.916
0.001 0.011 0.129 0.168 0.792
42 7 10 3 2
0.003 0.041 0.267 0.585 0.944
0.00 0.001 0.030 0.062 0.590
0.00 0.00 0.007 0.010 0.343
Average probability of intrusion ≥ 500 mg L−1 lasting 30 days 50 days 60 days
|
42 7 10 3 2
0.001 0.024 0.143 0.361 0.853
0.00 0.00 0.003 0.00 0.173
|
4926
0.00 0.001 0.012 0.014 0.360
Discussion Paper
0 days 1–7 days 8–17 days 19–29 days 44–50 days
A method for calculating the duration and intensity of salt intrusions M. Webber et al.
Title Page
Discussion Paper
0 days 1–7 days 8–17 days 19–29 days 44–50 days
12, 4909–4932, 2015
|
Average probability of intrusion ≥ 400 mg L−1 lasting 30 days 50 days 60 days
Discussion Paper
No. of years with this duration discharge
|
Duration of period discharge ≤ 8000 m3 s−1
Discussion Paper
Table 3. Probability of intrusion duration and intensity in relation to length of periods of low discharge.
HESSD
Abstract
Introduction
Conclusions
References
Tables
Figures
J
I
J
I
Back
Close
Full Screen / Esc Printer-friendly Version Interactive Discussion
121˚
Discussion Paper
120˚E
122˚ N
|
32˚N
an
Discussion Paper
Y
gz i Ch
Riv
ong
er
min
Riv
East China
pu ang
Hangzhou Bay
Sea
Highland Delta plain Lake 0
20 km
31˚
| Discussion Paper
Figure 1. Map of the Yangtze estuary.
|
4927
A method for calculating the duration and intensity of salt intrusions M. Webber et al.
Title Page
Discussion Paper
Hu
Changxing I.
12, 4909–4932, 2015
|
SHANGHAI
Taihu
Qingcaosha
er
Chenghang
g I.
HESSD
Abstract
Introduction
Conclusions
References
Tables
Figures
J
I
J
I
Back
Close
Full Screen / Esc Printer-friendly Version Interactive Discussion
2500 15000
2000 1500
10000
1000
5000 0
20
40
60
80
100
120
140
0
5
0 10 15 20 25 30 35 40 45 50
25000
3500
20000
3000 2500
15000
2000
10000
1500
5000
1000 500 20
40
60
80
100
120
Days from 2 January 1987
3500 3000
20000
2500
10000
1500 1000
5000
500 2
4
6
8
10
12
15
20
25
14
16
0 18
Key Discharge Chlorinity
Days from 17 February 2007
Figure 2. Salinity and discharge conditions in the periods of observation.
|
4928
0 30
Discussion Paper
2000
0
10
|
15000
0
5
Days from 25 January 1999
25000 Discharge (cumecs)
0
Chlorinity at Gaoqiao (mg/L)
0
12, 4909–4932, 2015
A method for calculating the duration and intensity of salt intrusions M. Webber et al.
Title Page
Discussion Paper
0
HESSD
|
Discharge (cumecs)
Days from 14 February 1984
Discussion Paper
Days from 1 January 1979
|
0
500
Chlorinity at Gaoqiao (mg/L)
3000
20000
Chlorinity at Gaoqiao (mg/L)
Discharge (cumecs)
3500
Discussion Paper
25000
Abstract
Introduction
Conclusions
References
Tables
Figures
J
I
J
I
Back
Close
Full Screen / Esc Printer-friendly Version Interactive Discussion
Discussion Paper
HESSD 12, 4909–4932, 2015
| Discussion Paper
A method for calculating the duration and intensity of salt intrusions M. Webber et al.
Title Page
| Discussion Paper |
Figure 3. Distribution of residuals, with Weibull fit. Note: one-sample Kolmogorov–Smirnov test: most extreme deviation = 0.044; asymptotic significance = 0.200, after Lilliefors correction.
Discussion Paper |
4929
Abstract
Introduction
Conclusions
References
Tables
Figures
J
I
J
I
Back
Close
Full Screen / Esc Printer-friendly Version Interactive Discussion
Discussion Paper |
45
30 25 20
12, 4909–4932, 2015
A method for calculating the duration and intensity of salt intrusions M. Webber et al.
Title Page
15
|
Frequency of years
35
Discussion Paper
≥250 mg/L ≥400 mg/L ≥500 mg/L
40
HESSD
5 0
0
1-10 11-20 21-30 31-40 41-50 51-60 61-70 71-80 81-90 91-100 Number of days with chlorinity above stated level
Discussion Paper
10
| |
4930
Discussion Paper
Figure 4. Frequency distribution of years, classified by number of days with high chlorinity.
Abstract
Introduction
Conclusions
References
Tables
Figures
J
I
J
I
Back
Close
Full Screen / Esc Printer-friendly Version Interactive Discussion
Discussion Paper
HESSD 12, 4909–4932, 2015
| Discussion Paper
A method for calculating the duration and intensity of salt intrusions M. Webber et al.
Title Page
| Discussion Paper | |
4931
Discussion Paper
Figure 5. Frequency distributions of numbers of consecutive days with chlorinity above 250 (upper left), 400 (upper right) and 500 (lower left) mg L−1 , fitted with Weibull distributions, 1962 data.
Abstract
Introduction
Conclusions
References
Tables
Figures
J
I
J
I
Back
Close
Full Screen / Esc Printer-friendly Version Interactive Discussion
Discussion Paper
1.0 0.9 Probability of event
0.8 0.7 0.6 0.5 0.4
Chlorinity over 250
0.3 0.1 10
20
30
40
50
60
Number of consecutive days, discharge < 8 000 cumecs
1.0 0.9 0.7
Chlorinity over 400 30 days 50 days 60 days
0.6 0.5 0.4 0.2
10
20
30
40
50
60
Nmber of consecutive days, discharge < 8 000 cumecs
1.0
0.7 0.6
30 days 50 days 60 days
0.5
|
0.4 0.3 0.2 0.1 0.0 0
10
20
30
40
50
60
Number of consecutive days, discharge < 8 000 cumecs
Figure 6. Relationship between long duration, high intensity intrusions and duration of low discharges.
|
4932
Discussion Paper
Probability of event
0.8
Chlorinity over 500
Discussion Paper
0.1
0.9
A method for calculating the duration and intensity of salt intrusions M. Webber et al.
Title Page
0.3
0.0 0
12, 4909–4932, 2015
|
Probability of event
0.8
Discussion Paper
0.0 0
|
30 days 50 days 60 days
0.2
HESSD
Abstract
Introduction
Conclusions
References
Tables
Figures
J
I
J
I
Back
Close
Full Screen / Esc Printer-friendly Version Interactive Discussion