Abstract â Factor analysis has been pursued as a means to decompose dynamic cardiac PET images into different tissue types based on their unique ...
A Minimal Factor Overlap Method for Resolving Ambiguity in Factor Analysis of Dynamic Cardiac PET R. Klein, M. Bentourkia, R.S. Beanlands, A. Adler, R. deKemp
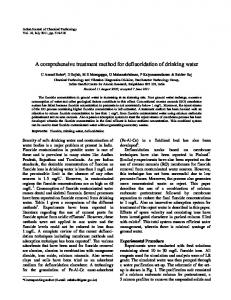
TABLE 1 – Resolved Simulated Factors
Blood
MSO
MFO
Factor
Source
Factor
F
Myocardium
I. INTRODUCTION actor analysis techniques have been explored as a means to improve cardiac function quantification. An image series is decomposed into a finite number of temporal factors and their corresponding spatial distribution (structures) which ideally should correspond to the physiology of the imaged tissue [1]. The decomposition may be expressed in matrix form as Y = FS+E, Where Y is the dynamic image sequence (the pixels of each time frame in a row), the columns of F contain the time-activity profiles of the factors, the rows of S contain spatial distribution (structure) of the factor, and E is error. Decomposition is non-unique, requiring constraints that model the physical imaging process. In cardiac PET, these have historically been decomposition into non-negative factors and structures, which is representative of the physics and imaging process. In addition, Poisson statistics have been used to model the imaging process, but these constraints still do not ensure a unique solution. In 2006 El Fahkri et al. [2] introduced an additional constraint that minimizes structure overlap in order to ensure a unique solution. This served their purpose of extracting blood timeactivity-curves using the LV blood factor. In this work we propose an alternative constraint that minimizes factor overlap, in order to improve the physiological accuracy of the factors and associated structures. II. METHODS AND MATERIALS Two sets of data were analyzed: 1. A simulated dynamic image sequence containing two factors. The first region was a centered circle containing 100% blood. The second region was a centered ring containing 80% myocardium and 20% blood factors. Each time frame of the simulated data was smoothed with a 12mm FWHM Gaussian filter resulting in an image containing factors as shown in leftmost column (Source) of table 1. 2. A single dog that underwent a series of dynamic PET scans with varying 82Rb (150 MBq) infusion durations (15, 30, 60, 120, 240, 240, 120, 60, 30, 15 seconds) with a Siemens ECAT ART scanner. The images were iteratively reconstructed to 12 mm resolution. These data sets were analyzed using the following fully automated steps: 1. Cropping of field-of-view to include regions of high signal intensity.
2. The number of factors was determined using the cumulative eigenvalues of the correlation matrix. 3. Factor analysis of medical image sequences (FAMIS) was applied with a relaxed non-negativity constraint as proposed in [1] (98% non-negative confidence interval). Resulting in factors F' and structures S'. 4. The ambiguity of the solution was resolved by iteratively solving for the factor rotation square matrix, R, so as to minimize a cost function ftot in two ways: a. MSO – Minimal Structure Overlap as described in [2] using the following equation: f totMSO = f n ( F ′R, R −1 S ′) + 0.01 f uni ( R −1 S ′) b. MFO – Minimal Factor Overlap using the following: f totMFO = f n ( F ′R, R −1 S ′) + 0.01 f uni (( F ′R) T ) fn(F,S) is a combined penalty for negative values in both the rotated factors (F=F'R) and rotated structures (S=R-1S') as described in [2]. funi(X) is a penalty for overlap between the rows of X, also as described in [2]. III. RESULTS A. Simulation The source structures of the two factors in the simulation were nearly exactly recovered using the MFO method, but not with the MSO method. This is most obvious in the blood factors, where the circular pattern is of smaller diameter (table 1).
Factor Comparison 0.25 Bloodsim BloodMFO
0.2 Normalized Activity
Abstract – Factor analysis has been pursued as a means to decompose dynamic cardiac PET images into different tissue types based on their unique physiology. Each tissue is represented by a time-activity profile (factor) and an associated spatial distribution (structure). Decomposition is based on non-negative constraints of both the factors and structures; however, additional constraints are required to achieve a unique solution. In this work we present a novel method (minimal factor overlap - MFO) and compare its performance to a previously published constraint (minimal spatial overlap - MSO). We compared both methods using simulated data and on a canine model with different 82Rb infusion profiles. Biasing of factors due to spillover is reduced with MFO compared to MSO, while the robustness and reproducibility of MSO is maintained.
BloodMSO Myocardium sim
0.15
Myocardium MFO Myocardium MSO
0.1
0.05
0
0
2
4
6
8 10 Frame #
12
14
16
18
Figure 1 – Comparison of resolved blood (red) and myocardium (blue) factors using MFO (x) MSO (o) to the source profiles (lines) used in simulating the dynamic image sequence.
Looking at the factor profiles (figure 1) shows that the blood factors using both methods follow the simulated data closely, although MFO appears slightly more accurate (R2=0.943) than MSO (R2=0.927). With regards to the myocardium factor, MFO was much more accurate (R2>0.999) than MSO (R2=0.247). B. Canine Model In all cases 2 factors were automatically determined as sufficient to decompose the image, accounting for 77-91% of the image variance. Similarly shaped factors were obtained with both MSO and MFO constraints as demonstrated in figure 2. The factors were automatically identified (and manually verified) as blood-pool and myocardium. The myocardium factors obtained with MFO tended to be ‘flatter’ than those obtained with MSO, i.e. biasing of the myocardium factor with blood (often seen as peak in the myocardium factor in synchrony with the blood pool peak) was reduced using MFO. Factor Comparison 0.16 BloodMFO
0.14 Normalized Activity
BloodMSO 0.12
Myocardium MFO
0.1
Myocardium MSO
0.08 0.06 0.04 0.02 0
0
1
2
3
4 Time (min)
5
6
7
8
Figure 2 – Example of comparison of resolved blood (red) and myocardium (blue) factors using MFO (x) and MSO (o) in a dog with a 30 second constant activity rate 82Rb infusion.
Using the MFO constraints, the blood factor ‘clearance’ decreased to nearly zero in the final frames as expected [3], while using MSO they decreased to an asymptote of 15-50% peak activity, depending on the elution time (Table 2). TABLE 2 - Blood Clearance (fraction of peak) (mean of two studies for each elution duration) Elution duration
MSO
MFO
15 s
0.84
1.00
30 s
0.80
1.00
60 s
0.76
1.00
120 s
0.65
1.00
240 s
0.54
1.00
TABLE 3 – Example of Resolved Factors (same case as in figure 2) MSO
MFO
MSO-MFO
Likewise, the structures obtained using both techniques were similar, as the example in table 3 demonstrates using the same data as in figure 2. The structures using MSO were better resolved, and as expected overlapped less with the myocardium. With MFO more spillover between the structures was observed. Excellent correlation (R2>0.95) between structures was measured for all infusion times evaluated, when the same constraint was used, indicating that the results are reproducible using MFO or MSO constraints. Between constraints the correlation was reduced (0.75