A Model-Based Approach for an Optimal Maintenance Strategy Bhaskar Saha1 , Tomonori Honda2 , Ion Matei3 , Eric Saund 4 , Johan de Kleer5 , Tolga Kurtoglu 6 , and Zsolt Lattmann 7 1-7
Intelligent Systems Laboratory, Palo Alto Research Center, 3333 Coyote Hill Rd, Palo Alto, CA 94304, USA
[email protected] [email protected] [email protected] [email protected] [email protected] [email protected]
8
Institute for Software Integrated Systems, Vanderbilt University, 1025 16th Ave S, Suite 102, Nashville, TN 37212
[email protected]
A BSTRACT In this paper we introduce a novel model-based reliability analysis methodology to guide the best maintenance practices for the different components in complex engineered systems. We have developed a tool that allows the system designer to explore the consequences of different design choices, and to assess the effects of faults and wear on critical components as a result of usage or age. The tool uses pre-computed simulations of usage scenarios for which performance metrics can be computed as functions of system configurations and faulty/worn components. These simulations make use of damage maps, which estimate component degradation as a function of usage or age. This allows the designer to determine the components and their respective fault modes that are critical w.r.t. the performance requirements of the design. Given a design configuration, the tool is capable of providing a ranked list of critical fault modes and their individual contributions to the likelihood of failing the different performance requirements. From this initial analysis it is possible to determine the components that have little to no effect on the probability of the system meeting its performance requirements. These components are likely candidates for reactive maintenance. Other component faults may affect the performance over the short or long run. Given a limit for allowable failure risk, it is possible to compute the Mean Time Between Failure (MTBF) for each of those fault modes. These time intervals, grouped by component or Line Replaceable Units (LRUs), are aggregated to develop a preventive maintenance schedule. The most critical faults may be candidates for ConditionBased Maintenance (CBM). For these cases, the specific fault Bhaskar Saha et. al. This is an open-access article distributed under the terms of the Creative Commons Attribution 3.0 United States License, which permits unrestricted use, distribution, and reproduction in any medium, provided the original author and source are credited.
modes considered for CBM also guide sensor selection and placement. 1. I NTRODUCTION Preventive maintenance has been the main stay of industry (civilian as well as military) for a long time (Barlow & Hunter, 1960). This was based on the assumption that because mechanical parts wear out, operational reliability was directly linked to duration of use or age. However, rigorous run-to-failure experiments have shown that there is significant variability in lifetimes even for the same components installed in similar set ups and tested under identical conditions. Reasons for this range from manufacturing variations, intrinsic defects to non-use or age related failure effects. This has naturally increased the focus on Condition-Based Maintenance (CBM) (Jardine, Lin, & Banjevic, 2006). CBM, however, has its own disadvantages like high design cost, added sensors and data collection components, increased system complexity and sources of error. What is needed for complex engineered systems is an optimum mix of reactive, time- or interval-based, condition-based, and predictive maintenance practices. Because maintenance costs can be a significant factor in the overall cost of a system or product, even up to 60-80% in military systems (Dallosta & Simcik, 2012), it is essential that maintenance be considered early in the design when flexibility is high and design change costs are low (Ender, Browne, Yates, & O’Neal, 2012). Changes made in production may be several orders of magnitude higher than those made early in the design cycle (FitzGerald, 2001). Keeping these objectives in mind, we have developed a model-based reliability analysis tool for complex engineered systems (Honda et al., 2014). This approach is system focused, i.e., it is more concerned with
1
E UROPEAN C ONFERENCE OF THE P ROGNOSTICS AND H EALTH M ANAGEMENT S OCIETY 2014
maintaining system function than with individual component operation. The tool allows the system designer to explore the consequences of different design choices, and to assess the effects of faults and wear on critical components as a result of operational stress.
tive maintenance is applicable, the tool provides prior distributions of component failure that may be used in a Bayesianlearning or similar filtering/machine learning frameworks. As of now this technology is applied to systems and components described in the Modelica modeling language.
Recent years have seen developments in simulation and optimization methods for fleet-level system reliability. Once such method (Mourelatos et al., 2011) calculates system reliability by probabilistically combining component reliability distributions for non-repairable as well as repairable systems, while assigning repair and maintenance costs to component failures. This work is complementary to the approach presented here that allows a simulation-based way for computing the system reliability distribution from individual component reliability distributions. However the reliability calculus presented in (Mourelatos et al., 2011) works primarily for serially configured systems where the any component failure results in system failure. This contrasts with the approach here of using simulations to compute the effect of component failure on system performance. Researchers have also tried to leverage models within a broader application of systems engineering to link models for mobility or survivability to models for reliability, maintainability, and availability or procurement and lifecycle sustainment cost. A notable effort in this direction is the Framework for Assessing Cost and Technology (FACT) web service developed for the US Marine Corps (Ender et al., 2012). FACT allows near realtime analysis for exploring design parameter trade-offs that affect the overall performance, reliability, and cost of a system design. The model-based reliability analysis technology described here can be thought of as a scalable model-based reliability analysis capability that can be integrated with a system engineering decision support framework like FACT.
Results are presented based on the reliability analysis work done for the DARPA Advanced Vehicle Make (AVM) program. The system model considered here is a simplified drivetrain corresponding to a tracked military vehicle comprising an engine, a power transfer module (PTM) with a torque converter, a cross-drive transmission, drive shafts, final drives, battery, and a fuel tank.
The tool presented here builds on the Fault-Augmented Model Extension (FAME) technology (de Kleer et al., 2013) described in the following section. The reliability analysis mechanism uses pre-computed simulations of mission segments for which performance metrics can be computed as functions of system configurations and faulty/worn components. These simulations make use of damage maps, which estimate component degradation as a function of mission stress. This allows the designer to determine the components and their respective fault modes that are critical w.r.t. the performance requirements of the design. In fact, given a design configuration, the tool is capable of providing a ranked list of critical fault modes and their individual contributions to the likelihood of failing the different performance requirements. Finally, recommendations can be made for the ideal maintenance strategy for each of the components. For cases where preventive maintenance is appropriate the tool helps to compute the time or mission intervals for scheduling purposes. For cases where CBM or predic-
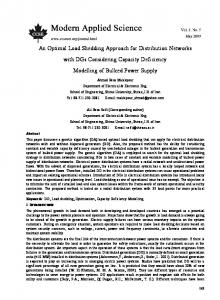
The internal combustion (IC) engine model contains a torque map and fuel consumption map, heat generation, a thermostat and a starter motor. This engine model can be instantiated with different parameters including fuel map, torque map, friction map, engine inertia, crank speed, fuel type and thermostat parameters. The transmission model includes a mechanical model that splits the energy between the left hand side and right hand side drive shafts (i.e. tracks) and models the gear changes (shifts). It also models steering, braking and coolant subsystems. The system boundary of this drive train model is at the final drives. Track models, controllers, and high fidelity coolant systems are not part of this design. In order to perform a simulation, we added additional surrogate components such as stimulus, load conditions and environment components in a test bench. The key test components are the road load and the surrogate coolant models. Controllers are not part of the system therefore time based signals are provided for each mission to the engine and transmission control ports. A schematic of this drivetrain is shown in Figure 1. Each component in this system design can be instantiated with different parameters, which gives flexibility to evaluate the reliability of different discrete design points (i.e. design configurations).
Figure 1. Schematic of sample AVM drivetrain (courtesy DARPA).
2
E UROPEAN C ONFERENCE OF THE P ROGNOSTICS AND H EALTH M ANAGEMENT S OCIETY 2014
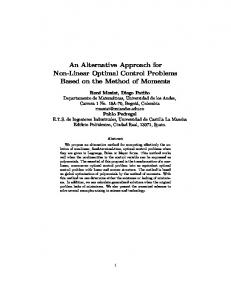
A mission is defined as a sequence of terrain blocks made up of differing surfaces, like asphalt, concrete and soil, and variation in gradients. The terrain profile is derived by sampling from a set of terrain power spectral density functions, which concisely describe an infinite set of possible terrain profiles with smooth roads, sand, boulders, etc. The distributions ensure that low-impact cyclic loads as well as rare but high-impact loads are realistically represented for the class of vehicle under consideration. A typical terrain profile is presented in Table 1. In order to explain the insights for maintenance or system health management (SHM) strategy that may be gained using reliability analysis methodology described above, the following two sections will provide some details of the FAME technology and the reliability analysis tool. More details are available in (de Kleer et al., 2013) and (Honda et al., 2014). 2. FAULT-AUGMENTED M ODEL E XTENSION (FAME) The DARPA AVM program aims at developing a design flow that lets system designers adapt their designs through a tightly integrated build-test-modify loop with multiple points of feedback in a model-based design and simulation environment. In order for this workflow to yield reliable system designs, it is essential for designers to have the ability to analyze faults, fault propagation, and system-level impact. The FAME-based reliability analysis tool provides this capability. FAME is based on the insight that most faulty behaviors are based on a few underlying fault mechanisms. FAME takes nominal component behavior descriptions (from Modelica model libraries) and parameterizable fault mechanism models as input, and deploys a model transformation mechanism to automatically generate a comprehensive set of fault-inducible component models. This technique when applied to a system design comprising Modelica component models results in a fault-inducible design where the effects of component faults can be investigated at the system level. A rough estimate of the reduction in modeling effort may be had by analyzing faults at the component level. The FAME technology is capable of modeling more than 7000 unique faults spanning nearly 1200 leaf-level components. Leaf-level components, like the Modelica Standard Library clutch model (Modelica.Mechanics.Rotational.Components.Clutch), are those that are not assemblies of simpler components, i.e. the equation block in these Modelica models comprise dynamics equations rather than equations that denote connections between components. Component assemblies and other higherlevel components inherit the fault behaviors of the components they are comprised of. For the FAME model transformation process we leveraged the JModelica Modelica parser framework, and the JastAdd technology on which it is built, to inject faults into the nominal component model library (de Kleer et al., 2013). A
Modelica Model Failure Mechanisms
Model Transforma=on (Compiler) Condi=oning (material, geometry)
Component CAD Generic Design Terrain/ Environment
Fault-‐ Augmented Model
Damage Accumula=on Simulator (Monte Carlo)
Posterior Probabili=es
Damage-‐Parameter Maps (Condi=onal Probabili=es)
Figure 2. Basic FAME (Fault-Augmented Model Extension) architecture.
Java program incorporating JastAdd and JModelica runs over the supplied library, recognizes fault-susceptible component models, re-writes them as needed to provide fault behavior, and outputs the modified library to a new location. These Modelica component fault models include a generic parameter named damage amount or a component-specific parameter, e.g. coefficient of friction for a brake, that determines the severity of the fault. The value of this parameter is determined by stochastic physics-of-failure models that capture the degradation or catastrophic fault modes of the associated components. These stochastic models are pre-simulated in a Monte Carlo framework incorporating model uncertainties as well as the expected spectrum of usage over the lifetime of the component. The results are stored as damage-parameter maps that are indexed by model material and geometric parameters and level of usage. The system-level Modelica models and simulations are detailed enough such that the variations in the component damage for any given age or usage shows up as distributions over the performance metrics. Figure 2 shows the basic architecture of this approach. 3. R ELIABILITY A NALYSIS The FAME reliability analysis tool supports analyses of system reliability and performance under both continuous wear and catastrophic failure of critical system components. It also scores design configurations according to reliability metrics and provides feedback to the designer about preferable choices of components or design configurations. “Reliability” describes the ability of a system to operate while meeting all requirements for a specified period of time or number of missions. Reliability is often quantified in terms of likelihood of failure, e.g. Mean Time to Failure (MTTF), Mean Time between Failure (MTBF), and Failures in Time (FIT) which captures system unreliability. The tool captures reliability using the metric Overall Probability of Mission Failure. In particular, the tool helps the designer to discover answers to the following questions: 3
E UROPEAN C ONFERENCE OF THE P ROGNOSTICS AND H EALTH M ANAGEMENT S OCIETY 2014
Table 1. Typical mission terrain and speed profile Terrain High Quality Paved Roads (Concrete) Secondary Pavement (Concrete) Rough Pavement (Concrete) Loose Surface (Concrete) Loose Surface w/ Washboard (Concrete) Belgian Block, Cobblestone (Concrete) Trails (Hard Soil) Cross-Country (Hard Soil) TOTAL
•
What system configurations are most reliable?
•
Which component failure modes causes critical performance loss?
•
Why is a particular component failure mode critical?
•
What performance metrics are most at risk?
•
How do these factors vary with number of missions?
Speed (mph) 40 40 40 35 30 30 25 15
Select system configuration
2.
Pick fault mode
3.
Set number of missions
4.
Set required probability for meeting requirements
5.
Select graphs to gain insight.
The tool lists the individual probabilities of meeting each requirement, as estimated from simulations of the faultaugmented Modelica system model, as well as a pass/fail flag for the likelihood of meeting all requirements. These feedback are denoted by the top two blue boxes in Figure 3. The designer can also press radio buttons to investigate insight graphs for performance metrics of interest. The selector panel is shown inside the red box marked 5 and the insight graphs are in the blue box at the bottom. A set of three insight graphs are shown per performance metric: •
Damage amount vs. Number of Missions Damage incurred by wear is a probabilistic amount estimated by mission stress factors and system properties. The left graph shows percentiles for amount of degradation for the selected component as a function of number of missions. The operation of the drivetrain was simulated several million times over a mission defined as a sequence of terrain blocks. Statistical variations in component parameters result in component-specific damageparameter maps, which are used to estimate damage incurred after a given number of missions.
Distance (miles) 3.50 3.50 4.50 9.25 11.50 2.25 35.00 46.50 116 .00
•
Performance metric vs. Damage Amount The middle graph shows how damage to the selected component impacts the selected performance metric. Damage to a component ranges from 0 (perfect condition) to 1 (total failure). This range is sampled and the corresponding fault simulations are carried out to populate this graph. In the example shown in Figure 3, the middle graph shows that, due to increased frictional losses in the PTM torque coupler component, the acceleration time to reach 10 kph increases with the damage amount (coefficient of friction).
•
Probability of meeting performance requirement vs. number of missions The right graph shows the calculated probability of achieving the selected performance metric after the target number of missions. In the example shown in Figure 3, the curve shows that, due to increased frictional losses in the PTM torque coupler component, the probability of meeting the desired acceleration time of 3 secs to reach 10 kph decreases with the number of missions. The red vertical dashed line at the target of 150 missions intersects the curve at a probability of 0.76. This is less than the target probability of .9 shown by the cyan dashed horizontal line. The requirement probability of .9 intersects the curve at about 130 missions.
Figure 3 shows the main user interaction elements of the tool marked in red. The main actions to be taken by the user are: 1.
% 3 3 4 8 10 2 30 40 100
The designer can also investigate the Figure-of-Merit (FOM), listed beside each configuration in the red box 1 (Figure 3). The FOM is calculated as the probability of mission failure (failure to meet at least one requirement) under the likelihood of a single component failure, aggregated across all components. The probability of component failure, and hence the probability of mission failure, is a function of the number of missions. The designer can click on a probability of mission failure value to view a breakdown of the failure probability in terms of components subject to wear/faults, as shown in Figure 4. From this graph, the designer can determine the component(s) most likely to be responsible for potential mission failure. 4
E UROPEAN C ONFERENCE OF THE P ROGNOSTICS AND H EALTH M ANAGEMENT S OCIETY 2014
Figure 3. FAME reliability analysis user interface (tool available at http://fame-deploy.parc.com:2040/).
The FOM breakdown graph lists component reliability for the ten most serious component faults. Component reliability expresses the probability that the component’s failure will cause an overall mission failure after the set number of missions, and is color-coded to show the impact of the component’s failure on the various performance metrics. In the example shown in Figure 4, the Engine.Inertia.Bearing.Friction fault (high engine bearing friction) is certain (probability = 1) after the set number of missions to retard acceleration-time-to15km/hr to more than the required value listed in the require-
ments table on the main user interface (as shown in Figure 3). Similarly, other component faults are catastrophic w.r.t the same or one of the other performance metrics. In the case of the two fatigue failure faults, three performance metrics are shown to fail simultaneously because the simulation model does not move under gear or shaft failure.
5
E UROPEAN C ONFERENCE OF THE P ROGNOSTICS AND H EALTH M ANAGEMENT S OCIETY 2014
Figure 4. Figure-of-Merit (FOM) probability breakdown in terms of component failures.
4. M AINTAINABILITY A NALYSIS As a logical extension of the above analysis, the designer can outline an appropriate maintenance strategy using this tool. Each high-level component, subassembly, or line-replaceable unit (LRU), e.g. engine, PTM, cross-drive transmission, has multiple fault modes. Each mode has a critical damage amount defined as the minimal damage amount that results in failing any one of the performance requirements. The critical damage amount for a component fault mode is determined by the first performance metric that fails as a result of this damage. This can be represented as: dci,j = min dci,j,k k
(1)
where, dc : critical damage amount i: index for high-level component or LRU j: index for component fault mode k: index for performance requirement.
From the Damage amount vs. Number of Missions graph (left graph in Figure 3), the number of missions mci corresponding to dci can be interpolated. Essentially, mci is the maintenance interval, conceptually similar to MTTF for the LRU, and can be used to determined a maintenance schedule. It is important to note that this number is dependent upon the desired probability of meeting the performance requirements. Table 2 shows these numbers for the different configurations and different acceptable risk levels for mission failure. Acceptable risk of mission failure is defined as follows: in order to set the risk at 10%, set the desired probability of meeting requirement to 0.9 for all requirements. The drivetrain example considered here had six unique configurations. Configurations 4 and 6 are missing from the table since these configurations fail to meet at least one of the requirements from the start of their mission life. Overall, configuration 2 seems to be the best in terms of system uptime between necessary maintenance events (maintenance interval), and hence maintenance cost, followed closely by configuration 5. 5. M AINTENANCE S TRATEGY
At the LRU level, the minimum of these critical damage amounts can be computed over all associated fault modes. This would provide the critical damage at the LRU level. dci = min dci,j, j
(2)
5.1. Change in Maintenance Interval with Allowable Risk From Table 2 it can be seen that the engine maintenance interval is not changed much by changing the acceptable risk of mission failure. By comparison, the cross-drive transmission and the PTM correlate strongly with changing risk level.
6
E UROPEAN C ONFERENCE OF THE P ROGNOSTICS AND H EALTH M ANAGEMENT S OCIETY 2014
Table 2. Estimated maintenance intervals for drivetrain example (numbers represent missions) Configuration No.
1
2
3
5
Caterpillar C9
Caterpillar C9
Caterpillar C9
Caterpillar C9
Components/LRUs
Allison X200-4A Final Drive 3.0
Allsion XTG411-A Final Drive 3.0
Allison X200-4A Final Drive 3.3
Allison X200-4A Final Drive 2.7
Acceptible risk of mission failure
10% (Desired probabilities of meeting requirements all set to 0.9)
Cross-drive Transmission
56
56
12
56
Engine
50
65
38
61
Power Transfer Module (PTM)
96
82
86
96
Left Final Drive
>8000
>8000
>8000
>8000
Right Final Drive
>8000
>8000
>8000
>8000
Road Wheel
>8000
>8000
6
>8000
Acceptible risk of mission failure
5% (Desired probabilities of meeting requirements all set to 0.95)
Cross-drive Transmission
42
42
11
42
Engine
49
65
24
61
Power Transfer Module (PTM)
63
63
63
63
Left Final Drive
>8000
>8000
>8000
>8000
Right Final Drive
>8000
>8000
>8000
>8000
Road Wheel
>8000
>8000
6
>8000
1% (Desired probabilities of meeting requirements all set to 0.99)
Cross-drive Transmission
25
25
10
25
Engine
49
61
36
57
Power Transfer Module (PTM)
28
28
101
28
Left Final Drive
>8000
>8000
>8000
>8000
Right Final Drive
>8000
>8000
>8000
>8000
Road Wheel
>8000
>8000
4
>8000
This is shown more clearly in Figure 5. The final drives seem unaffected by the risk level, likely because of not being stressed significantly in the usage scenario selected. The road wheels have a similar story, except in the case of configuration 3 where it is overstressed. Some simple inferences can be drawn here about the appropriate maintenance strategies for different LRUs. The cross-drive transmission and the PTM seem good candidates for scheduled maintenance due to the correlation of their critical damage levels, dci ’s with number of missions. The engine does not show such a strong correlation and hence it is better managed using a conditionmonitoring or CBM approach. In addition to the simple inferences above, there is some more key information that we can extract from the FAME simulations and use for maintenance strategy. We need to consider not only frequency of failure and consequence of failure, but also the predictability of failure (as measured by variance in failure time for the population,) and cost and ease of main-
Maintenance interval (no. of missions)
Acceptible risk of mission failure
140
Cross−drive Engine PTM
120
100
80
60
40
20
0
5
10
15
Acceptable risk of mission failure (%)
Figure 5. Maintenance interval vs. acceptable risk of mission failure for configuration 2.
7
E UROPEAN C ONFERENCE OF THE P ROGNOSTICS AND H EALTH M ANAGEMENT S OCIETY 2014
Table 3. Estimated maintenance intervals (in missions) for engine faults under 1% risk of mission failure Engine fault
Maintenance interval
Requirement affected
Engine.Inertia.Bearing.Friction
49
acceleration to 10 kph
Engine.DriverPulley.Bearing.Friction Engine.DrivenPulley.Bearing.Friction
125 80
acceleration to 10 kph acceleration to 15 kph
Engine.Pump.Bearing.Friction
80
acceleration to 15 kph
tenance/repair/replacement. Note that ease of maintenance is related to design choice, so it is part of the methodology to improve maintainability. 5.2. Ordering Component Faults by Importance The correlation of the maintenance interval with the acceptable risk of mission failure provides only a guide to the selection of maintenance strategy for any given LRU. What is needed is to order the importance of fault modes for each component. This will determine which fault mode needs to be monitored carefully, and which ones could be lower priority. As an example, consider the engine component, which has 4 important fault modes in the drivetrain system considered. Table 3 shows the maintenance interval of these 4 fault modes along with the performance requirement affected in each case. The acceptable risk for mission failure is 1% for this table. From the fault-specific maintenance interval values it is clear that a good monitoring system for the engine crankshaft bearing (Engine.Inertia.Bearing) is needed to track frictional wear and tear. The pulleys are less critical and may be checked during scheduled maintenance. However, since they do affect performance requirements reactive maintenance is not advised. This is a good example that can be used to check the validity of the inferences that can be drawn from the reliability analysis tool. While the maintenance specifics of military Caterpillar C9 engines is not known, heavy duty engines often have oil debris sensors that measure the contamination of the oil due to wear and tear of moving metal parts. Commercial vehicle engines typically recommend manual inspection of timing belts that connect the driven pulleys to the driver pulley. Belt slip is the primary cause of frictional losses at the pulleys. It should be noted that the maintenance strategy inferred from the reliability estimates automatically generated by the tool corresponds with field-tested expertise. 5.3. Ease of Maintenance Another key point to note from Table 2 is that the cross-drive transmission fails more frequently in configuration 3 as compared to the other design configurations. Ease of maintenance is a factor here. If this is the configuration chosen by the designer (reliability or maintainability are not the only con-
siderations), then care should be taken in the design to make this LRU easily accessible for maintenance and repair. Most military vehicles have a requirement on the time duration for specific maintenance actions since harsh operational and environmental conditions can make the simplest of maintenance extremely difficult or impossible (DES JSC TLS POL REL, 2009). 5.4. Stochasticity of Fault Modes Some component fault modes are more deterministic than others. In terms of maintenance, more deterministic fault modes are better candidates for scheduled maintenance. Consider the engine pump bearing example shown in Figure 6. The left plot shows that there is not much variance in the wear characteristics of a population of these bearings (all the percentile curves are close to each other). Consequently, the right plot shows that the probability of meeting the associated requirement dips sharply near the 170 missions mark. This fault is a good candidate for scheduled maintenance since there is not much variability in the number of missions before failure. A safe maintenance interval like 150 missions (probability of failure < 1%) may be chosen in this case. By comparison brake slip due to friction wear tends to have a more gradual transition to failure as shown in Figure 7. This fault mode has more variation in how the particular component degrades with usage. It probably needs a CBM approach informed by a sensor to monitor brake pad wear. Indeed, brake pad wear sensors had been invented decades back (Wiley & Williams, 1980) with application in military land vehicles. 6. C ONCLUSION This paper introduces a novel stochastic model-based reliability and maintainability analysis framework with applications to a broad class of complex engineered systems. A few examples of suggested maintenance strategies were presented for individual component fault modes as well as for components at the LRU-level. Cases where additional sensors make sense were identified. Some validation of these suggested maintenance strategies was provided based on real world maintenance practices. However, it is important to note that no comprehensive maintenance strategy was presented. This pa-
8
E UROPEAN C ONFERENCE OF THE P ROGNOSTICS AND H EALTH M ANAGEMENT S OCIETY 2014
Figure 6. Reliability analysis of engine pump bearing friction wear.
Figure 7. Reliability analysis of brake friction wear.
per represents an initial step towards facilitating design-forreliability and design-for-maintainability in the model-based design paradigm. Although no comprehensive maintenance strategy was presented, such a strategy is the subject of current research, where higher fidelity models that include manufacturing and material variability are planned to be used. The FAME reliability analysis tool is available online at http://fame-deploy.parc.com:2040/. Interested readers are encouraged to try out the tool and send comments to the authors. ACKNOWLEDGMENT Material within this technical publication is based upon the work supported by the Defense Advanced Research Projects Agency (DARPA) as part of a subcontract under Vanderbilt University Prime Contract HR0011-13-C-0041. The views expressed are those of the authors and do not reflect the official policy or position of the Department of Defense or the
U.S. Government.
1
Authors would like acknowledge contributions from Bill Janssen and Nora Boettcher at PARC, Dharshan Sutharshana, Paul Chow and Nicholas Moore at Angeles Crest Engineering, Inc., our prime contractor Vanderbilt University and the DARPA AVM Program Management team for their support. R EFERENCES Barlow, R., & Hunter, L. (1960). Optimum Preventive Maintenance Policies. Operations Research, 8(1), 90–100. Dallosta, P. M., & Simcik, T. A. (2012, March-April). Designing for Supportability: Driving Reliability, Availability, and Maintainability In... Defense AT&L: Product Support Issue, 34-38. de Kleer, J., Janssen, B., Bobrow, D., Kurtoglu, T., Saha, B., 1 Distribution
Statement “A” (Approved for Public Release, Distribution Un-
limited)
9
E UROPEAN C ONFERENCE OF THE P ROGNOSTICS AND H EALTH M ANAGEMENT S OCIETY 2014
Moore, N., & Sutharshana, S. (2013). Fault augmented modelica models. In 24th International Workshop on Principles of Diagnosis. DES JSC TLS POL REL. (2009). Applied Reliability and Maintainability Manual for Defence Systems. Ministry of Defence, Abbey Wood (South), Bristol, UK. Ender, T., Browne, D., Yates, W., & O’Neal, M. (2012). Fact: An m&s framework for systems engineering. In The interservice/industry training, simulation & education conference (i/itsec) (Vol. 2012). FitzGerald, A. (2001). Design for Maintainability (DFM). http://www.theriac.org/ DeskReference/viewDocument.php?id= 222#section6. Honda, T., Saund, E., Matei, I., Janssen, W., Saha, B., Bobrow, D., de Kleer, J., & Kurtoglu, T. (2014). A simulation and modeling based reliability requirements assessment methodology. In 26th International Conference on Design Theory and Methodology (iDETC/DTM). Jardine, A. K., Lin, D., & Banjevic, D. (2006). A Review on Machinery Diagnostics and Prognostics Implementing Condition-Based Maintenance. Mechanical Systems and Signal Processing, 20(7), 1483–1510. Mourelatos, Z., Li, J., Pandey, V., Singh, A., Castanier, M., & Lamb, D. (2011). A simulation and optimization methodology for reliability of vehicle fleets (Tech. Rep.). DTIC Document. Wiley, D., & Williams, D. G. (1980, May 20). Brake pad wear detection system. (US Patent 4,204,190) B IOGRAPHIES Bhaskar Saha received his Ph.D. and M.S. in Electrical and Computer Engineering from the Georgia Institute of Technology in 2008, and B.Tech. in Instrumentation Engineering from the Indian Institute of Technology, Kharagpur, India in 2001. He is currently a research scientist at the Palo Alto Research Center (PARC). His research is in system modeling for diagnostic and prognostic applications. He is the PI on a DARPA Advanced Vehicle Make (AVM) project focused on the automated fault augmentation of cyber-physical component models with applications in system reliability and maintainability analyses. Prior to joining PARC he worked at the NASA Ames Research Center in the Prognostics Center of Excellence. He has published over 30 research publications in technical journals and conference proceedings, and received three best paper awards. Dr. Saha coauthored a book chapter titled Prognostic Performance Metrics in Machine Learning and Knowledge Discovery for Engineered Systems Health Management edited by A.N. Srivastava and J. Han. Dr. Sahas publication on Advances in Uncertainty Representation and Management for
Particle Filtering Applied to Prognostics was accepted as a book chapter in K. P. Valavanis edited Applications of Intelligent Control to Engineering Systems. In addition, Dr. Saha holds two US patents in the area of system health management. Tomonori Honda received his Ph.D. and M.S. in Mechanical Engineering from California Institute of Technology and B.S. in Mechanical Engineering and Nuclear Engineering from University of California, Berkeley. He had continued his Ph.D. research at Massachusetts Institute of Technology as a Postdoctroal Scholar and Research Scientist for several years. He has published over 25 papers in journals and peer-reviewed conferences. He has also won the 2013 JALA Ten Award from Society of Laboratory Automation and Screening (SLAS) and the 2013 ASME Design Theory and Methodology Best Paper Award. Prior to joining PARC, Tomonori served as a principal data scientist at Edmunds.com, where he led the modeling and analytics effort including reinforcement learning framework for realtime ads targeting using big data. He also worked as a junior analytics manager at Opera Solutions, where he explored different techniques to improve model performances and won an in-house modeling competition. He is a member of ASME, AIAA, and AAAI, and has been a reviewer for several engineering design journals including ASME Journal of Mechanical Design, Research in Engineering Design, and Journal of Engineering Design. His main research areas include design for system reliability, prognosis, and maintenance scheduling, design synthesis for complex multidisciplinary systems, and behavioral design theory. Ion Matei received his M.S. and Ph.D. in Electrical Engineering from the University of Maryland, College Park in 2009 and 2010 respectively, and M.S. and B.S. in Electrical Engineering from the Politehnica University of Bucharest Romania in 2002 and 2003 respectively. He has published over 35 peer-reviewed articles and papers in leading journals and conferences in control, optimization, and signal processing. His research interests revolve around modeling, analysis, and design of dynamical systems. His early research focused on designing and analyzing distributed algorithms for optimization, estimation and control. In his most recent work, Dr. Matei is involved in reliability and diagnosis studies for cyber-physical systems, developing failure mechanisms models for physical components. He is a member of the IEEE society and he regularly performs peer reviews for top-tier international journals on Control and Signal Processing journals, such as IEEE Transactions on Automatic Control and Elseviers Automatica. For his research contributions, he received the NIST-ARRA fellowship award (2011) and the
10
E UROPEAN C ONFERENCE OF THE P ROGNOSTICS AND H EALTH M ANAGEMENT S OCIETY 2014
Werner Von Siemens Excellency award (2003). Eric Saund received a Ph.D. in Cognitive Science from the Massachusetts Institute of Technology, Cambridge, MA, USA, in 1988, and a B.S. degree in Engineering and Applied Science from the California Institute of Technology, Pasadena, CA, USA in 1980. His research spans Computer Vision, Document Recognition, and Artificial Intelligence. He has over 50 publications and over 40 patents, with two Best Paper awards. He is a member of the IEEE and ACM, and has served as Associate Editor of IEEE Transactions on Pattern Analysis and Machine Intelligence. Johan de Kleer received the Ph.D. degree in artificial intelligence from the Massachusetts Institute of Technology, Cambridge, in 1979. He is currently the Area Manager of the Model-Based Reasoning and a Research Fellow at the Intelligent Systems Laboratory, PARC. He has published widely on qualitative physics, model-based reasoning, truth maintenance systems, and knowledge representation. He has coauthored three books: Readings in Qualitative Physics, Readings in Model-Based Diagnosis, and Building Problem Solvers. Dr. de Kleer was a recipient of the prestigious Computers and Thought Award at the International Joint Conference on Artificial Intelligence in 1987. He is a Fellow of the American Association of Artificial Intelligence and the Association of Computing Machinery. Tolga Kurtoglu received his Ph.D. in Mechanical Engineering from the University of Texas at Austin and M.S. in Mechanical Engineering from Carnegie Mellon University. He is the Director of PARC’s Design and Digital Manufacturing Program where he leads business development, strategy, execution, and technology commercialization for a portfolio software technologies serving computer aideddesign (CAD), product lifecycle management (PLM), and
digital manufacturing markets. He specializes in R&D management combined with extensive project/program management for both Government and private sectors. Recently, he has been the project lead and PI for four DARPA projects: META, iFAB, C2M2L, and iFoundry. His research focuses on design and development of complex systems, applied intelligence for engineering systems, design theory and methodology with a specialization in design creation and innovation, and design automation and optimization. His research spans the areas of model-based systems engineering, automated reasoning, prognostics and health management, and risk and reliability-based design. Dr. Kurtoglu has published over 60 articles and papers in various journals and conferences and is an active member of ASME, AIAA, AAAI, ASEE, Design Society, and the Prognostics and Health Management Society. Prior to his work with PARC, he worked as a researcher at NASA Ames Research Center and as a mechanical design engineer and group lead at Dell Corporation. Zsolt Lattmann received his M.S. in Electrical Engineering from Vanderbilt University, Nashville, TN, in 2010 and his B.S. in Electrical Engineering from Budapest University of Technology and Economics, Hungary, in 2009. He is currently a Staff Engineer II at the Institute for Software Integrated Systems (ISIS) at Vanderbilt University. He is one of the lead developers on the META project of the Adaptive Vehicle Make program sponsored by DARPA. He has joined to this project in 2010 and has been researching, developing and implementing solutions in a meta-model based environment using various domain models and applications. His primary interest includes electrical, mechanical, multi-body, fluid, and thermal domains in modeling, simulation, and parametric and discrete design space studies. He has experience with the OpenMETA tool chain, developing new domain specific modeling languages, and implementing model transformation tools. He integrated an open source optimization tool (OpenMDAO) to the OpenMETA tool chain to provide a higher level of abstraction for end users.
11