This article has been accepted for publication in a future issue of this journal, but has not been fully edited. Content may change prior to final publication. Citation information: DOI 10.1109/TCBB.2016.2530064, IEEE/ACM Transactions on Computational Biology and Bioinformatics 1
A Modified Multiple Alignment Fast Fourier Transform with Higher Efficiency Weihua Zheng, Kenli Li, Member, IEEE, Keqin Li, Fellow, IEEE, Hing Cheung So, Fellow, IEEE Abstract—Multiple sequence alignment (MSA) is the most common task in bioinformatics. Multiple alignment fast Fourier transform (MAFFT) is the fastest MSA program among those the accuracy of the resulting alignments can be comparable with the most accurate MSA programs. In this paper, to improve MAFFT in efficiency, we modify the correlation computation scheme of MAFFT in three aspects. First, novel complex number based amino acid and nucleotide expressions are utilized in the modified correlation scheme. Second, linear convolution with a limitation is proposed for computing the correlation of amino acid and nucleotide sequences. Third, we devise a fast Fourier transform (FFT) algorithm for computing efficiently linear convolution. The FFT algorithm is based on conjugate pair split-radix FFT and does not require the permutation of order. The FFT is a novel algorithm on real data, in which only the real parts of the final outputs are required. Simulation results show that the speed of the modified scheme is 107.58% to 365.74% faster than that of the original MAFFT for one execution of the function Falign() of MAFFT, which is highly efficient. Index Terms—Convolution, fast Fourier transform (FFT), MAFFT, multiple sequence alignment (MSA).
F
1
I NTRODUCTION
Multiple sequence alignment (MSA) refers to identifying the biological similarity between three or more bioinformatic sequences. It is a basic tool in various aspects of molecular biological analysis ranging from detecting key functional residues, phylogenetic inference, structure prediction of noncoding RNAs (ncRNAs) and proteins, to inferring the evolutionary history of protein families. In the process of MSA, in order to maximize the number of similar amino acids or nucleotides, gap symbols “ − ” are inserted in sequences. A MSA is to transform k (k ≥ 2) sequences {s1 , s2 , ..., sk } into {s′1 , s′2 , ..., s′k }, where each of the former, si , i = 1, 2, · · · , k, can be expressed as a string of n amino-acid or nucleotide symbols, and s′i is elongated version of si with gaps “ − ” inserted to maximize the similar regions of the sequences. As an simple illustration, the resultant s′1 and s′2 in the MSA with two protein sequences s1 : T GCAAT GACC and
Manuscript received June XX, 201X; revised January XX, 201X. This research was partially funded by the Key Program of National Natural Science Foundation of China (Grant No. 61133005), and the National Natural Science Foundation of China (Grant Nos. 61070057, 61173013), Ministry of Education of China (Grant No. 708066), the Ph. D. Programs Foundation of Ministry of Education of China (20100161110019), Project supported by the National Science Foundation for Distinguished Young Scholars of Hunan (12JJ1011). W. Zheng, Kenli Li, and Keqin Li are with the College of Information Science and Engineering, Hunan University, Changsha 410082, China (E-mail:
[email protected],
[email protected],
[email protected]). (Corresponding author: Kenli Li.) Keqin Li is also with Department of Computer Science, State University of New York, New Paltz, New York 12561, USA (E-mail:
[email protected]). H. C. So is with the Department of Electronic Engineering, City University of Hong Kong, Hong Kong, China(E-mail:
[email protected]).
s2 : T GAAT T GGT G are T T
G G
C −
A A T A A T
− G A C T G G T
C G.
When gaps are inserted into sequences, the alignment score will be reduced by the weight costs which depend on the gap locations [1]. When k is not fixed, MSA is an NP-complete problem [2]. According to Hosni et al. [3], there are three main MSA approaches, namely, divide and conquer [4, 5], iterative method [6–9], and progressive method [3, 10–13]. The progressive approach is the most used and the most efficient one. It operates in three steps: (i) To determine the sequences that are the first to be aligned, the distance between every pair of sequences is computed and is stored in a symmetric diagonal matrix, called distance matrix. (ii) By using the distance matrix and constructing a guide tree, the branching order of the sequences is defined. (iii) The sequences are aligned through the guide tree. In order to enhance the multiple alignment scores, a refinement step can also be applied with the use of MUSCLE [14], MAFFT [15], and PAAP [16]. Needleman and Wunsch [17] have presented a dynamic programming (DP) for the optimization of sequences alignment. In fact, many heuristic algorithms [18–20], including progressive and iterative refinement methods, are based on the Needleman and Wunsch’s DP. The alignment of two sequences can be implemented with DP [17, 21, 22] in O(N 2 ) time and space complexity, where N is the length of the aligning sequences. As far as MSA is concerned, the run-time and space complexity grow exponentially with the number of sequences, indicating that the task for aligning many sequences of protein and amino
1545-5963 (c) 2015 IEEE. Personal use is permitted, but republication/redistribution requires IEEE permission. See http://www.ieee.org/publications_standards/publications/rights/index.html for more information.
This article has been accepted for publication in a future issue of this journal, but has not been fully edited. Content may change prior to final publication. Citation information: DOI 10.1109/TCBB.2016.2530064, IEEE/ACM Transactions on Computational Biology and Bioinformatics 2
acid will be very difficult [2]. In order to reduce the run-time and space complexity of DP, an efficient algorithm has been proposed in an MSA program, called multiple alignment using FFT (MAFFT). The program drastically reduces the execution time compared with existing methods [14, 23] by using fast Fourier transform (FFT) and cyclic convolution to identify homologous regions of sequences, whereas the accuracy of the resultant alignments is comparable with that of the most accurate methods in the literature. Although it is well-known that there is a strong relation between FFT and convolution, MAFFT is the first and only one to handle MSA by using convolution and FFT. MAFFT is the fastest program for MSA compared with the existing programs whose accuracy of resulting alignments are comparable with the most accurate methods. The key technique in MAFFT, i.e., the identification of the homologous regions of aligning sequences by using FFT and convolution, can be applied to other algorithms of MSA. It is thus of interest to modify the algorithm with less memory size, lower computational complexity, more homologous regions detected, and higher efficiency. The aim of this work is to improve MAFFT in efficiency. We modify the MAFFT, and devise a correlation computation algorithm and an FFT algorithm. In the former, an amino acid residue and a nucleotide residue are expressed as one and two complex numbers, respectively, instead of vectors consisting of two and four real numbers, in the MAFFT. The idea of Linear convolution is utilized for improving the the correlation computation between sequences by the proposed algorithm. The complex number scheme for nucleotide sequences was already explained in the URL: http://mafft.cbrc.jp/alignment/software/algorithms /algorithms.html [24] and used in Ref. [25]. The modification in MAFFT was made after the publication of Katoh et al. 2002 [26], and the Katoh2002 scheme (4 real numbers are used for denote a nucleotide) is still used when the –nomemsave option is given. We rediscovered and presented the scheme in this paper. Our presentation contains not only the scheme for nucleotide sequences but also an exact derivation and the scheme for amino acid sequences. The correlations of alignment sequences are efficiently calculated using the proposed FFT algorithm which can eliminate the permutation of order. The elimination of order permutation can reduce the FFT CPU time since the time spent in the order permutation is about 15-25% of total FFT time. Moreover, it corresponds to a novel FFT algorithm on real data, which requires only the real parts of the final outputs of the correlations of sequences. The proposed correlation computation and FFT schemes allow us to achieve the improvement of MAFFT in efficiency. The rest of this paper is organized as follows.
Section 2 reviews MSA presented in MAFFT. Section 3 proposes a correlation calculation algorithm based on complex-valued expressions for bioinformatic sequences. Section 4 presents an FFT algorithm for the implementation of the proposed correlation calculation algorithm. Section 5 analyzes the performance of the two proposed algorithms by comparing them with those in MAFFT. The analysis and comparison include the required memory size, computational complexity, and the access to the lookup table of twiddle factors. Section 6 includes two simulations which simulate the computation of MSA and the computation of the correlation between two sequences. Finally, conclusions are drawn in Section 7.
2
O PTIMIZATION
OF
A LIGNING PATH
In this section, we present the two aspects of the optimization of the aligning path: digital sequence expression and the correlation computation. These two aspects are basics for us to understand the proposed scheme. The presentation is derived from Ref. [26] and source code of the current MAFFT 7.127b. The frequency of amino acid expressions strongly depends on the difference of physico-chemical properties, particularly volume and polarity, between the amino acid pair involved in the expression [27]. Expressions between physico-chemically similar amino acids tend to preserve the structure of proteins, and such neutral expressions have been accumulated in molecules during evolution [28]. It is reasonable to consider that an amino acid a is a vector consisting of the volume value v(a) and the polarity value p(a), which is introduced by Grantham [29]. The values of the properties in amino acid are listed in Table 1. TABLE 1: Values for properties in amino acid [29] Amino acid Ser S Arg R Leu L Pro P Thr T Ala A Val V Gly G Ile I Phe F
Property p v 9.2 32.0 10.5 124.0 4.9 111.0 8.0 32.5 61.0 8.6 8.1 31.0 5.9 84.0 3.0 9.0 5.2 111.0 5.2 132.0
Amino acid Tyr Y Cys C His H Gln Q Asn N Lys K Asp D Glu E Met M Trp W
Property p v 6.2 136.0 5.5 55.0 10.4 96.0 10.5 85.0 56.0 11.6 11.3 119.0 13.0 54.0 83.0 12.3 5.7 105.0 5.4 170.0
We now take the amino acid sequence s : Y KF LSCV SN M as an example. By looking up the table, the sequence s can be expressed as ((6.2, 136.0), (11.3, 119.0), (5.2, 132.0), (4.9, 111.0), (9.2, 32.0), (5.5, 55.0), (5.9, 84.0), (9.2, 32.0), (11.6, 56.0), (5.7, 105.0)). Then the sequence is normalized by using the normalized forms: vˆ(a) = [v(a)−v]/δv and pˆ(a) = [p(a)−p]/δp , where the overbar denotes the average of 20 amino acids (v = 84.025 and p = 8.325), and δv and δp denote standard deviations of volume and polarity respectively (δv = 41.86540189 and δp = 2.622379645).
1545-5963 (c) 2015 IEEE. Personal use is permitted, but republication/redistribution requires IEEE permission. See http://www.ieee.org/publications_standards/publications/rights/index.html for more information.
This article has been accepted for publication in a future issue of this journal, but has not been fully edited. Content may change prior to final publication. Citation information: DOI 10.1109/TCBB.2016.2530064, IEEE/ACM Transactions on Computational Biology and Bioinformatics 3
An amino acid sequence of symbols is then converted to a sequence of vectors. The correlation between two sequences is defined as follows: c(k) = cv (k) + cp (k),
−L + 1 ≤ k ≤ L − 1,
M ∑
vˆ1 (m)vˆ2 (m + k),
m=1
− L + 1 ≤ k ≤ L − 1,
(2)
where vˆ1 (n) and vˆ2 (n) are volume component of nth site of sequence 1 with length M and sequence 2 with length N respectively. Generally speaking, M ≃ N in many cases, the calculation of (2) requires O(M N ) operations. Similar to (2), the correlation cp (k) of component polarity between sequence 1 and sequence 2 with the positional lag k sites is defined as cp (k) =
M ∑
pˆ1 (m)pˆ2 (m + k),
m=1
− L + 1 ≤ k ≤ L − 1.
(3)
From the mathematical point of view, the lag k is in the range from −L + 1 to L − 1. However, the range of lag k in Eq. (3) is inaccurate from the biological viewpoints, since sequences are often aligned sequentially by matching the front to the front and the back to the back. It is impossible for a pairwise alignment to match the first residue of one sequence to the last residue of another one. MAFFT computes Eq. (2) through FFT, which reduces the computational complexity from O(L2 ) to O(L logL 2 ). The method is based on the cyclic convolution property of discrete Fourier transform (DFT): V1 ⊙ V2 = IDF T (DF T (V1 )DF T (V2 )),
cv (k) =
(4)
where V1 and V2 are the volume component vectors of a pairwise sequences, ⊙ denotes cyclic convolution, and DF T (V ) and IDF T (V ) represent the DFT and inverse discrete Fourier transform (IDFT) of sequence
L ∑
ˆ (L − k − m), vˆ1 (m)← v− 2
m=1
(1)
where cv (k) and cp (k) are the correlations of volume component and polarity component between these two sequences, M and N are the lengths of sequences 1 and 2, L = max(M, N ), and k is the lag index. L (In MAFFT, L = 2⌈log2 ⌉ , where ⌈x⌉ maps the real number x to the smallest following integer). The correlation c(k) represents the degree of similarity of two sequences with the positional lag of k sites. The 20 highest values of c(k) indicate that the sequences with the corresponding lag k may have homologous regions. The correlation cv (k) of component volume between sequences 1 and sequence 2 with the positional lag k sites is defined as cv (k) =
V respectively. If the order of sequence 2 is reversed, Eq. (2) can be re-expressed as follows:
− L + 1 ≤ k ≤ L − 1,
(5)
ˆ denotes the reversed sequence 2. Since Eq. where ← v− 2 (5) is the convolution representation of the correlation c(k) and satisfies the condition of Eq (4), the right part in Eq. (5) can be computed by using Eq (4). If DF T (V ) or IDF T (V ) is evaluated with FFT, the computational complexity for computing Eq. (2) or (5) is proportional to L logL 2 . The correlation cp (k) in Eq. (3) can be computed with the method similar to the correlation cv (k) in Eq. (2). According to the 20 highest values of the correlation c(k), MAFFT can detect and locate homologous regions, then a segment-level dynamic programming is conducted and obtains an optimal path of the alignment. By using the optimal path, the aligning matrix is divided into several sub-matrices at the boundary corresponding to the center of homologous segments, which can reduce the solution space of the alignment and save the CPU time [26]. The procedure of the one-to-one alignment can be extended to group-to-group alignment by considering the one-to-one alignment is the special case of the group-to-group alignment with one sequence in each group. The group-to-group alignment algorithm is a straightforward extension of the one-to-one alignment algorithm, and is the core of progressive and iterative approaches. The essential difference of group-togroup alignment from pairwise sequence alignment is the existence of gaps within each group of prealigned sequences [30]. By replacing the vˆ1 (m) and vˆ2 (m) in the Eq. (2) with vgroup1 ˆ (m) and vgroup2 ˆ (m), and pˆ1 (m) and pˆ2 (m) in Eq. (3) with pgroup1 ˆ (m) and pgroup2 ˆ (m), the two equations are extended to groupto-group alignment. The volume value vˆgroup (m) and the polarity value pˆgroup (m) of a group are defined by ∑ vˆgroup (m) = Wi vi (m), m = 1, 2, ..., L, (6) i∈group
and pˆgroup (m) =
∑
Wi pi (m),
m = 1, 2, ..., L,
(7)
i∈group
where Wi is the weight factor of sequence i, that is evaluated in the same manner in [10], [23], [31] for progressive method, or in the same manner as the weight system in [16], and L is the longest length in the group. The correlation c(k) between two nucleotide sequences can be evaluated through c(k) = cA (k) + cT (k) + cG (k) + cC (k), − L + 1 ≤ k ≤ L − 1,
(8)
1545-5963 (c) 2015 IEEE. Personal use is permitted, but republication/redistribution requires IEEE permission. See http://www.ieee.org/publications_standards/publications/rights/index.html for more information.
This article has been accepted for publication in a future issue of this journal, but has not been fully edited. Content may change prior to final publication. Citation information: DOI 10.1109/TCBB.2016.2530064, IEEE/ACM Transactions on Computational Biology and Bioinformatics 4
by representing a nucleotide sequence as a sequence of 4-D vectors whose components are frequencies of A, T , G, and C at each column, instead of volume and polarity values. For example, the nucleotide sequence “TAGTAA...” can be expressed as ((0,1,0,0), (1,0,0,0), (0,0,1,0), (0,1,0,0), (1,0,0,0), (1,0,0,0), ...).
3
P ROPOSED
C ORRELATION
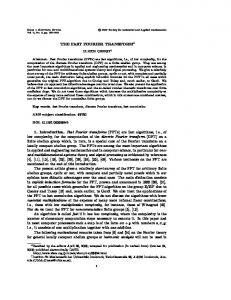
correlations of these two sequences through linear convolution. By comparing Figs. 1(a) and 1(b) with Fig. 1(c), one can find that the computation using linear convolution overcomes the deficiency of that of cyclic convolution in Figs. 1(a) and 1(b). Moreover, more correlations obtained by linear convolution will result in more homologous segments identified.
C OMPUTA -
TION
In this section, we propose a method for computing the correlation between sequences in MAFFT. The proposed method is different from the original method in two aspects. (1) The method uses one complex data to express an amino acid residue, instead of a vector composed of two real numbers, and uses two complex numbers replacing a vector of four real numbers for expressing a nucleotide residue. (2) Linear convolution with a limitation is proposed for computing the sequence correlations. For general mathematical sequences, the linear convolution can identify more homologous regions than those of the cyclic convolution. However, the bioinformatics sequences are just a very small part of the mathematical sequences. Moreover, the alphabets in a bioinformatics sequence are arranged in a methodical manner rather than a random fashion. Thus, the limitation of the linear convolution is proposed for improving the efficiency of the correlation computation of bioinformatics sequences of MAFFT. Although the convolution in the proposed algorithm is an intermediate form between cyclic convolution and linear convolution, we call it linear convolution. 3.1
One-to-One Alignment
From the discussed in Section 2, we find a fact that the computations of Eqs. (2) and (3) are not exactly identical to that of their cyclic convolution in the number and values of results. The computation using linear convolution is exactly identical to that of Eqs. (2) and (3). This is the reason why linear convolution in the proposed scheme replaces cyclic convolution in the computation the correlations between sequences. Fig. 1 illustrates the computation of the correlation of sequence s1 = “ABCD” and sequence s2 = “CABD”. In Fig. 1(a), the correlation of the two sequences are computed directly according to Eqs. (2) and (3). Since the lengths of the two sequences are the same, the value of L in Eqs. (2) and (3) is four. The computation of the correlations using cyclic convolution is shown in Fig. 1(b), where the correlation c(k) is the number of the matched characters between these two sequences. It is clear that, the computation of the correlation using cyclic convolution does not keep pace with the computation directly using Eqs. (2) and (3), and some computations that need to be performed are neglected. Fig. 1(c) shows the computation of the
A B C D C A B D c(-3)=0 C A B D c(-2)=1 C A B D c(-1)=0 C A B D c(0)=1 C A B D c(1)=2 C A B D c(2)=0 C A B D c(3)=0 (a) Computation using Eq. (1)
A C A B D
B A B D C
C B D C A
D D C A B
c(0)=1 c(1)=2 c(2)=1 c(3)=0
(b) Computation cyclic convolution
using
A C A B D
B C D A B D B D D
C C A C A B C A B D C A B D C A B D
c(0)=1 c(1)=2 c(2)=0 c(3)=0 c(4)=0 c(5)=1 c(6)=0
(c) Computation using line convolution
Fig. 1: Correlation computation of three methods An amino acid a, as mentioned above, can be represented as a vector whose components are the volume value v(a) and the polarity value p(a). A complex data is like a vector of two real numbers except that it has special rules for addition and multiplication. In order to evaluate the convolution more efficiently, the proposed one-to-one alignment uses a complex data to describe an amino acid, i.e., one can use pˆ(a)±jˆ v (a) or vˆ√ (a) ± j pˆ(a) to denote the amino acid a, where j = −1. The expressions of the aligning sequences should stay the same. We now consider the case of the alignment of two sequences. Assume that the two aligning sequences are s1 and s2 . First, if the volume value (or polarity value) of an amino acid in s1 is the real part of the expression, the volume value (or polarity value) of an amino acid should be also the real part of the expression in s2 . Second, if the imaginary part of an amino acid in s1 is positive, the imaginary part of an amino acid in s2 should be negative, and vice versa. The situation of the alignment of multiple sequences is similar to that of two sequences. The correlation c(k) of the sequences s1 and s2 in Eq. (1) can be re-defined
1545-5963 (c) 2015 IEEE. Personal use is permitted, but republication/redistribution requires IEEE permission. See http://www.ieee.org/publications_standards/publications/rights/index.html for more information.
This article has been accepted for publication in a future issue of this journal, but has not been fully edited. Content may change prior to final publication. Citation information: DOI 10.1109/TCBB.2016.2530064, IEEE/ACM Transactions on Computational Biology and Bioinformatics 5
by c(k) =
M +N ∑−1
s1 (m) ⊔ s2 (m + k),
m=0
− L + 1 ≤ k ≤ L − 1,
(9)
where
c(k) = ℜ{IDF T (DF T (s1 )DF T (s2 ))},
s1 (m) ⊔ s2 (m + k) = ℜ{s1 (m)}ℜ{s2 (m + k)} + ℑ{s1 (m)}ℑ{s2 (m + k)} = pˆ1 (m)pˆ2 (m + k) + vˆ1 (m)vˆ2 (m + k), (10) and ℜ{s(a)} and ℑ{s(a)} denote the real part and imaginary part of the complex number s(a) respectively. As the discussed in Section 2, it is impossible for a pairwise alignment to match the first residue of one sequence to the last residue of another one. Thus, it is unnecessary to obtain all c(k) for Eq. (9) by padded enough zeros. To obtain 2α + 1 reliable correlation c(k), 2α zeros have to be padded for these two sequences, where −α ≤ k ≤ α and ⌊(2L − N − M )/2⌋ ≤ α ≤ (N + M − 1)/2, where ⌊x⌋ denotes the biggest integer which is smaller than x. By padding ⌊(2α + N − M + 1)/2⌋ zeros at the end of the sequence s2 and then reversing it, and padding ⌊2α − N + M + 1)/2⌋ zeros at the end of the sequence s1 , a novel equation which is similar to but not a convolution is obtained as the following: c(k) =
β ∑
s1 (n) ⊔ s2 (k − n),
n=1
k = 0, 1, ..., β − α, β − α + 1, ..., β − 1,
DF T (v2 )DF T (p1 )) are imaginary numbers. Moreover, it is known that the values of c(k) are real numbers. Therefore, in Eq. (12), the real parts of IDF T (DF T (s1 )DF T (s2 )) are equal to the values of c(k), and the evaluation of the term −jIDF T [DF T (v1 )DF T (p2 ) − DF T (v2 )DF T (p1 )] can be neglected, i.e.,
(11)
where β = ⌊(2α + N + M + 1)/2⌋. In Eq. (11), the β − 2α − 1 correlation c(k) when α < k < β − α are unnecessary. We call Eq. (11) semi-convolution, which is not a full convolution equation, since the operation operator is “⊔” rather than a multiplication. However, Eq. (11) can be computed efficiently by using standard convolution, as follows:
k = 0, 1, ..., β − α, β − α + 1, ..., β − 1,
(13)
In MAFFT, cyclic convolution is utilized for computing the correlation cv (k) in Eq. (2) and cp (k) in Eq. (3), and is implemented with a radix-2 FFT which taken from Press et al. [32]. Sequences have to been padded with zeros till their lengths reach powers-oftwo, which makes its cyclic convolution is like linear convolution in some extent. In the next section, an FFT algorithm is proposed to efficiently compute the correlation c(k) between the two sequences according to Eq. (13). In the algorithm, two FFT programs are developed. The purpose of one of the two programs is to compute DFTs of sequences and the purpose of another one is to compute the inverse DFTs (iDFTs), 3.2 Extension to Group-to-Group Alignment Similar to MAFFT, the proposed one-to-one alignment can also be easily extended to group-to-group alignment by considering Eq. (9) as the special case of one group with one sequence. If the terms s1 (m) and s2 (m + k) are replaced by sgroup1 (m) and sgroup2 (m + k), one can evaluate the correlation between two groups through Eq. (9). The expression of the group s is defined by ∑ sˆgroup (n) = Wi si (n), n = 1, 2, ..., L − 1, (14) i∈group
where L is the maximum length of sequences among the group. If the method is applied to nucleotide sequences, the vector of four real numbers of a nucleotide is c(k) to be converted to two complex numbers in which β ( each complex number derives from two of the four ∑ = s1 (n)s2 (k − n) frequencies of A, T , G, and C at each column. Assume n=1 that the frequencies of A and T combine a complex ) number and the frequencies of G and C combine an− j[v1 (n)p2 (k − n) − v2 (k − n)p1 (n)] ( ) other complex number. The correlation c(k) between = IDF T DF T (s1 )DF T (s2 ) ( ) two nucleotide sequences of s1 with length M and s2 − jIDF T DF T (v1 )DF T (p2 ) − DF T (v2 )DF T (p1 ) , with length N is defined as the following. k = 0, 1, ..., β − α, β − α + 1, ..., β − 1, c(k) = cAT (k) + cGC (k) (12) = ℜ{IDF T (DF T (sAT 1 )DF T (sAT 2 ))} where DF T (s) and IDF T (s) represent the DFT and + ℜ{IDF T (DF T (sGC1 )DF T (sGC2 ))}, iDFT of the sequence s respectively. Since v1 (n), k = 0, 1, ..., β − α, β − α + 1, ..., β − 1, (15) v2 (n), p1 (n), and p2 (n) are real numbers, the values of the expression IDF T (DF T (v1 )DF T (p2 ) − which is similar to Eq. (13). The convolutions in Eqs. DF T (v2 )DF T (p1 )) are real numbers and the val- (13) and (15) will be evaluated with the proposed FFT ues of the expression jIDF T (DF T (v1 )DF T (p2 ) − algorithm in Section 4. 1545-5963 (c) 2015 IEEE. Personal use is permitted, but republication/redistribution requires IEEE permission. See http://www.ieee.org/publications_standards/publications/rights/index.html for more information.
This article has been accepted for publication in a future issue of this journal, but has not been fully edited. Content may change prior to final publication. Citation information: DOI 10.1109/TCBB.2016.2530064, IEEE/ACM Transactions on Computational Biology and Bioinformatics 6
We now summarize the proposed algorithm for the correlations between sequences. The first and most important thing is to express the amino acid and the nucleotide in a regular and strict way. Second, the linear convolution of the sequences will be efficiently implemented with the proposed FFT algorithm in Section 4. The real parts of the linear convolution are the final outputs. Through the correlations in Eqs. (13) and (15), as the mentioned in Section 2, we can obtain the homologous regions of pairs of sequences or sequence groups. The homologous regions divide the two-dimensional array constructed from the aligning sequences or sequence groups into some subarrays, while the alignment of two long sequences of sequence groups is decomposed into some subalignments of pairs of shorter sequences or sequence groups. The resulting sub-alignments can be implemented with any approach of aligning two sequences or sequence groups. When the alignments of pairs of sequences or sequence groups are used by progressive method or other MSA methods, the alignment of multiple sequences is obtained efficiently.
4
P ROPOSED FFT A LGORITHM
It is obligatory to implement three FFTs for a protein sequence alignment and six FFTs for a DNA sequence alignment. Two of the three FFTs or four of the six FFTs are implemented for computing the DFTs of sequences (or groups). The other FFTs are implemented for computing the iDFT of the product of the DFTs of the pairwise of sequences (or groups). A FFT algorithm is proposed for efficiently computing the DFTs and iDFTs. In the algorithm, two FFT programs are developed. One of the programs can implement the computation of the DFTs of sequences (or groups). Another one can implement the iDFT of the product of the DFTs. The two programs are all based on the splitradix FFT (SRFFT) algorithm [33–35]. The algorithm for DFTs is decimation-in-frequency (DIF) structure. The algorithm for iDFTs is decimation-in-time (DIT) structure, which is a novel output pruning and can delete all unnecessary operations since only the real parts of the outputs are necessary. Both algorithms eliminate the order permutation since the order permutation is redundant for the proposed sequence alignment. The time spent in the order permutation is about 15-25% of total FFT time. Thus, the elimination of order permutation can reduce the FFT CPU time. 4.1
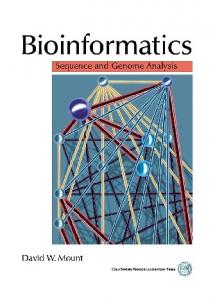
frequency domain, and it is necessary to permute order. Owing to non-existence of Fourier analysis of frequency domain in the proposed sequence alignment, permuting order is unnecessary for the proposed FFT implementation. Therefore, in the proposed FFTs implementation, the order permutation is omitted by blending a DIF SRFFT algorithm and a DIT SRFFT algorithm. As illustrated in Fig. 2, the implementation of the DIF SRFFT algorithm permutes the order of sequences at the end of programs, and the implementation of the DIT SRFFT algorithm permutes the order of sequences at the beginning of programs. In order to eliminate the order permutation, the proposed implementation method uses the DIF SRFFT algorithm to evaluate the DFTs of sequences, and then uses the DIT SRFFT algorithm to evaluate corresponding iDFTs. The proposed FFT implementations are based on the SRFFT algorithm. The SRFFT algorithm is the best possible compromise between regularity and computational complexity [36], and has the optimal number of real multiplications and the best known minimum of real additions for lengths up to and including 16. It is the most popular FFT algorithm on general processors and is a good choice for the proposed method to implement its FFTs. Let us review the definition of DFT and the decomposition of the SRFFT algorithm. For a length-L sequence, we can obtain a new sequence of lengthN =2⌈log2 (L)⌉ sequence x(n) by padding zeros, its DFT is also a length N sequence,
X(k) =
N −1 ∑
x(n)WNnk ,
where ⌈x⌉ denotes the √ smallest integer bigger than x, w=e−j2π/N and j = −1. The DIF SRFFT algorithm is similar to the DIT SRFFT algorithm. The difference between DIF and DIT lies only in the direction of their flowgraph. The DIF decomposition of SRFFT gives ∑
N/2−1
X(2k) =
(x(n) + x(n + N/2))WNnk ,
n=0
k = 0, 1, 2, ..., N/2 − 1,
(17)
for the even-indexed terms, and
Order Permutation Elimination
Permuting order in the implementation of FFTs does not require real operations. However, the striding access to memory makes a lot of demand on CPU time. Generally speaking, an FFT algorithm is used in applications where Fourier analysis is implemented in
k = 0, 1, 2, ..., N − 1, (16)
n=0
∑
N/4−1
X(4k + 1) =
((x(n) − x(n + N/2))
n=0
− j(x(n + N/4) − x(n + 3N/4)))WNn WNnk , k = 0, 1, 2, ..., N/4 − 1, (18)
1545-5963 (c) 2015 IEEE. Personal use is permitted, but republication/redistribution requires IEEE permission. See http://www.ieee.org/publications_standards/publications/rights/index.html for more information.
This article has been accepted for publication in a future issue of this journal, but has not been fully edited. Content may change prior to final publication. Citation information: DOI 10.1109/TCBB.2016.2530064, IEEE/ACM Transactions on Computational Biology and Bioinformatics 7
-j -j -j W12 W3 W
-j -j -j -j
W36 W W9
W2 W6 -j
-j W= e
X0 X1 X2 X3 X4 X5 X6 X7 X8 X9 X10 X11 X12 X13 X14 X15
X0 X1 X2 X3 X4 X5 X6 X7 X8 X9 X10 X11 X12 X13 X14 X15
permuting order
X0 X8 X4 X12 X2 X10 X6 X14 X1 X9 X5 X13 X3 X11 X7 X15
permuting order
x0 x1 x2 x3 x4 x5 x6 x7 x8 x9 x10 x11 x12 x13 x14 x15
X0 X8 X4 X12 X2 X10 X6 X14 X1 X9 X5 X13 X3 X11 X7 X15
x0 x1 x2 x3 x4 x5 x6 x7 x8 x9 x10 x11 x12 x13 x14 x15
j W2 W6
-j2π/16
j j
j
W1 W32 W
j
W3 W6 W9
j j j j W= ej2π/16
(a) DIF SRFFT for 16-point DFTs
(b) DIT SRFFT for 16-points iDFTs
Fig. 2: Flowgraph of 16-points
x0 x1 x2 x3
and ∑
N/4−1
X(4k + 3) =
((x(n) − x(n + N/2))
n=0
+ j(x(n + N/4) − x(n + 3N/4)))WN3n WNnk , k = 0, 1, 2, ..., N/4 − 1, (19)
X0 X2
X0 X2
Wn X1 X1 W-n W3n X3 X3 W-3n - j - -j -
x0 x1 - x2 - x3
(a) General butterfly of DIF (b) General butterfly of DIT split-radix FFT split-radix inverse FFT
Fig. 3: General Butterflies of proposed FFT algorithm
for the odd-indexed terms. In the case of the DIT SRFFT algorithm, the decomposition is as follows: ∑
N/2−1
X(k) =
∑
N/4−1 nk x(2n)WN/2 + WNk
n=0
nk x(4n + 1)WN/4
n=0
∑
N/4−1
+ WN3k
nk x(4n + 3)WN/4 ,
n=0
k = 0, 1, 2, ..., N − 1. (20) The flowgraph of DIF SRFFT for 16-points DFTs is illustrated in Fig. 2(a), and The flowgraph of DIT SRFFT for 16-points iDFTs is shown in Fig. 2(b). 4.2
DIF and DIT Programs
The SRFFT algorithm decomposes a length-N = 2m DFT into a length-N/2 sub-DFT and two length-N/4 sub-DFTs by implementing two special butterflies of n = 0 and n = N/8, and N/4 − 2 general butterflies. To simplify butterfly analysis, we are going to focus on the general L-butterflies. There exist two types of general butterflies in the proposed FFT implementation, as shown in Fig. 3. The general butterfly illustrated in Fig. 3(a) is implemented in the DIF SRFFT algorithm that is developed for computing the DFTs of sequences. The general butterfly illustrated in Fig. 3(b) is implemented in the DIT SRFFT algorithm that is developed for computing the iDFTs of the product of the DFTs of two sequences.
The proposed FFT algorithm eliminates the order permutation. The algorithm includes two FFT programs. One of the two FFT programs is to compute the DFTs of sequences, which uses the decimationin-frequency (DIF) structure of SRFFT. The other program is devised for computing the inverse DFT (iDFT) of the product of two DFTs, which uses the decimation-in-time structure of SRFFT. Of the two, the latter only requires real outputs, and is an invariant of the real split-radix inverse FFT. Compared with the standard SRFFT algorithm, the proposed iFFT algorithm does not need to permute their orders, and can save half of real operations. The simulation result shows that the evaluations of the correlation between two sequences in the proposed manner save CPU time ranging from 66.0% to 88.0% over that in MAFFT. The program of the DIF SRFTT algorithm is similar to that of the DIT SRFFT algorithm, only the direction of control flow and the types of butterflies are different. Two three-loop structure programs are developed on Windows and Ubuntu in C/C++ language. The searching technique of the L-shape block adopts the method presented by Sorensen, Heideman, and Burrus in [33]. To minimize the access to the lookup table of twiddle factors, two programs all breath-first traverse all the L-shape blocks. The programs stride m − 1 stages in the outer loop. In the middle loop, the programs lookup the table for twiddle factor of one L-shape butterfly and prepare for the implementation
1545-5963 (c) 2015 IEEE. Personal use is permitted, but republication/redistribution requires IEEE permission. See http://www.ieee.org/publications_standards/publications/rights/index.html for more information.
This article has been accepted for publication in a future issue of this journal, but has not been fully edited. Content may change prior to final publication. Citation information: DOI 10.1109/TCBB.2016.2530064, IEEE/ACM Transactions on Computational Biology and Bioinformatics 8
of the butterfly in the inner loop. The programs implement one L-shape butterfly at each L-shape block while the programs traverses the block in the inner loop. The final stage for the DIF structure and the first stage for the DIT structure consist of length-2 DFTs. The length-4 L-shape butterfly is not proper for them.
TABLE 2: Computational complexity of correlation computation of two sequences Computational complexity Amino acid Nucleotide Amino acid Nucleotide
5
P ERFORMANCE A NALYSIS
In this section, we analyze the performance of the proposed algorithms by comparing with those in MAFFT. The analysis and comparison include the computational complexity, and the access to the lookup table of twiddle factors.
5.1
Computational Complexity
Assume the lengths of FFTs are N in the computation of the correlations of the aligning sequences. We now consider the computational complexities of the proposed scheme and MAFFT for the computation of the correlation of two sequences. In MAFFT, a DFT or iDFT of length-N is implemented with a general radix-2 FFT program in the computational complexity of 5N log2 N − 10N + 16. The FFT source code in MAFFT has been taken from Ref. [32]. The computations of correlations of two amino acid sequences contains the evaluations of 4 DFTs and 2 iDFTs of length-N . In addition, the computations contain 2N complex multiplications and N real additions. For the correlations of two nucleotide sequences, MAFFT requires the evaluations of 8 DFTs and 4 iDFTs of length-N , 4N complex multiplications, and 3N real additions. In the proposed algorithms, a DFT of length-N is implemented with the DIF SRFFT algorithm in the computational complexity of 4N log2 N − 6N + 8, and an iDFT of length-N is implemented with the real data DIT SRFFT algorithm in the computational complexity 2N log2 N − 3N + 4. For the correlations of two amino acid sequences, there are 2 DFTs and 1 iDFT of length-N needed to evaluate. In addition, the computations requires N complex multiplications. For the correlations of two nucleotide sequences, the computations contain the evaluations of 4 DFTs and 2 iDFTs of length-N , 2N complex multiplications, and N real additions. Table 2 shows the computational complexities of the proposed scheme and MAFFT for the correlations of two sequences. We can see that the proposed scheme obtained a substantial reduction of computational complexity for the correlations of both two amino acid sequences and two nucleotide sequences.
Amino acid Nucleotide
2002 MAFFT 30N log2 N − 47N + 96 60N log2 N − 93N + 192 Newer MAFFTs 15N log2 N − 24N + 48 60N log2 N − 93N + 192 Proposed scheme 10N log N − 10N + 20 20N log2 N − 19N + 40
Rounds of order permutation 6 12 3 12 0 0
5.2 Access to Lookup Table In recent decades, the memory performance improvements have not kept pace with the processor performance improvements, and this trend is likely to continue. So, it becomes increasingly important for memory assess to be optimized on modern processors. There are few algorithms considering the access optimization to twiddle factors which arise in Cooley and Tukey’s algorithm. The twiddle factors are a set of complex roots of unity, fixed by the transform order and the particular algorithm [37]. The breath-first Cooley and Tukey’s traversing algorithms requires O(N ) access to twiddle factors, and paper [38] presented a more irregular algorithm requiring fewer than N/2, where N = 2m is the length of the DFT. These traversals require striding access to memory (sample data), which is more expensive than the sequential access to memory. However, by using some cache optimization strategies [39], this deficiency can be avoided. Bowers et al. presented GT and G-based implementations requiring N access to twiddle factor and no such striding access to memory (sample data). However, GT - and G-based algorithms are only suitable for the radix-2 FFT algorithm for powers-of-two DFTs. The two implementations in this paper requiring N − 2 while the twiddles factors W 0 and W N/8 being or not being initiated and stored in the registers of the processor. Their regularity is the same as that of the breath-first Cooley and Tukey’s algorithm and more regular than that of [38].
6
R ESULTS
6.1 Simulations In order to evaluate the performance of the proposed method, we conduct simulations which are focused on the algorithm efficiency and the number of detected homologous regions. All of the simulations are performed on an Ubuntu operating system (Intel Xeon E6700 3.2 GHz with 2 GB of memory). The gcc version 4.5.2 compiler was used with the optimization option ’-O3’. We set five switch constants in mltaln.h in MAFFT source code to control five modifications that can affect MAFFT performance. The five switch constants are listed as follows.
1545-5963 (c) 2015 IEEE. Personal use is permitted, but republication/redistribution requires IEEE permission. See http://www.ieee.org/publications_standards/publications/rights/index.html for more information.
This article has been accepted for publication in a future issue of this journal, but has not been fully edited. Content may change prior to final publication. Citation information: DOI 10.1109/TCBB.2016.2530064, IEEE/ACM Transactions on Computational Biology and Bioinformatics 9
MOD.1 control “fftWinSize” = 30 or = 100 for DNA sequence alignment. The value of the variable “fftWinSize” is the size of the sliding window. • MOD.2 control whether or not neglects the sentence in Falign.c, in the function “Falign()”: “if( tmpint == 0) break;”. In the loop of the identification of homologous regions from the 20 highest values of the correlations, this sentence control to exit the loop if the current correlation does not contains a homologous region. • MOD.3 control whether or not add MAXLAG/2 to the alignment length “nlen” in Falign() in Falign.c. MAXLAG/2 is derived from the variable “α” of the proposed linear convolution scheme. In the modified MAFFT, MAXLAG/2 is 75. • MOD.4 control the possible candidate lags whether or not in the range from -MAXLAG/2 to MAXLAG/2. • MOD.5 control whether or not use the new FFT program. In order to obtain an optimal performance, several modifications may be combined in a revision. The MAFFT with the optimal combination of modification 1, 4 and 5 is the so-called modified MAFFT in the paper. For a protein sequence alignment, the modification 1 is neglected automatically by the modified MAFFT. •
By ROSE program [40], [41], we generate the two datasets “DNA01” and “Protein” with Relatedness = 10, and the two datasets “DNA02” and “DNA03” with Relatedness = 20. Every dataset contains nine pairs of sequences whose lengths are from 128 to 32768. The datasets “DNA01” and “Protein” are also the datasets were provided to re-procedure the results in the last round review. From the results based datasets “DNA01” and ”DNA02”, it is demonstrated that our proposed linear convolution scheme can detect more homologous regions for DNA sequence alignment. The dataset “DNA03” is a general DNA sequence dataset to demonstrate the general performance of our proposed scheme. The dataset “Protein” is a protein sequence dataset, which can demonstrate the advantage that our proposed linear convolution scheme can detect more homologous regions for protein sequence alignment. Table 3 shows the number of the identified homologous regions for the four datasets “DNA01”, “DNA02”, “DNA03” and “Protein” by MAFFT with cyclic or linear convolution. For the dataset “DNA01”, the sliding window sizes of MAFFT with cyclic or linear convolution are all 30 sites. For the datasets “DNA02” and “DNA03”, the sliding window sizes of MAFFT with cyclic or linear convolution are all 100 sites, i.e., the default sliding window size of the original MAFF for DNA sequences. For the dataset “Protein”, the sliding window sizes of MAFFT with
cyclic or linear convolution are all 20 sites, i.e., the default sliding window size of the original MAFFT for protein sequence alignment. The sliding window size for DNA sequence alignment can be 30 or 100 sites by set the switch constant “MOD.1” to “0” or “1”. MAFFT with linear convolution should set the switch constant “MOD.3” to “1”, i.e., extend the lengths of aligning sequences to reach the length of linear convolution. The switch constant “MOD.3” in MAFFT with cyclic convolution should be “0”. The values in Table 3 are the final values of the variable “count” in the function “Falign()“ in the c++ program “Falign.c” for different lengths of MAFFT with cyclic or linear convolution, i.e., the total number of detected homologous regions. For the two values of MAFFT with cyclic or linear convolution of each sequence length of each dataset, the first one can be obtained when the switch constant “MOD.2” is “0”, and the second one can be obtained when the switch constant “MOD.2” is “1”. From the mathematical point of view, the number of the identified homologous regions depends on the way whether the correlations are computed using linear convolution or cyclic convolution. The cyclic convolution will result in an incomplete computation of correlations between aligning sequences, as the discussion in Section 3.1 (One-to-One Alignment). When the sequences in the datasets “DNA01”, “DNA02” and “Protein” are generated by ROSE, only those are detected more homologous regions with the proposed linear convolution are kept. The experimental results show that MAFFT with linear convolution can identify homologous regions twice those of cyclic convolution for these three datasets. From the bioinformatics point of view, the alphabets in the sequences are arranged in a methodical manner rather than a random fashion. Thus, for a general sequence alignment, the effect of the linear convolution will be not so obvious like the datasets “DNA01”, “DNA02” and “Protein”. The dataset “DNA03” contains a set of general DNA sequences generated by ROSE program [40], [41]. When the switch constant “MOD.2” is “0”, the number of detected homologous regions by MAFFT with linear convolution is the same as that of MAFFT with cyclic convolution. When the switch constant “MOD.2” is “1”, and the number of detected homologous regions by MAFFT with linear convolution is 6 more than that of MAFFT with cyclic convolution. This results can show the general performance of our proposed scheme in detecting homologous regions. Besides the number of detected homologous regions, the proposed scheme can affect the efficiency of the region-level DP by the parameter α in Eq. (11). The simulations estimate the efficiency in CPU time of the proposed scheme. Tables 4, 5, 6 and 7 give respectively the CPU time of the four datasets. The time in Tables
1545-5963 (c) 2015 IEEE. Personal use is permitted, but republication/redistribution requires IEEE permission. See http://www.ieee.org/publications_standards/publications/rights/index.html for more information.
This article has been accepted for publication in a future issue of this journal, but has not been fully edited. Content may change prior to final publication. Citation information: DOI 10.1109/TCBB.2016.2530064, IEEE/ACM Transactions on Computational Biology and Bioinformatics 10
TABLE 3: Number of detected homologous regions by MAFFT with cyclic or linear convolution Length 128 256 512 1024 2048 4096 8192 16384 32768 Total
DNA01 (fftWinSize=30) Cyclic Linear 2/2 1/2 2/2 2/3 0/2 2/3 1/7 7/8 1/1 1/5 0/3 2/5 5/12 5/15 53/62 62/64 0/34 37/38 64/128 121/141
DNA02 (fftWinSize=100) Cyclic Linear 0/0 0/0 0/0 0/0 0/1 0/1 0/1 0/3 9/9 12/12 0/14 24/24 25/26 25/32 37/50 37/52 30/73 65/83 101/174 163/207
4, 5, 6 and 7 is the CPU time that one alignment spend in one execution of the function “Falign()” in the program “Falign.c” of MAFFT. Every result is the CPU time of one execution of an alignment. Although the results contain some uncertainties, the trend of the results is certain. By comparing the CPU time of the original MAFFT to that of MAFFT with five separate modifications or the modified MAFFT, we can see that the separate modifications 1, 4, and 5 can improve slightly the efficiency of MAFFT in CPU time, and the separate modifications 2 and 3 will impair the efficiency of sequence alignment of MAFFT in CPU time, but the combination of the modifications 1, 4 and 5 can greatly improve the efficiency of MAFFT in CPU time for DNA sequence alignment. The combination of modifications 1 and 4 requires CPU time more than the combination of the modifications 1, 4 and 5. The combination of modifications 4 and 5 can greatly improve the efficiency of MAFFT in CPU time for protein sequence alignment. Taken Table 3 and Tables 4, 5, 6 and 7 together, we can draw several interesting conclusions. (1) By extending the lengths of sequences, the linear convolution can identified more homologous regions. However, this separate modification impairs the performance of MAFFT in CPU time, since the computation of the extended FFT needs extra CPU time, and the identified homologous regions which are not detected by the original MAFFT are perhaps redundancy for the sequence alignment in bioinformatics. (2) Similarly, although by setting switch constant “MOD.3” to 1, i.e., neglecting the sentence “if( tmpint == 0) break;” in the function “Falign()” in the program “Falign.c”, MAFFT can identified more homologous regions, this modification also impairs the performance of MAFFT in CPU time in most cases. (3) The parameter α of the proposed scheme, i.e., the limitation of the proposed linear convolution, is very useful for improving the performance of MAFFT in CPU time, the possible reason is this parameter can improve the efficiency of region-level DP. (4) To estimate the effect of the modification of the sliding window size on alignment accuracy, (the sliding window in the modified MAFFT is set to 30 sites rather than 100 sites for DNA sequence alignment), we compare the alignments of the original
DNA03 (fftWinSize=100) Cyclic Linear 0/0 0/0 1/1 1/1 3/3 3/3 0/0 0/0 9/9 9/9 1/1 1/2 48/48 48/49 80/80 80/84 36/38 36/38 178/180 178/186
Protein (fftWinSize=20) Cyclic Linear 1/1 2/2 2/2 4/4 1/2 4/4 6/8 11/17 5/13 7/19 0/19 29/33 7/13 12/21 36/44 55/59 44/100 117/117 102/202 241/276
MAFFT with those of the modified MAFFT for our four designed datasets and BAliBASE 3.0 benchmark tests (RV11, RV12, RV20, RV30, RV40, and RV50), and find that the alignments of the modified MAFFT are fully identical to that of the original MAFFT, except for the one alignment of “BB20041” of BAliBASE 3.0 benchmark tests for MAFFT-FFT-NS1, and the three alignments of “BB20041”, “BB30008” and “BB40035” of BAliBASE 3.0 benchmark tests for MAFFT-FFTNS2. However, even for these four exceptions, their SP scorce and TC score are all the same. Thus, although we are not sure, but we want to say that it perhaps does not affect the alignment accuracy for the modified MAFFT to set the sliding window to 30 sites for DNA sequence alignment.
6.2 Experiment on BALiBASE To benchmark our proposed algorithm for MSA, we do experiment by using BALiBASE 3.0, a standard benchmark database for MSA [42], [43] We used the benchmark BAliBASE3.0 to assess the alignment accuracy of the modified algorithm in comparison with the original MAFFT program. Two accuracy measures were used to score the alignment, i.e., the quality score (Q), which is the number of correctly aligned residue pairs divided by the number of residue pairs in the reference alignment, and total column score (TC), which is the number of correctly aligned columns divided by the number of columns in the reference alignment [3]. Tables 8 shows the accuracy of different categories of BAliBASE3.0. From this table, we can see that the modified program maintains identical accuracy to the original MAFFT, which effectively verifies the validity of the proposed algorithm. The original MAFFT FFT-NS-2 can save about 6-8 seconds for each one BAliBASE 3.0 benchmark tests (RV11, RV12, RV20, RV30, RV40, and RV50) on our platform. In original MAFFT, the aligning sequence is padded automatically with zeros, since their length has to reach to, power-of-two, the length of the FFT algorithm, which satisfies partially and even fully the configuration of the linear convolution. In addition,
1545-5963 (c) 2015 IEEE. Personal use is permitted, but republication/redistribution requires IEEE permission. See http://www.ieee.org/publications_standards/publications/rights/index.html for more information.
This article has been accepted for publication in a future issue of this journal, but has not been fully edited. Content may change prior to final publication. Citation information: DOI 10.1109/TCBB.2016.2530064, IEEE/ACM Transactions on Computational Biology and Bioinformatics 11
TABLE 4: CPU time for DNA sequences of the dataset “DNA01” Length 128 256 512 1024 2048 4096 8192 16384 Total
Original MAFFT (A) 0.001389 0.001134 0.015931 0.055985 0.117004 0.309503 1.203741 1.227750 2.932437
MAFFT with one separate MOD.1 MOD.2 MOD.3 0.001546 0.002285 0.001572 0.004628 0.006249 0.004589 0.016134 0.019815 0.01684 0.053899 0.067599 0.061342 0.092274 0.100446 0.110018 0.279974 0.348462 0.282558 0.308130 0.598595 1.177470 0.551834 1.201293 1.180107 1.308419 2.344744 2.834496
modification MOD.4 MOD.5 0.001417 0.001351 0.004267 0.004247 0.016097 0.016244 0.060380 0.016710 0.071478 0.064984 0.303333 0.312860 1.123019 1.136245 1.198868 1.207881 2.778859 2.760522
MAFFT with modifications 1 and 4 (C) 1, 4 and 5 (B) 0.001169 0.001361 0.004332 0.004443 0.006176 0.006069 0.013661 0.013470 0.081252 0.044558 0.129712 0.164499 0.350047 0.267397 0.525641 0.457826 1.111990 0.959623
(A-B)/B (%) 2.06% -74.48% 162.50% 315.63% 162.59% 88.15% 350.17% 168.17% 205.58%
TABLE 5: CPU time for DNA sequences of the dataset “DNA02” Length 128 256 512 1024 2048 4096 8192 16384 Total
Original MAFFT (A) 0.001454 0.004458 0.015343 0.058716 0.028103 0.262949 0.318229 1.207311 1.896563
MAFFT with one separate MOD.1 MOD.2 MOD.3 0.001223 0.002380 0.001555 0.001223 0.006369 0.004671 0.010697 0.013929 0.015806 0.023127 0.044397 0.059570 0.018053 0.041607 0.058127 0.269357 0.118905 0.209513 0.230719 0.345677 0.326979 0.686704 0.643782 1.176340 1.241103 1.217046 1.852561
modification MOD.4 MOD.5 0.001502 0.001477 0.004476 0.004390 0.015275 0.015394 0.023259 0.058551 0.028346 0.016519 0.079892 0.255548 0.305558 0.308853 1.159312 1.161829 1.617620 1.822561
MAFFT with modifications 1 and 4 (C) 1, 4 and 5 (B) 0.001256 0.001098 0.004480 0.002250 0.005793 0.004222 0.012112 0.018256 0.017888 0.017821 0.049850 0.046833 0.207477 0.147998 0.225703 0.168733 0.524559 0.407211
(A-B)/B (%) 32.42% 98.13% 263.41% 221.63% 57.70% 461.46% 115.02% 615.52% 365.74%
TABLE 6: CPU time for DNA sequences of the dataset “DNA03” Length 128 256 512 1024 2048 4096 8192 16384 Total
Original MAFFT (A) 0.001400 0.003290 0.004070 0.060661 0.030596 0.207959 0.094544 0.166922 0.569442
MAFFT with one separate MOD.1 MOD.2 MOD.3 0.001056 0.002317 0.002259 0.002250 0.004142 0.004836 0.004331 0.007429 0.007256 0.01224 0.018181 0.028259 0.019551 0.042238 0.042297 0.064030 0.235004 0.249427 0.039005 0.052383 0.069707 0.148517 0.137867 0.113686 0.290980 0.499561 0.517727
modification MOD.4 MOD.5 0.001405 0.001408 0.002336 0.002345 0.003969 0.003998 0.039354 0.060623 0.030370 0.055439 0.216534 0.217959 0.075640 0.024645 0.081787 0.103309 0.451395 0.469726
MAFFT with modifications 1 and 4 (C) 1, 4 and 5 (B) 0.001044 0.000302 0.002219 0.002170 0.004243 0.004258 0.018390 0.018101 0.019273 0.019250 0.099573 0.074558 0.087496 0.045547 0.117290 0.080412 0.349528 0.244598
(A-B)/B (%) 363.58% 51.61% -4.42% 235.13% 58.94% 178.92% 107.57% 107.58% 132.81%
TABLE 7: CPU time for protein sequences of the dataset “Protein” Length 128 256 512 1024 2048 4096 8192 16384 Total
Original MAFFT (A) 0.000872 0.001852 0.005425 0.005570 0.029323 0.249468 0.305795 0.665334 1.263639
MAFFT MOD.2 0.001841 0.003652 0.008088 0.034733 0.076400 0.063404 0.445294 0.573191 1.206603
with one separate modification MOD.3 MOD.4 MOD.5 0.001404 0.000902 0.000922 0.002116 0.001807 0.001845 0.005767 0.004150 0.005453 0.017446 0.010314 0.010615 0.024328 0.076035 0.029054 0.128520 0.080873 0.221190 0.105022 0.099321 0.274955 2.481259 0.221617 0.599801 2.765862 0.495019 1.143835
Modified MAFFT (B) 0.001218 0.001617 0.004610 0.010374 0.057397 0.073178 0.173370 0.286970 0.608734
(A-B)/B (%) -28.41% 14.53% 17.68% -46.31% -48.91% 240.91% 76.38% 131.85% 107.58%
TABLE 8: Accuracy of different categories of BAliBASE3.0 Method MAFFT-FFT-NS-1 MAFFT-FFT-NS-2 MAFFT-FFT-NS-i NEW-FFT-NS-1 NEW-FFT-NS-2 NEW-FFT-NS-i
RV11 Q/TC 0.598/0.340 0.603/0.382 0.615/0.395 0.598/0.340 0.603/0.382 0.615/0.395
RV12 Q/TC 0.927/0.779 0.974/0.786 0.982/0.796 0.927/0.779 0.974/0.786 0.982/0.796
RV20 Q/TC 0.967/0.361 0.979/0.370 0.989/0.382 0.967/0.361 0.979/0.370 0.989/0.382
RV30 Q/TC 0.811/0.332 0.819/0.475 0.832/0.490 0.811/0.332 0.819/0.475 0.832/0.490
RV40 Q/TC 0.820/0.451 0.884/0.530 0.899/0.547 0.820/0.451 0.884/0.530 0.899/0.547
RV50 Q/TC 0.848/0.511 0.853/0.525 0.864/0.539 0.848/0.511 0.853/0.525 0.864/0.539
average Q/TC 0.812/0.439 0.829/0.525 0.841/0.538 0.812/0.439 0.829/0.525 0.841/0.538
1545-5963 (c) 2015 IEEE. Personal use is permitted, but republication/redistribution requires IEEE permission. See http://www.ieee.org/publications_standards/publications/rights/index.html for more information.
This article has been accepted for publication in a future issue of this journal, but has not been fully edited. Content may change prior to final publication. Citation information: DOI 10.1109/TCBB.2016.2530064, IEEE/ACM Transactions on Computational Biology and Bioinformatics 12
the data size of BAliBASE entries are small. Thus, the speed improved by the modified program is small on BAliBASE 3.0 benchmark tests. The real time of BAliBASE 3.0 tests is showed as Table 9. The time contains not only CPU time but also the time of other operations. The benchmark tests contain RV11, RV12, RV20, RV30, RV40, and RV50. TABLE 9: Real time of BAliBASE 3.0 benchmark tests (RV11, RV12, RV20, RV30, RV40, and RV50) Original MAFFT Modified MAFFT
7
FFT-NS-1 (s) 45.719 44.615
FFT-NS-2 (s) 92.954 89.342
C ONCLUSION
We have developed a scheme for the correlations computation between aligning sequences. The scheme uses one and two complex numbers to represent an amino acid residue and a nucleotide residue, respectively. The correlations and homologous regions between sequences can be obtained by using linear convolution with a limitation and sliding window analysis. The proposed correlation calculation alignment reduced half of the requirement of memory size and more than half of the real operations for computing the correlation between two sequences over the method in MAFFT. The proposed FFT algorithm eliminates the order permutation, and has the least access to the lookup table of twiddle factors. Moreover, the FFT algorithm is a novel FFT algorithm on real data, which requires only real parts of output signals. The simulation results showed that, (1) in theory, the use of the linear convolution can detect the more homologous regions, which is particularly clear to the alignment length of powers-of-two. In practice, to reach to the length of FFT algorithm, power-of-two, the original MAFFT automatically pads the sequences with zeros, which satisfy partially or even fully the configuration of the linear convolution. In addition, from the bioinformatical point of view, the identified extra homologous regions are partly redundancy for the alignment of the region-level DP, which may impair the performance of MAFFT in CPU time. Thus, the ability that the proposed linear convolution can identify more homologous regions and its effect are not as great as expected; (2) the modified MAFFT is 107.58% to 365.74% faster than the original MAFFT for one execution of the function Falign() of MAFFT, and its alignment accuracy remains unchanged for FFT-NS-1 and FFT-NS-2. The possible reason is that the limitation of the proposed linear convolution can improve greatly the performance of the region-level DP alignment in CPU time.
A PPENDIX A S UPPLEMENTARY
The source code is provided as supplementary material in the revised manuscript. The code is modified from the source code of MAFFT version 7.127b on Ubuntu in five aspects: (1) the size of the sliding window for DNA sequence alignment in the function “alignableReagion()” in the file “fftFunctions.c”. (2) one of the configurations of linear convolution, i.e., the modification of the length of alignment in the file “Falign.c”. (3) count all possible homologous regions after the analysis of the sliding window in the “Falign()” in the file “Falign.c”. (4) another configuration of linear convolution, i.e., the configuration of α in Eq. (11) in the function “getKouho()” in the file “fftFunctions.c”. (5) new FFT source code in the file “fft.c”, that is compatible with the original MAFFT. These five modifications are controlled by five switch constants “MOD.1”, “MOD.2”, “MOD.3”, “MOD.4”, and “MOD.5” in the head file “mltaln.h”. The configuration of linear convolution is an inexact and empirical evaluation, need to be improved in the future.
R EFERENCES [1]
[2]
[3]
[4] [5]
[6] [7]
[8]
[9]
[10]
[11]
[12]
[13]
ACKNOWLEDGEMENTS The authors are grateful to anonymous reviewers for their suggestions to improve the manuscript.
DATA
[14]
G. Vogt, T. Etzold, and P. Argos, “An assessment of amino acid exchange matrices in aligning protein sequences: the twilight zone revisited,” Journal of molecular biology, vol. 249, no. 4, pp. 816–831, 1995. L. Wang and T. Jiang, “On the complexity of multiple sequence alignment,” Journal of computational biology, vol. 1, no. 4, pp. 337–348, 1994. S. Hosni, A. Mokaddem, and M. Elloumi, “A new progressive multiple sequence alignment algorithm,” in IEEE 23rd International Workshop on Database and Expert Systems Applications (DEXA). IEEE, 2012, pp. 195– 198. J. Stoye, “Multiple sequence alignment with the divide-and-conquer method,” Gene, vol. 211, no. 2, pp. GC45–GC56, 1998. M. Elloumi and A. Mokaddem, “A heuristic algorithm for the n-lcs problem,” Journal of the Applied Mathematics, Statistics and Informatics (JAMSI), vol. 4, no. 1, 2008. S. R. Eddy et al., “Multiple alignment using hidden markov models.” in Ismb, vol. 3, 1995, pp. 114–120. C. Notredame and D. G. Higgins, “Saga: sequence alignment by genetic algorithm,” Nucleic acids research, vol. 24, no. 8, pp. 1515–1524, 1996. ¨ R. C. Edgar and K. Sjolander, “Satchmo: sequence alignment and tree construction using hidden markov models,” Bioinformatics, vol. 19, no. 11, pp. 1404–1411, 2003. R. K. Bradley, A. Roberts, M. Smoot, S. Juvekar, J. Do, C. Dewey, I. Holmes, and L. Pachter, “Fast statistical alignment,” PLoS computational biology, vol. 5, no. 5, p. e1000392, 2009. J. D. Thompson, D. G. Higgins, and T. J. Gibson, “Clustal w: improving the sensitivity of progressive multiple sequence alignment through sequence weighting, position-specific gap penalties and weight matrix choice,” Nucleic acids research, vol. 22, no. 22, pp. 4673–4680, 1994. C. Notredame, D. G. Higgins, and J. Heringa, “T-coffee: A novel method for fast and accurate multiple sequence alignment,” Journal of molecular biology, vol. 302, no. 1, pp. 205–217, 2000. D. J. Russell, H. H. Otu, and K. Sayood, “Grammar-based distance in progressive multiple sequence alignment,” BMC bioinformatics, vol. 9, no. 1, p. 306, 2008. T. Lassmann, O. Frings, and E. L. Sonnhammer, “Kalign2: highperformance multiple alignment of protein and nucleotide sequences allowing external features,” Nucleic acids research, vol. 37, no. 3, pp. 858–865, 2009. R. C. Edgar, “Muscle: a multiple sequence alignment method with reduced time and space complexity,” BMC bioinformatics, vol. 5, no. 1, p. 113, 2004.
1545-5963 (c) 2015 IEEE. Personal use is permitted, but republication/redistribution requires IEEE permission. See http://www.ieee.org/publications_standards/publications/rights/index.html for more information.
This article has been accepted for publication in a future issue of this journal, but has not been fully edited. Content may change prior to final publication. Citation information: DOI 10.1109/TCBB.2016.2530064, IEEE/ACM Transactions on Computational Biology and Bioinformatics 13
[15]
[16]
[17]
[18]
[19]
[20]
[21]
[22] [23]
[24]
[25]
[26]
[27]
[28] [29] [30]
[31]
[32]
[33]
[34]
[35] [36]
[37]
[38]
[39]
[40]
K. Katoh and D. M. Standley, “Mafft multiple sequence alignment sequence alignments and phylogenetic reconstructions,” in Proc. Int. software version 7: improvements in performance and usability,” Conf. Intell. Syst. Mol. Biol, vol. 5, 1997, pp. 303–306. Molecular biology and evolution, vol. 30, no. 4, pp. 772–780, 2013. [41] ——, “Rose: generating sequence families.” Bioinformatics, vol. 14, O. Gotoh, “Significant improvement in accuracy of multiple protein no. 2, pp. 157–163, 1998. sequence alignments by iterative refinement as assessed by reference [42] S. Vinga and J. Almeida1, “Alignment-free sequence comparison - a to structural alignments,” Journal of molecular biology, vol. 264, no. 4, review,” Bioinformatics, vol. 19, no. 4, pp. 513–523, 2003. pp. 823–838, 1996. [43] R. R. Julie D Thompson, Patrice Koehl and O. Poch, “Balibase 3.0: S. Needleman and C. Wunsch, “A general method applicable to the latest developments of the multiple sequence alignment benchmark,” search for similarities in the amino acid sequence of two proteins,” Proteins: Structure, Function, and Bioinformatics, vol. 61, pp. 127–136, Journal of molecular biology, vol. 48, no. 3, pp. 443–453, 1970. 2005. J. Pei and N. V. Grishin, “Promals: towards accurate multiple sequence Weihua Zheng received alignments of distantly related proteins,” Bioinformatics, vol. 23, no. 7, pp. 802–808, 2007. the Ph.D. degree in computer J. S. Papadopoulos and R. Agarwala, “Cobalt: constraint-based alignscience from Hunan University, ment tool for multiple protein sequences,” Bioinformatics, vol. 23, no. 9, China, in 2015. He is an pp. 1073–1079, 2007. D. N. Ken and Y. Pan, “A knowledge-based multiple-sequence alignassociate professor of computer ment algorithm,” Computational Biology and Bioinformatics, IEEE/ACM science and technology Transactions on, vol. 10, no. 4, pp. 884–896, July/August 2013. at Hunan University of H. Carrillo and D. Lipman, “The multiple sequence alignment problem in biology,” SIAM Journal on Applied Mathematics, vol. 48, no. 5, Technology. His research pp. 1073–1082, 1988. interests include fast Fourier T. Smith, M. Waterman et al., “Identification of common molecular transform, multiscale signal subsequences,” J. mol. Biol, vol. 147, no. 1, pp. 195–197, 1981. J. D. Thompson, T. J. Gibson, F. Plewniak, F. Jeanmougin, and D. G. analysis, audio signal Higgins, “The clustal x windows interface: flexible strategies for processing, image processing, parallel computing, multiple sequence alignment aided by quality analysis tools,” Nucleic natural language understanding, machine learning, acids research, vol. 25, no. 24, pp. 4876–4882, 1997. “Mafft version 7: Multiple alignment program for amino acid knowledge representation, artificial intelligence. or nucleotide sequences: Algorithms and parameters (unfinished), http://mafft.cbrc.jp/alignment/software/algorithms/algorithms.html.” Kenli Li received the Ph.D. AL Rockwood, DK Crockett, JR Oliphant, and KS Elenitoba-Johnson, degree in computer science “Sequence alignment by cross-correlation,” Journal of Biomolecular from Huazhong University of Techniques Jbt, vol. 16, no. 4, pp. 453–458, Dec. 2005. K. Katoh, K. Misawa, K.-i. Kuma, and T. Miyata, “Mafft: a novel Science and Technology, China, method for rapid multiple sequence alignment based on fast fourier in 2003. He was a visiting transform,” Nucleic acids research, vol. 30, no. 14, pp. 3059–3066, 2002. scholar at University of Illinois T. Miyata, S. Miyazawa, and T. Yasunaga, “Two types of amino acid substitutions in protein evolution,” Journal of Molecular Evolution, at Urbana-Champaign from vol. 12, no. 3, pp. 219–236, 1979. 2004 to 2005. He is currently M. Kimura, The neutral theory of molecular evolution. Cambridge a full professor of computer University Press, 1984. G. R, “Amino acid difference formula to help explain protein evoluscience and technology at tion,” Science, vol. 185, no. 4154, pp. 862–864, 1974. Hunan University and associate S. Yamada, O. Gotoh, and H. Yamana, “Improvement in accuracy of director of National Supercomputing Center in multiple sequence alignment using novel group-to-group sequence alignment algorithm with piecewise linear gap cost,” BMC BioinforChangsha. His major research includes parallel matics, vol. 7, no. 524, pp. 1471–2105, 2006. computing, grid and cloud computing, and DNA J. D. Thompson, F. Plewniak, J.-C. Thierry, and O. Poch, “Dbclustal: computing. He has published more than 110 papers rapid and reliable global multiple alignments of protein sequences detected by database searches,” Nucleic Acids Research, vol. 28, no. 15, in international conferences and journals, such as pp. 2919–2926, 2000. IEEE-TC, IEEE-TPDS, JPDC, ICPP, CCGrid. He is an B. P. Flannery, S. A. Teukolsky, and W. T. Vetterling, Numerical Recipes outstanding member of CCF. in C: The Art of Scientific Computing (Fortran Version), 2nd ed. Cambridge, UK: Cambridge university press, 1995. Keqin Li is a SUNY H. Sorensen, M. Heideman, and C. Burrus, “On computing the splitradix fft,” IEEE Trans. Acoust., Speech, Signal Processing, vol. 34, no. 1, Distinguished Professor pp. 152–156, 1986. of computer science. His M. Vetterli and H. J. Nussbaumer, “Simple fft and dct algorithms with current research interests reduced number of operations,” Signal Processing, vol. 6, no. 4, pp. 267–278, 1984. include parallel computing and P. Duhamel and H. Hollmann, “Split-radix fft algorithm,” Elechigh-performance computing, tron.Lett., vol. 20, pp. 14–16, Jan 1984. distributed computing, energyP. Duhamel and M. Vetterli, “Fast fourier transforms: a tutorial review and a state of the art,” Signal Processing, vol. 19, no. 4, pp. 259–299, efficient computing and 1990. communication, heterogeneous K. J. Bowers, R. A. Lippert, R. O. Dror, and D. E. Shaw, “Improved computing systems, cloud twiddle access for fast fourier transforms,” Signal Processing, IEEE Transactions on, vol. 58, no. 3, pp. 1122–1130, 2010. computing, big data computing, Y. Jiang, T. Zhou, Y. Tang, and Y. Wang, “Twiddle-factor-based fft CPU-GPU hybrid and cooperative computing, algorithm with reduced memory access,” in Parallel and Distributed multicore computing, storage and file systems, Processing Symposium., Proceedings International, IPDPS 2002, Abstracts and CD-ROM. IEEE, 2001, pp. 8–pp. wireless communication networks, sensor networks, M. Frigo, C. Leiserson, H. Prokop, and S. Ramachandran, “Cachepeer-to-peer file sharing systems, mobile computing, oblivious algorithms,” in Foundations of Computer Science, 1999. 40th service computing, Internet of things and cyberAnnual Symposium on. IEEE, 1999, pp. 285–297. J. Stoye, D. Evers, and F. Meyer, “Generating benchmarks for multiple physical systems. He has published over 320 journal
1545-5963 (c) 2015 IEEE. Personal use is permitted, but republication/redistribution requires IEEE permission. See http://www.ieee.org/publications_standards/publications/rights/index.html for more information.
This article has been accepted for publication in a future issue of this journal, but has not been fully edited. Content may change prior to final publication. Citation information: DOI 10.1109/TCBB.2016.2530064, IEEE/ACM Transactions on Computational Biology and Bioinformatics 14
articles, book chapters, and refereed conference papers, and has received several best paper awards. He is currently or has served on the editorial boards of IEEE Transactions on Parallel and Distributed Systems, IEEE Transactions on Computers, IEEE Transactions on Cloud Computing, Journal of Parallel and Distributed Computing. He is an IEEE Fellow. Hing Cheung So (S’90-M’95SM’07-F’15) was born in Hong Kong. He received the B.Eng. degree from the City University of Hong Kong and the Ph.D. degree from The Chinese University of Hong Kong, both in electronic engineering, in 1990 and 1995, respectively. From 1990 to 1991, he was an Electronic Engineer with the Research and Development Division, EverexSystems Engineering Ltd., Hong Kong. During 1995-1996, he was a Postdoctoral Fellow with The Chinese University of Hong Kong. From 1996 to1999, he was a Research Assistant Professor with the Department of Electronic Engineering, City University of Hong Kong, where he is currently an Associate Professor. His research interests include detection and estimation, fast and adaptive algorithms, multidimensional harmonic retrieval,robust signal processing, sparse approximation, and source localization. He has been on the editorial boards of IEEE Signal Processing Magazine (2014-), IEEE Transactions on Signal Processing (2010-2014), Signal Processing (2010-), and Digital Signal Processing (2011-). In addition, he is an elected member in Signal Processing Theory and Methods Technical Committee (2011-) of the IEEE Signal Processing Society where he is chair in the awards subcommittee (2015-). He has been elected Fellow of IEEE in recognition of his contributions to spectral analysis and source localization.
1545-5963 (c) 2015 IEEE. Personal use is permitted, but republication/redistribution requires IEEE permission. See http://www.ieee.org/publications_standards/publications/rights/index.html for more information.