Proceedings of the International MultiConference of Engineers and Computer Scientists 2009 Vol II IMECS 2009, March 18 - 20, 2009, Hong Kong
A Modified Statistical Design Model of Double Sampling X Control Chart Chau-Chen Torng, Pei-Hsi Lee Abstract - The double sampling (DS) control chart can efficaciously reduce sample sizes and increase performance of process monitoring. Hsu [Int. j. prod. res., vol. 42, no. 5, pp. 1043-1047] mentioned that the statistical design model of DS X control chart could merely minimize sample sizes during in-control process monitoring but fail to decrease sample sizes during detection of process shifts. In this study, with minimization of sample sizes for both in-control process and out-of-control process, a multi-objective programming method and genetic algorithm are proposed for statistical designs of DS X control chart. In comparison with both statistical design models, it is quite obvious that our model can effectively lower sample sizes of two process situations. Keywords - double sampling X control chart; statistical design; multi-objective programming; genetic algorithm
I. INTRODUCTION The Shewhart’s control chart has been extensively used as a tool for process monitoring in current industries. For Shewhart’s X control chart, the performance to detect process mean shift can be increased through increase of sample sizes without any change in probability of occurrence of false alarms. However, increase in sample sizes signifies raise of costs and inspection time. Daudin[5] applied the concept of double sampling plans to the Shewhart’s X control chart and used the two-stage Shewhart’s X control chart to monitor processes, so that it was called as Double Sampling X control chart (DS X control chart). With this alternative method used, the advantage of the Shewhart’s control chart, i.e., simplification at setup and calculation, can be maintained in addition to improvements in capability of detecting process mean shift and reduction of sample sizes.
Manuscript received November 30, 2008. This work was supported by the National Science Council of Taiwan, ROC, under the grant NSC 97-2221-E-224-032. C. C. Torng is now with Graduate School of Industrial Engineering and Management, National Yunlin University of Science and Technology, 123 University Road, Section 3, Douliou, Yunlin 64002, Taiwan, R.O.C. (e-mail:
[email protected]). P. H. Lee is with Graduate School of Industrial Engineering and Management, National Yunlin University of Science and Technology, 123 University Road, Section 3, Douliou, Yunlin 64002, Taiwan, R.O.C. (Tel: 886953462766, Fax: 886-5-5312073, e-mail:
[email protected]).
ISBN: 978-988-17012-7-5
Additionally, through modification of sampling methods of the Shewhart’s X control chart, the methods such as X charts with variable sample sizes (VSS) and X charts with variable sampling intervals (VSI) are also provided. For both charts, changes in sample sizes and sampling intervals of the Shewhart’s X control chart lead to VSS and VSI respectively, which own better performances to detect process mean shift[1][13]. However, with Costa[2] comparing performances of process mean shift detection for VSS, VSI and DS X control chart, the best performances occur at the DS X control chart. On account of this reason, the DS X control chart is an arresting subject in our study. Before using the DS X control chart, we have to design five parameters for this control chart: widths of two sets of control limits, sample sizes of two stages and widths of a set of warning limits. During process monitoring, various designs will cause different statistic performances for the DS X control chart. After considering statistic viewpoints, Irianto and Shinozaki[7] selected the Single-Objective programming method to determine the optimal design of the DS X control chart. Additionally, while referring to methods by Irianto and Shinozaki[7] (namely I&S model in the following sections), He et al.[4][5][6] designed various DS X control charts. In the I&S model, the expected sample size under in-control process becomes the objective function of the model and the best design of the DS X control chart determined by subject to risk probabilities of two process states in control charts. However, according to designs of the DS X control chart by He et al.[5], Hsu[11] listed the expected sample size of out-of-control process and found failure in I&S methods that the expected sample size for detection of out-of-control process cannot be reduced and its sample size is even larger than that of the Shewhart’s control chart. Thus, using I&S methods cannot find the optimal design of the DS X control chart. On the basis of above-mentioned reasons, the concept to minimize the expected sample size of out-ofcontrol process and the multi-objective programming method are used to modify the I&S statistical design model in this study. Finally, we will use statistic performance to illustrate the differences of our modified model and I&S methods. II. DS X CONTROL CHART A. Principles of the DS X control chart
IMECS 2009
Proceedings of the International MultiConference of Engineers and Computer Scientists 2009 Vol II IMECS 2009, March 18 - 20, 2009, Hong Kong
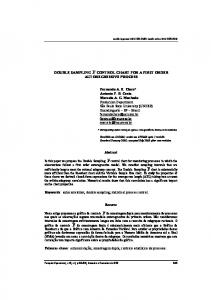
The DS X control chart proposed by Daudin[9] integrated two Shewhart’s X control charts with different widths of control limits for process monitoring and added warning limits in the first-stage control chart. The graphic view of the DS X control chart is shown in Fig. 1 that the process observations are transformed to a standard normal distribution. Therefore, the central lines of control charts in two stages are 0. L1 and L2 are the width of control limits in the first-stage control chart and the second-stage control chart respectively. W is the width of warning limits in the first-stage control chart.
false alarm and its probability can be calculated by following equation: α = P( z ∈ I 3 ) + P( z ∈ I 2 ) × P ( z 2 ∈ I 5 )
= P( z ∈ I 3 ) + P( z ∈ I 2 )× [1 − P(z 2 ∈ I 4 )] = 1 − [Φ(L1 ) − Φ(− L1 )]
⌠ ⎧⎪ ⎡ ⎛ n ⎞ ⎛ n ⎞⎤ ⎫⎪ + ⎮ ⎨1 − ⎢Φ⎜⎜ cL2 − z 1 ⎟⎟− Φ⎜⎜ − cL2 − z 1 ⎟⎟⎥ ⎬ϕ ( z )dz ⎮ ⎪ ⎢ ⎝ n n 2 ⎠ 2 ⎠⎥ ⎝ ⎦ ⎪⎭ ⌡z∈I 2 ⎩ ⎣
(1)
Φ is the cumulative distribution function of a standard normal distribution. ϕ is the probability density function of a standard normal distribution. c = (n1 + n2 ) n2 . P(•) is the probability that z falls in some region. By principles of the DS X control chart, it is not consequential to addition to sample size n2 for each sampling. The probability of addition to sample size n2 is P(z ∈ I 2 ) . Using this probability can estimate the expected sample size E0(N) of the DS X control chart under in-control processes.
Fig. 1. Graphic view of DS X control chart
Under an assumption that process state is in control, each control region in Fig. 1 can be defined as I1 = [− W , W ] , I 2 = [-L1,-W ) ∪ (W,L1 ] , I 3 = (− ∞,− L1 ] ∪ [L1 ,+∞ ) and I 4 = [− L2 , L2 ] and I 5 = (− ∞,− L2 ] ∪ [L2 ,+∞ ) .
Daudin[9] has explicitly illustrated the control procedure of the DS X control chart. First, take a small sample size, n1, and calculate the sample mean X1 . Then, calculate z using a normalize approach, that is, z = n1 (X 1 − μ ) σ . If z falls in I3, it will be considered as an out-of-control process. If z falls in I1, it will be deemed an in-control process. For the case that z falls in I2, it is necessary to conduct a second-time sampling and monitor processes with the second-stage control chart. With the second-time sampling occurring, the sample size will be n2 (usually n1< n2) and the sample mean X 2 for the second-time sampling needs to be calculated. Then, the total sample mean Y for both sampling stages can be calculated with Y = (n1 X1 +n2 X2 ) (n1 +n2) . Afterward, normalize value of Y will be represented with z2, z2 = n1 + n2 (Y − μ) σ . When z2 falls in I4, it will be considered as an in-control process. Otherwise, it will be regarded as an out-ofcontrol process. Irianto and Shinozaki[7] assumed a normal distribution for the observation of process and displayed calculations of Type I error probability and Type II error probability. Both He et al.[5] and Hsu[9] adopted same methods to calculate probabilities of Type I and Type II errors in DS X control chart and evaluated statistic performances of process monitoring. Supposing the real process is an in-control state but the sample mean falls in I3 or I5, it will be concluded that is called Type I error or
ISBN: 978-988-17012-7-5
E 0 ( N ) = n1 + n 2 P ( z ∈ I 2 ) = n1 + n 2 × [Φ (− W ) − Φ (− L1 ) + Φ (L1 ) − Φ (W )]
(2) In case of process variation that the process mean is shifted to μ1=μ0+δσ from initial mean μ0, where δ is the shift size of process mean (by equation δ= (μ1-μ0)/σ), the process will be wrong determined as an in-control state that is called Type II error. The probability of this false determination is
(
β δ = P ( z ∈ I 1* ) + P ( z ∈ I 2* )× P ( z 2 ∈ I 4* ) = Φ L1 + δ n1
)
⌠ ⎡ ⎛ n1 ⎞ ⎟ − Φ − L1 + δ n 1 + ⎮ ⎢ Φ ⎜⎜ cL 2 + cδ n1 + n 2 − z ⎟ ⎮ n 2 ⎠ ⎢ ⌡ z∈ I 2* ⎣ ⎝
(
)
(3)
⎛ n ⎞⎤ − Φ ⎜⎜ − cL 2 + cδ n1 + n 2 − z 1 ⎟⎟ ⎥ϕ ( z )dz n 2 ⎠ ⎥⎦ ⎝
where I* means the control region that process mean has shifted, I 2* = [− L1 + δ n1 , -W + δ n1 ) ∪ (W + δ n1 ,L1 + δ n1 ] . The expected sample size Eδ(N) for a shift size δ is
[( ) n ) − Φ (W + δ n )]
E δ (N ) = n1 + n 2 P (z ∈ I 2* ) = n1 + n 2 × Φ − W + δ n1
(
) (
− Φ − L1 + δ n1 + Φ L1 + δ
1
(4)
1
Average run length (ARL) is usually taken as an index to evaluate the statistic performances of process monitoring in control charts. It is defined as the average times to detect process mean shift. Thus, the statistic performances of process monitoring in control charts can be more completely shown through ARL than α and β. For in-control process, the average run length is written as ARL0, ARL0=1/α. When process mean had shifted, and its shift size is δ, the necessary average sampling times for detecting shift in a control chart can be expressed as ARLδ=1/(1-βδ).
IMECS 2009
Proceedings of the International MultiConference of Engineers and Computer Scientists 2009 Vol II IMECS 2009, March 18 - 20, 2009, Hong Kong
B. The I&S statistical design By statistic viewpoints, Irianto and Shinozaki[7] constructed a nonlinear programming model to solve the designs of the DS X control chart. The major consideration in the I&S model is to emphasize economic benefits of costs at sampling inspections, meanwhile, objective function of this model is to minimize E0(N). For better performances in process monitoring of control charts, α and β have to be restricted to less than some specific values. The I&S model is described as follows,
n2
n1,
n2
∈
Integer L1 L1