A Monte Carlo Simulation based Two-stage Adaptive Resonance Theory Mapping Model for. Site Classification in Offshore Oil Spill and Leakage Monitoring.
A Monte Carlo Simulation based Two-stage Adaptive Resonance Theory Mapping Model for Site Classification in Offshore Oil Spill and Leakage Monitoring Northern Region Persistent Organic Pollution Control (NRPOP) Laboratory, Faculty of Engineering and Applied Science, Memorial University of Newfoundland
lack of consideration in the coexisting of uncertainty and complexity
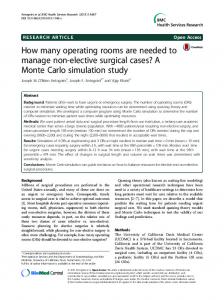
Monte Carlo simulation + Two-stage adaptive resonance theory mapping (TSAM) MC-TSAM Site classification for supporting offshore oil spill monitoring in south coast of Newfoundland, Canada
Input Normalization ART1
Stage 1: Centroid determination
ART output group Expected group numbers Cluster centroid calculation
Satisfy?
No
Yes
ART2b ART2a
Match tracking Map field
Stage 2: Classification
Classification results
The adaptive resonance theory mapping (ART) approach can provide an accurate classification result, but the number of final output groups cannot be controlled. The group number can be controlled by ART Mapping (ARTMap) approach; however, it requires criteria for supervised learning. In traditional methods the criteria are usually obtained from literature or trough questionnaire survey, which could be inefficient and lead to errors in results. The TSAM approach can help solve these problems by using ART unsupervised classification and centriod determination modules in the first stage to generate criteria for the ARTMap supervised classification in the second stage.
Current speed Route of tankers Route of other vessels
Yes
Interpolation of each parameter to the target area
Fitted distribution for parameters
Randomization (N trials)
No
South coast of Newfoundland (-53°W, 45.5°N) to 0.1°latitude by 0.1°longitude interval 1491 locations 5 monitoring stations to be determined 5 groups
Features for Classification Climate data 5 features hourly data from 9 climate stations varying from 20 to 25 years Oceanic data 2 features daily data from 8 observing locations from 1992 to 2012 Vessel movements and spill frequency 3 features obtained from literature reviews
Latitude Longitude Wave height (GEV) k sigma mu 45.90 51.00 1.21 0.22 0.16 44.25 53.62 0.15 0.88 1.81 44.32 57.35 0.11 0.89 1.62 42.73 50.61 0.12 0.89 1.90 42.12 56.13 0.20 0.89 1.79 45.89 49.98 -0.13 1.02 2.90 46.88 62.00 0.13 0.38 0.48 46.44 53.39 0.14 0.72 1.48 47.28 57.35 0.25 0.62 1.09
Current direction (GEV) k sigma mu Normal 2.966 8.263 -0.508 2.926 9.203 Weibull 4.952 10.939 -0.180 3.068 4.619 Weibull 3.446 10.757 0.385 1.674 2.151 0.046 2.213 4.505 Normal 2.388 6.972
47.7 47.2 46.8 45.8 47.8
Wind direction (GEV) k sigma mu -0.62 104.00 196.29 -0.57 122.62 152.11 -0.63 122.51 169.36 -0.50 100.03 175.41 -0.66 114.49 189.30 -0.71 118.34 192.90 -0.30 88.57 149.63 -0.55 99.32 183.21 -0.57 103.75 182.03
7000
Wind speed (GEV) k sigma mu -0.07 2.81 4.64 -0.14 3.63 5.09 -0.10 3.30 5.38 -0.08 3.15 5.39 -0.12 3.49 4.92 -0.13 3.53 5.61 -0.14 2.37 4.30 -0.12 3.46 5.43 -0.07 3.29 5.15
Daily data from 1988 to 2012 Fitting curve with GEV distribution
6000
5000
5000
Distribution fitting for collected data
4000 3000 2000
4000
sigma 700 700 500 300 700
0
5
10
Wave height (m)
15
0
mu 2.34 1.29 1.43 2.69 1.47
sigma 0.2 0.1 0.1 0.2 0.1
Classification by MC-TSAM
2000
960
980
1000
Pressure (mb)
1020
1040
6
Probability density
Probability density
4 3 2
0 0
7
50
100
150
200
250
300
Wind direction (degree)
0.1
Group 1 Group 2 Group 3 Group 4 Group 5
Group 1 Group 2 Group 3 Group 4 Group 5
0.1
0.05
0.01
0 0
350
950
1000
1050
1100
1150
Pressure at sea level (mb)
15
1200
0.04
0.02
0 -10
0
10
20 o
20
Wind speed (m/s)
Group 1 Group 2 Group 3 Group 4 Group 5
0.14 0.12 0.1 0.08 0.06 0.04
x 10
0.05
0.1
0.15
Group 1 Group 2 Group 3 Group 4 Group 5
2.5
2
1.5
1
Current speed (m/s)
0 0
0.2
500
1000
1500
Annual movement of tankers
-4
Group 1 Group 2 Group 3 Group 4 Group 5
Group 1 Group 2 Group 3 Group 4 Group 5
1.6 1.4
3 2 1
1.2 1 0.8 0.6 0.4 0.2
2000
4000
6000
8000
Annual movement of other vessels
10000
0 0
0
5
10
15
Current direction (degree)
20
25
-3
0.5
0 0
0 -5
30
Sea surface temperature ( C)
5
0 0
15
0.16
0.06
1250
10
4
10
0.02
Group 1 Group 2 Group 3 Group 4 Group 5
5
5
0.18
Group 1 Group 2 Group 3 Group 4 Group 5
0.08
0.015
20
Hourly data from 1990 to 2012 Fitting curve with Weibull distribution
3000
5
x 10
Pressure (Weibull) Sea surface temperature (GEV) mu sigma k sigma mu 1020.05 112.43 -0.52 6.83 8.65 1019.73 112.38 Normal 5.35 10.41 1019.26 112.88 -0.20 5.46 6.79 1020.62 113.08 Normal 6.65 10.18 1020.03 115.08 Normal 6.51 14.61 1018.69 94.13 Normal 1.80 3.05 1019.21 127.43 -0.44 6.34 11.05 1018.43 106.40 -0.06 4.56 3.80 1017.34 109.49 -0.06 5.89 4.31
1000
1000 0
54.1 55.1 56 59.3 51.4
Wave height (m)
5
0.02
Annual movements Annual movements of tankers of other vessels Spill Frequency Latitude Longitude (Normal) (Normal) (Normal) mu 7010 7010 5063 3117 7070
4
0.025
Final classification results
sigma 120 120 90 60 21
3
0.03
0
mu 1276 1276 933 590 190
Group 1 Group 2 Group 3 Group 4 Group 5
0.005
Site classification for the south coast area of Newfoundland Latitude Longitude Current speed (GEV) k sigma mu 53.2 45.2 0.009 0.016 0.048 53.2 47.2 0.030 0.017 0.057 55.2 45.2 -0.010 0.021 0.060 55.2 47.2 -0.010 0.018 0.060 57.2 45.2 -0.074 0.019 0.065 57.2 47.2 -0.053 0.017 0.066 59.2 45.2 -0.152 0.018 0.065 59.2 47.2 -0.055 0.023 0.066
2
0.035
Spill frequency
Study Area
1
0.04
TSAM
-3
1
0 0
Classification results for all trials
Modification of threshold parameters
0.2 0.1
Counts of trials belong to 1:M for each location
Randomized parameters in one trail (l)
0.3
Probability density
Surface temperature Current direction
Probability density
Unclassified data exist?
TSAM
(-60°W, 47.5°N)
Two-stage adaptive resonance theory mapping
No
Probability density
Existing methods and gaps Traditional Approaches Clustering Hierarchical methods Partitioning methods Dynamic cluster Statistical approaches Neural Network Approaches Adaptive resonance theory Fuzzy Approaches
Locations?
Pressure
Yes
0.4
x 10
6
Probability density
Feature increase and Interactions
Expected number of final group (M)
7
Group 1 Group 2 Group 3 Group 4 Group 5
0.5
Probability density
Complexity
Group of similar areas?
Wind speed
l = N?
Probability density
Uncertainty Coexisting
Historical data
Probability density
Values = ?
Objectives To develop a method which can sufficiently handle coexistence of uncertainties and complexities in large number of features
Wind direction
Frequency
The determination of the numbers and locations for monitoring spots is challenging due to various uncertain conditions such as wind, temperature, wave and current, marine traffic, etc.
Distribution of features for classified groups
Classification results for trial l
Wave height
Frequency
The monitoring of oil spills and leaks are arising more concerns in the northern regions (e.g., North Atlantic and Arctic) featured with growing oil and gas development and harsh environments.
Wind Current Temperature Pressure Vessel movements Spill frequency …
Discussion
Monte Carlo simulation based TSAM (MC-TSAM)
Introduction
Probability density
Pu Li, Bing Chen, Liang Jing, Zelin Li, and Xiao Zheng
1
2
3
Potential spill event (spill/year)
4
The classification is significantly affected by pressure, potential spill frequency, annual movement of vessels, and current direction. The wave height, temperature, and annual movement of tankers may have contributions in distinguishing some groups but not significant. The wind speed, wind direction, and current speed almost have no contribution to the classification. The classification is affected by multiple features.
Conclusion A Monte Carlo simulation based two-stage adaptive resonance theory mapping (MC-TSAM) model was developed. The model was tested by classifying a large sea/coastal area (e.g., the south coast of Newfoundland) surrounding potential oil spill sources (e.g., offshore platforms, tankers, vessels, etc.) based on the meteorological conditions (e.g., temperature, wind, wave and current, etc.) and marine traffic (e.g., movement of tankers and vessels, etc.). According to different scenarios of categories, decision makers can flexibly place the monitoring spots in some available locations. The classification result provides the least or desired number of classified areas which can sufficiently represent the situation of oil spill/leak in the target site, saving time and budget in offshore oil spill monitoring and sampling.
Acknowledgement Sincere thanks go to Natural Sciences and Engineering Research Council of Canada (NSERC), Research & Development Corporation (RDC) of Newfoundland and Labrador, and Canada Foundation for Innovation (CFI) for funding support of our research, as well as Eastern Canada Response Corporation (ECRC) for technical advices in the case study.