I thank Jason Daino for all the good times we have shared, and an insight into ...... in simulating wave propagation is well documented (e.g. Grilli 1989, Grilli et al.
A MULTI-LAYER APPROACH TO MODELING GENERATION, PROPAGATION, AND INTERACTION OF WATER WAVES
A Dissertation Presented to the Faculty of the Graduate School of Cornell University in Partial Fulfillment of the Requirements for the Degree of Doctor of Philosophy
by Patrick Joseph Lynett August 2002
c 2002 Patrick Joseph Lynett ° ALL RIGHTS RESERVED
A MULTI-LAYER APPROACH TO MODELING GENERATION, PROPAGATION, AND INTERACTION OF WATER WAVES Patrick Joseph Lynett, Ph.D. Cornell University 2002
A set of model equations is derived by piecewise integration of the primitive equations of motion through an arbitrary number, N , of layers. Within each layer, an independent velocity profile is determined. With N separate velocity profiles, matched at the arbitrary interface of the layers, the resulting set of equations will have 2N -1 free parameters, allowing for an optimization with known analytical properties of water waves. The one- and two-layer models are examined in-depth in this thesis. The one-layer model is equivalent to the well-studied ”extended” Boussinesq model, which is accurate up to kh=3. The optimized two-layer model shows good linear behavior up to a kh of 8, while second-order nonlinear behavior is well-captured to kh values near 6. A high-order, predictor-corrector, finite-difference numerical algorithm is developed for the one- and two-layer models. Included in this numerical code is a parameterization of wave breaking and bottom friction, as well as a moving boundary scheme to simulate wave runup and rundown. These aspects of the code are tested against analytic solutions and experiments, exhibiting satisfactory to excellent agreement. Using the one-layer version of the numerical model, wave generation by subaerial and submarine landslides and slumps is investigated. Based on comparisons
with nonlinear potential flow theory, and deep water accuracy limitation of the one-layer model is found. Two cases studies are presented, examining the devastating landslide-tsunami at Papua New Guinea in 1998 and the potential tsunami due to sources off the northern coast of Puerto Rico. The importance of frequency dispersion (deep water) effects and physical slide characteristics, such as slide duration and acceleration, on the generated tsunami height and eventual shoreline runup are discussed. Using experimental data for such problems as wave evolution over a submerged bar and generation by a submerged landslide, it is shown that the two-layer model yields highly accurate results for problems beyond the applicability range of the one-layer model. Nonlinear deep water wave groups are simulated, indicating the limitations of the two-layer model. Finally, a two horizontal dimension (2HD) experiment is numerically recreated. This simulation represents the first 2HD simulation using the ”high-order” class of depth-integrated equations, and shows again the accuracy of the two-layer model in the deep water regime.
Biographical Sketch The author was born in New York, New York on March 19, 1975. He received a Bachelor of Science degree in Civil Engineering from Cornell University in 1997, followed by a Master of Engineering degree the next year, specializing in Hydraulics and Hydrology in the School of Civil and Environmental Engineering. Since the Fall of 1998, he has pursued a Doctor of Philosophy degree, focusing on the study of large scale coastal dynamics.
iii
To my family
iv
Acknowledgements I would like to thank many for their support and encouragement during my time as a graduate student. Professor Philip L.-F. Liu, the Chairman of my committee, has been a constant source of new ideas. I am most grateful for his always professional criticism of my research, which I am certain has greatly elevated the quality of this thesis and has taught me, to a large degree, how to think critically of my own ideas. I would also like to thank my other committee members, Professor William Philpot of the School of Civil and Environmental Engineering and Professor Ken Torrance of the School of Mechanical and Aerospace Engineering for their interesting advice and suggestions in the fields of remote sensing and computational fluid dynamics. I happily thank my fellow graduate students Seung-Buhm Woo, Tom Hsu, Shih-Chun Hsiao, and Tso-Ren Wu for the many chalkboard conversations we have shared. I will miss the company of all the friendly fluids people; Kuang-An Chang, Micheal Cosh, Ken Eng, Yin-Yu Chen, Khaled Al-Banaa, Yin-Guo Cheng, David Frostclapp, Gustavo Zarruk, Yeonkil Jung, Francisco Rueda-Valdivia, and Evan Variano have all made my time in Hollister Hall enjoyable. For taking care of me while I was in Puerto Rico, I thank Professor Aurelio Mercado. His questions and comments have helped my numerical model become a more useful tool. I thank Dr. Monroe Weber-Shirk for his guidance and friendship,
v
and for exemplifying what it means to be an effective teacher. Also, thanks go to Professor Costas Synolakis for his interesting ideas regarding landslide modeling, and the many laughs he has provided me. The research presented in this thesis required the assistance of a number of people. The potential flow calculations of landslide tsunamis were performed by Yin-Yu Chen of Cornell University. The Papua New Guinea bathymetry data was provided by Dr. Jose Borrero at the University of Southern California. The Puerto Rico bathymetry files were provided by Dr. Aurelio Mercado of the University of Puerto Rico at Mayaguez. The regular wave evolution over a submerged bar data sets were provided by Dr. Maarten Dingemans of Delft Hydraulics. The deep water wave group data was provided by Dr. Carl Stansberg at MARINTEK, Norway. The two-horizontal dimension wave propagation over a shoal data was provided by Dr. Michael Briggs of the Coastal Engineering Research Center. Their generosity is greatly appreciated. Finally, I would like to thank my friends and family for their endless love and support. I thank Jason Daino for all the good times we have shared, and an insight into a mind that is slightly-to-moderately unbalanced. Bob Tamashunas, Stu Bagatell, Todd Zion, Saro Cutri, and John Myers were always there to make me laugh. A special thanks goes to my parents, my grandparents, Rick and Lois, Liz and Bob, and Chris and Laura for being what all families should be. With true love I thank my wife, who has made my years at Cornell great ones, and me a better man. Without her this thesis would have been unimaginable.
vi
Table of Contents 1 Introduction 1.1 Coastal Modeling Background . . . . . . . . . . . . . . . . . . . . . 1.2 Depth-Integrated Equations . . . . . . . . . . . . . . . . . . . . . . 1.3 Scope of Thesis . . . . . . . . . . . . . . . . . . . . . . . . . . . . . 2 General N -Layer, Depth-Integrated Model Derivation 2.1 Introduction . . . . . . . . . . . . . . . . . . . . . . . . . 2.2 Governing Equations & Boundary Conditions . . . . . . 2.3 Approximate 2HD Governing Equations . . . . . . . . . 2.4 Heuristic Analysis of Truncation Error . . . . . . . . . .
1 1 2 4
. . . .
6 6 7 10 14
. . . . . . . . . . .
18 18 19 20 22 28 40 43 44 47 50 54
4 Numerical Model for One- & Two-Layer Systems: COULWAVE 4.1 Numerical Scheme . . . . . . . . . . . . . . . . . . . . . . . . . . . 4.1.1 Numerical Expressions for One-Layer System . . . . . . . . . 4.1.2 Numerical Expressions for Two-Layer System . . . . . . . . 4.2 Energy Dissipation Mechanisms . . . . . . . . . . . . . . . . . . . . 4.2.1 Bottom Friction . . . . . . . . . . . . . . . . . . . . . . . . . 4.2.2 Wave Breaking Model . . . . . . . . . . . . . . . . . . . . . 4.3 Simulating Wave Runup & Rundown . . . . . . . . . . . . . . . . . 4.3.1 Previous Work . . . . . . . . . . . . . . . . . . . . . . . . . 4.3.2 Moving Boundary Algorithm . . . . . . . . . . . . . . . . . .
59 59 60 63 66 66 67 74 74 77
. . . .
3 Analysis & Optimization of Multi-Layer Model 3.1 Introduction . . . . . . . . . . . . . . . . . . . . . . . . . . 3.2 One-Layer Equation Model . . . . . . . . . . . . . . . . . . 3.3 Two-Layer Equation Model . . . . . . . . . . . . . . . . . 3.3.1 Analysis of Model Equations . . . . . . . . . . . . . 3.3.2 Choice of Arbitrary Levels: Linear Optimization . . 3.3.3 Choice of Arbitrary Levels: Nonlinear Optimization 3.4 Three-Layer Equation Model . . . . . . . . . . . . . . . . . 3.4.1 Choice of Arbitrary Levels: Linear Optimization . . 3.5 Four-Layer Equation Model . . . . . . . . . . . . . . . . . 3.5.1 Choice of Arbitrary Levels: Linear Optimization . . 3.6 Summary . . . . . . . . . . . . . . . . . . . . . . . . . . .
vii
. . . . . . . . . . . . . . .
. . . . . . . . . . . . . . .
. . . . . . . . . . . . . . .
. . . . . . . . . . . . . . .
4.3.3 4.3.4
Validation in One Horizontal Dimension . . . . . . . . . . . Validation in Two Horizontal Dimensions . . . . . . . . . . .
86 90
5 One-Layer Modeling Topics 5.1 Landslide-Generated Waves . . . . . . . . . . . . . . . . . . . . . 5.1.1 Accuracy Limitation of Numerical Model . . . . . . . . . . 5.1.2 Case Study: Papua New Guinea Tsunami of 1998 . . . . . 5.1.3 Case Study: Landslide Tsunami Hazard near Puerto Rico
102 . 102 . 104 . 123 . 139
6 Two-Layer Modeling Topics 6.1 Highly Nonlinear Solitary Waves . . . . . . 6.2 Wave Propagation over a Submerged Bar . 6.3 Wave Generation by Submarine Landslide 6.4 Deep Water Wave Group Propagation . . 6.5 2HD Wave Evolution over a Shoal . . . . .
151 . 151 . 155 . 159 . 160 . 172
. . . . .
. . . . .
. . . . .
. . . . .
. . . . .
. . . . .
. . . . .
. . . . .
. . . . .
. . . . .
. . . . .
. . . . .
. . . . .
7 Conclusions
178
8 Future Work
182
A Coefficients of Three-Layer Dispersion Relation
185
B Coefficients of Four-Layer Dispersion Relation
187
Bibliography
195
viii
List of Tables 3.1 3.2 3.3 3.4
α β α α
values values values values
from from from from
linear optimization for two-layer model. . . nonlinear optimization for two-layer model. linear optimization for three-layer model. . linear optimization for four-layer model. . .
4.1 4.2
Relation between C and f for various roughnesses. . . . . . . . . . 67 Experimental wave characteristics for the Hansen and Svendsen tests. 71
5.1
Characteristics of the landslide simulations performed to determine the importance of nonlinearity. . . . . . . . . . . . . . . . . . . . . 119
ix
. . . .
. . . .
. . . .
. . . .
. . . .
30 41 45 51
List of Figures 2.1 2.2
3.1
3.2
3.3
3.4
N -Layer problem setup. . . . . . . . . . . . . . . . . . . . . . . . . Comparison of truncation errors for three different models: (– – ) error O(µ4o ) Boussinesq equations, (– ·) error O(µ6o ) High-Order Boussinesq equations, (—) 0.38µ4o minimized error for two-layer equations, (–?–) 0.17µ4o minimized error for three-layer equations, (–o–) 0.09µ4o minimized error for four-layer equations. . . . . . . . . Properties of two-layer model with α1 = −0.225, α2 = −0.420, and α3 = −0.713 (∆Linear =0.00008). Comparison of wave speed and group velocity of the two-layer model (dashed line) with the exact linear relation (solid line); the dotted line is the [4,4] Pade, and the dashed-dotted line is the [6,6] Pade. The linear shoaling factor is shown in c), where the [6,6] Pade is not shown. . . . . . . . . . . . Properties of two-layer model with α1 = −0.204, α2 = −0.383, and α3 = −0.685 (∆Linear =0.002). Comparison of wave speed and group velocity of the two-layer model (dashed line) with the exact linear relation (solid line); the dotted line is the [4,4] Pade, and the dashed-dotted line is the [6,6] Pade. The linear shoaling factor is shown in c), where the [6,6] Pade is not shown. . . . . . . . . . . . Properties of two-layer model with α1 = −0.175, α2 = −0.331, and α3 = −0.646 (∆Linear =0.009). Comparison of wave speed and group velocity of the two-layer model (dashed line) with the exact linear relation (solid line); the dotted line is the [4,4] Pade, and the dashed-dotted line is the [6,6] Pade. The linear shoaling factor is shown in c), where the [6,6] Pade is not shown. . . . . . . . . . . . Properties of two-layer model with α1 = −0.155, α2 = −0.294, and α3 = −0.620 (∆Linear =0.020). Comparison of wave speed and group velocity of the two-layer model (dashed line) with the exact linear relation (solid line); the dotted line is the [4,4] Pade, and the dashed-dotted line is the [6,6] Pade. The linear shoaling factor is shown in c), where the [6,6] Pade is not shown. . . . . . . . . . . .
x
8
16
31
32
33
34
3.5
3.6
3.7
3.8
3.9
3.10
3.11
3.12
3.13
Vertical profile of horizontal velocity (top row) and vertical velocity (bottom row) under the crest of a sine wave for three different kh values, as given by linear theory (solid line), the high-order model of Gobbi et al. (2000) (dotted line), and the 2-layer model presented in this paper employing the ∆Linear =0.00008 coefficients (dashed line). . . . . . . . . . . . . . . . . . . . . . . . . . . . . . . . . . . Vertical profile of horizontal velocity (top row) and vertical velocity (bottom row) under the crest of a sine wave for three different kh values, as given by linear theory (solid line), the high-order model of Gobbi et al. (2000) (dotted line), and the 2-layer model presented in this paper employing the ∆Linear =0.002 coefficients (dashed line). Vertical profile of horizontal velocity (top row) and vertical velocity (bottom row) under the crest of a sine wave for three different kh values, as given by linear theory (solid line), the high-order model of Gobbi et al. (2000) (dotted line), and the 2-layer model presented in this paper employing the ∆Linear =0.009 coefficients (dashed line). Vertical profile of horizontal velocity (top row) and vertical velocity (bottom row) under the crest of a sine wave for three different kh values, as given by linear theory (solid line), the high-order model of Gobbi et al. (2000) (dotted line), and the 2-layer model presented in this paper employing the ∆Linear =0.02 coefficients (dashed line). Second-order free surface correction, ζ (1) , relative to the Stokes solution, with no nonlinear optimization (β1 = β2 = β3 =0) shown by the dash-dotted line, the ∆N onlinear =0.013 results by the dotted line, and the ∆N onlinear =0.036 results by the dashed line. . . . . . . Sub- and superharmonic transfer amplitudes for bichromatic wave interactions, ζ ∓ , relative to the Stokes solution, where subharmonics are shown in the lower right, and superharmonics in the upper left. Shown in a) are the results with no nonlinear optimization (β1 = β2 = β3 =0), in b) the ∆N onlinear =0.013 results, and the ∆N onlinear =0.036 results in c). . . . . . . . . . . . . . . . . . . . . . Comparison of wave speed and group velocity of the three-layer model with the exact linear relation; the dashed-dotted line is the [6,6] Pade, the dotted line is the [8,8] Pade, the dashed line is the three-layer results with ∆Linear =0.0003, and the slide line is the three-layer results with ∆Linear =0.0005. . . . . . . . . . . . . . . . Vertical profiles of velocity for three-layer model (dashed line), compared with linear theory (solid line). The top row shows horizontal velocity and the bottom vertical velocity. The three-layer profiles use the α values from the ∆Linear =0.0003 optimization. . . . . . . . Figure setup same as in Fig 3.12, except here showing high kh comparisons. . . . . . . . . . . . . . . . . . . . . . . . . . . . . . .
xi
36
37
38
39
41
43
46
48 49
3.14 Comparison of wave speed and group velocity of the four-layer model with the exact linear relation; the dashed-dotted line is the [6,6] Pade, the dotted line is the [8,8] Pade, the dashed line is the four-layer results with ∆Linear =0.0003. . . . . . . . . . . . . . . . . 3.15 Vertical profiles of velocity for four-layer model (dashed line), compared with linear theory (solid line). The top row shows horizontal velocity and the bottom vertical velocity. . . . . . . . . . . . . . . 3.16 Figure setup same as in Fig 3.15, except here showing high kh comparisons. . . . . . . . . . . . . . . . . . . . . . . . . . . . . . . 3.17 Comparison of wave speed and group velocity for numerous different models. Curve (1) is the [2,2] Pade properties used by some Boussinesq models, (2) is the [4,4] Pade of the high-order Boussinesq model, (3) is the two-layer model, (4) is the three-layer model, and (5) is the four-layer model. . . . . . . . . . . . . . . . . . . . . 4.1 4.2 4.3 4.4 4.5 4.6 4.7
4.8
4.9
Experimental (dots) and numerical (line) wave height and mean free surface for Hansen and Svendsen case 031041. . . . . . . . . . Experimental (dots) and numerical (line) wave height and mean free surface for Hansen and Svendsen case 041041. . . . . . . . . . Experimental (dots) and numerical (line) wave height and mean free surface for Hansen and Svendsen case 051041. . . . . . . . . . Experimental (dots) and numerical (line) wave height and mean free surface for Hansen and Svendsen case 061071. . . . . . . . . . Experimental (dots) and numerical (line) wave height and mean free surface for Hansen and Svendsen case 10112. . . . . . . . . . . Runup and rundown of a solitary wave, where extrapolated nodes are shown by the dots. . . . . . . . . . . . . . . . . . . . . . . . . . Fractional change in mass for breaking and non-breaking solitary waves interacting with 3 different planar slopes. Simulations where breaking occurs are indicated by the x’s, non-breaking results by the o’s. . . . . . . . . . . . . . . . . . . . . . . . . . . . . . . . . . Sine wave runup on a planar beach, a) Numerical free surface at various times, analytic free surface is shown by the dashed line (−−), and is only compared for the maximum and minimum shoreline movement profiles. b) Comparison between analytical (−−) and numerical (−) shoreline movement. . . . . . . . . . . . . . . . . . . Nondimensional maximum runup of solitary waves on a 1:19.85 beach versus nondimensional wave height. The points represent experimental data taken from Synolakis (1986), the dotted line is the numerical result with no bottom friction, the solid line is the numerical result with a bottom friction coefficient, f , of 10−3 , and the dashed line with f = 10−2 . . . . . . . . . . . . . . . . . . . . .
xii
53
55 56
58 71 72 73 74 75 79
85
87
89
4.10 Breaking solitary wave runup and rundown on a planar beach at t(g/h)1/2 = a) 15, b) 20, c) 25, d) 45. The solid line represents the numerical results and the points experimental data. In c) the dashed line represents numerical results by Lin et al. (1999) (closest to experiment and numerical results presented in this paper), the dotted line represents results by Zelt (1991), and the dashed-dotted line results by Titov and Synolakis (1995). . . . . . . . . . . . . . . 91 4.11 Initial free surface and depth profile for parabolic basin test. . . . . 92 4.12 Centerline free surface profiles for numerical (−−) and analytical (· · ·) bowl oscillation solutions at t= a) 5T , b) 5 16 T , c) 5 31 T , d) 5 21 T , where T is the oscillation period. . . . . . . . . . . . . . . . . 93 4.13 Conical island setup. The gage locations are shown by the dots, and the wave approaches the island from the left. . . . . . . . . . . 95 4.14 Experimental (- -) and numerical (–) time series for solitary wave interaction with a conical island. Figures a) - d) are for case A, e) - h) are for case B, and i) - l) are for case C. The gage number is shown in the upper left. . . . . . . . . . . . . . . . . . . . . . . . . 96 4.15 Maximum horizontal runup, scaled by the initial shoreline radius, for case A a), case B b), and case C c). Experimental values are shown by the stars and the numerical results by the solid line. . . . 97 4.16 The transverse profile of a solitary wave in a trapezoidal channel. The continuous line shows the numerical result; the crosses indicate the measured profile digitized from Peregrine’s (1969) paper. . . . . 98 4.17 Evolution of a solitary wave in a trapezoidal channel (half channel shown), at t(g/h)1/2 = a) 7.5 b) 35 c) 65 d) 93. Seafloor elevation contours are shown at increments of 0.5 ho , by the solid lines. The line of x − ct = 0 is shown by the dashed line. . . . . . . . . . . . . 100 4.18 Time series along the centerline of the channel (y = 0); location of each time series is note along the right border of the figure. Characteristics are shown by the dashed-dotted lines. . . . . . . . . 101 5.1
Shown in subplots a) and b), a comparison between Hammack’s (1973) experimental data (dots) for an impulsive seafloor upthrust of δ=0.1, FNL-EXT numerical simulation (solid line), and linear theory (dashed line); a) is a time series at x/h=0 and b) is at x/h=20, where x is the distance from the edge of the impulsive movement. Subplots c) and d) show FNL-EXT (solid line) and LEXT (dashed line) numerical results for Hammack’s setup, except with δ=0.6. . . . . . . . . . . . . . . . . . . . . . . . . . . . . . . . 110
xiii
5.2
Graphical definition of the characteristic side length of a slide mass. The slide mass at time=to is shown by the solid line, while the profile at some time=t > to is shown by the dashed line. The negative of the change in water depth (or the approximate free surface response in the non-dispersive equation model) during the increment t − to is shown by the thick line plotted on z=0.1. . . . . 5.3 Setup for submarine landslide comparisons. . . . . . . . . . . . . . 5.4 Free surface snapshots for BIEM (solid line) and depth-integrated (dashed line) results at t(g/do )1/2 = a) 10.6, b) 21, c) 31.6, and d) 41. The lower subplot shows the location of the slide mass in each of the above four snapshots. . . . . . . . . . . . . . . . . . . . . . . 5.5 Time series above the initial centerpoint of the slide (top row) and vertical movement of the shoreline (bottom row) for a 20◦ slope and a slide mass with a maximum height ∆h=0.1. BIEM results are shown by the solid line, depth-integrated results by the dashed line. Subplots a & b are for do /b=0.4, c & d for do /b=0.6, and e & f for do /b=1.0. . . . . . . . . . . . . . . . . . . . . . . . . . . . . . 5.6 Maximum depression above the initial centerpoint of the slide mass and maximum rundown for four different trial sets. FNL-EXT results indicated by the solid line, WNL-EXT by the dashed line, and L-EXT by the dotted line. . . . . . . . . . . . . . . . . . . . . . . 5.7 Maximum depression above the initial centerpoint of the slide mass a) and maximum rundown d) for a set of numerical simulations on a 15◦ slope. Shown in b) and e) are the maximum depression and maximum rundown scaled by the corresponding values from the WNL-EXT model. Time series comparisons for Ls /hco = 3.5 showing the free surface elevation above the centerpoint c) and vertical shoreline movement f) are given on the right. WNL-EXT results indicated by the solid line, WNL-DA by the dashed line, and NL-SW by the dotted line. . . . . . . . . . . . . . . . . . . . 5.8 The short-fat initial condition (SFIC) for the Papua New Guinea event. The island is located on the bottom of the figure; Sissano Lagoon is shown. (taken from Borrero, 2001) . . . . . . . . . . . . 5.9 The long-narrow initial condition (LNIC) for the Papua New Guinea event. The island is located on the bottom of the figure; Sissano Lagoon is shown. (taken from Borrero, 2001) . . . . . . . . . . . . 5.10 Dispersion effects with the long-narrow initial condition. The top plots (in the top row) show the instantaneous free surface elevation predicted by the NL-SW and FNL-EXT models. The middle plot shows the difference in maximum free surface elevation between the models. Positive values indicate that the shallow water model predicts a higher free surface at that location. The lower plot compares the predicted inland water elevations with field data. . . . . . . . .
xiv
112 114
116
117
120
124
126
127
130
5.11 Dispersion effects with the short-fat initial condition. The top plots (in the top row) show the instantaneous free surface elevation predicted by the NL-SW and FNL-EXT models. The middle plot shows the difference in maximum free surface elevation between the models. Positive values indicate that the shallow water model predicts a higher free surface at that location. The lower plot compares the predicted inland water elevations with field data. . . . . . 132 5.12 Locations of the PNG time series comparisons. Depth contours are every 100 m. . . . . . . . . . . . . . . . . . . . . . . . . . . . . . . 133 5.13 PNG time series comparisons of the free surface for the three locations shown in Figure 5.12, for the SFIC. FNL-EXT results are given by the solid line, NL-SW by the dashed line. . . . . . . . . . 134 5.14 The evolution in time of three different initial conditions. In the first column are the results from the short-fat initial condition, the middle column the long-narrow initial condition, and the last column the sine-wave initial condition. The first row is for the initial time, the second row for t=1 min, the third for t=3 min, and the fourth for t=7 min. . . . . . . . . . . . . . . . . . . . . . . 136 5.15 Comparisons from the three different initial conditions. The top row shows the maximum ocean surface predicted by the different initial conditions, and the bottom plot comparisons the inland free surface elevations. . . . . . . . . . . . . . . . . . . . . . . . . . . . 138 5.16 Submarine slump modeled using a sine wave transformation, where the solid line is the initial water depth, the dashed line at t = tc /12, the dashed-dotted line at t = tc /3, and the dotted line at t = tc . . . 141 5.17 1D simulation of a submarine slump using FNL-EXT. Numerical free surface results from L-EXT are also shown by the dotted line for the last time. . . . . . . . . . . . . . . . . . . . . . . . . . . . . 143 5.18 Effect of slump duration, comparing free surface response due to slumps of the same geometry, but different periods, for tc =20 min (—), tc =10 min (– –), tc =5 min(– ·). Profiles are taken 5 minutes after the start of the movement. . . . . . . . . . . . . . . . . . . . 144 5.19 2D free surface response to a submarine slump. . . . . . . . . . . . 145 5.20 Comparison between 1D (—) and 2D centerline (– –) spatial profiles.146 5.21 Dependence of the maximum depression generated at the top of the failure slope on the aspect ratio of the slump region. The dashed line represents the maximum depression predicted by a 1D simulation.147 5.22 Plan-view snapshots of the waves generated by a submarine slump. The subplot in the upper left shows the water depth profile. The island of Puerto Rico is located on the bottom of each subplot. . . 149 5.23 The maximum free surface elevation recorded near the coast of Puerto Rico. . . . . . . . . . . . . . . . . . . . . . . . . . . . . . . 150
xv
6.1
6.2
6.3
6.4 6.5
6.6
6.7
6.8
Shape of solitary wave with amplitude ζ/h=0.65. The exact solution is given by the dashed line, the two-layer model by the solid line, Gobbi et al. (2000) high-order model by the dots, and the one-layer model by the dash-dotted line. . . . . . . . . . . . . . . . 153 Vertical profile of horizontal velocity under the crest of a solitary wave with amplitude ζ/h=0.65. The exact solution is given by the dashed line, the two-layer model by the solid line, Gobbi et al. (2000) high-order model by the dots, and the one-layer model by the dash-dotted line. . . . . . . . . . . . . . . . . . . . . . . . . . . 154 Comparison between numerical (solid lines) and experimental (dots) free surface displacements for Case A of Dingemans (1994), where the experimental setup and gauge locations are shown in the top subplot. The column on the left shows the numerical results from the one-layer model, the right column shows the two-layer results. Time series locations are indicated in the upper right of each subplot, corresponding to the gauge locations shown in the top subplot. 156 Comparison for Case C of Dingemans (1994), where the figure notation is as in Fig. 6.3. . . . . . . . . . . . . . . . . . . . . . . . . . 158 Numerical simulation of a submarine landslide. Top plot shows the location of the slide mass at the four times corresponding to the free surface snapshots in the four lower plots. Free surface snapshots for potential flow theory (dots), one-layer model (dashed line), and two-layer model (solid line) are given. . . . . . . . . . . . . . . . . 161 Deep water wave group comparisons 9.3 m from wavemaker, where the solid lines are the linear theory, and the dots are the MARINTEK experimental data. Linear theory in the top plot is for wave periods of 1.9 and 2.1 seconds, while the lower plot is for wave periods of 1.904 and 2.1 seconds. . . . . . . . . . . . . . . . . . . . 164 Deep water wave group comparisons 9.3 m from wavemaker, where the solid lines are the numerical results, and the dashed line in the top subplot and the stars in the lower two subplots are the MARINTEK data. The top plot shows free surface, the middle plot shows spectral amplitudes for the primary components, and the bottom plot gives amplitudes for the higher frequency components. The ∗’s represent the experimental spectrum in the lower two plots. The thin dashed vertical lines in the bottom two plots indicate expected locations of spectral peaks, where the ω combinations are shown to the right of the lines. . . . . . . . . . . . . . . . . . . . . 166 Deep water wave group comparisons 40 m from wavemaker, where the solid lines are the numerical results, and the dashed line in the top subplot and the stars in the lower two subplots are the MARINTEK experimental data. Figure setup is the same as with Fig. 6.7. . . . . . . . . . . . . . . . . . . . . . . . . . . . . . . . . . 167
xvi
6.9
6.10
6.11
6.12
6.13
6.14
6.15
Deep water wave group comparisons 80 m from wavemaker, where the solid lines are the numerical results, and the dashed line in the top subplot and the stars in the lower two subplots are the MARINTEK experimental data. Figure setup is the same as with Fig. 6.7. . . . . . . . . . . . . . . . . . . . . . . . . . . . . . . . . . Deep water wave group comparisons 120 m from wavemaker, where the solid lines are the numerical results, and the dashed line in the top subplot and the stars in the lower two subplots are the MARINTEK experimental data. Figure setup is the same as with Fig. 6.7. . . . . . . . . . . . . . . . . . . . . . . . . . . . . . . . . . Deep water wave group comparisons 160 m from wavemaker, where the solid lines are the numerical results, and the dashed line in the top subplot and the stars in the lower two subplots are the MARINTEK experimental data. Figure setup is the same as with Fig. 6.7. . . . . . . . . . . . . . . . . . . . . . . . . . . . . . . . . . Deep water wave group comparisons 200 m from wavemaker, where the solid lines are the numerical results, and the dashed line in the top subplot and the stars in the lower two subplots are the MARINTEK experimental data. Figure setup is the same as with Fig. 6.7. . . . . . . . . . . . . . . . . . . . . . . . . . . . . . . . . . Numerical snapshot from a two-layer, 2HD shoal simulation, where the location of the shoal is denoted by the dashed contours. The snapshot is taken 32 s into the simulation, or roughly 24.6 wave periods. . . . . . . . . . . . . . . . . . . . . . . . . . . . . . . . . . Difference between one- and two-layer numerical simulations at time=32 s. The location of the shoal is denoted by the dashed contours. . . . . . . . . . . . . . . . . . . . . . . . . . . . . . . . . Characteristics of the elliptic shoal case, along the channel centerline (y=0). The centerline depth profile is given in a). Shown in b) is the significant wave height of the Vincent and Briggs (1989) experiments (dotted-dashed line, where dots represent measurement locations), one-layer model results (dashed line), and twolayer model (solid line). In c) and d) are the first and second harmonic amplitudes, respectively, for the one- and two-layer models.
xvii
168
169
170
171
173
175
176
Chapter 1 Introduction 1.1
Coastal Modeling Background
A water wave model that can accurately simulate various aspects of wave transformation in coastal regions is an extremely valuable engineering tool. Such a tool would require the ability to model refraction, diffraction around coastal structures such as breakwaters, nonlinear effects such as shoaling, interaction with both impermeable and porous beach protection structures, as well as wave breaking and runup. All of these processes need be correct not only for the long waves that typically dominant coastal wave fields, but for intermediate and moderately short wave components as well, which are generated in coastal regions through nonlinearity. The earliest large-scale attempts to model coastal regions include methods such as wave ray theory. These methods could typically handle all wavelengths, but were limited to small amplitude waves (linear theory), slowly varying bathymetry, and weak diffraction effects. In time, enhancements were made to these models so that wave breaking could be approximated. However, due to the simplicity of the underlying model, these nonlinear, complex wave transformations were crudely 1
2 captured. The next major group of wave propagation equations are the depth-integrated equation models. These models make some approximation of the vertical distribution of the flow field, allowing for the reduction of a three dimensional problem to a two dimensional one. Depth-integrated models are derived from a long wave expansion/perturbation, and therefore are not valid at all wavelengths. The simplest depth-integrated model, the Nonlinear Shallow Water Wave equations, is accurate for only the longest of waves, such as tides or tsunamis, and cannot be applied reliably for wind wave evolution in coastal regions. The Boussinesq and Boussinesq-type equations, the focus of this thesis, have demonstrated a great use in coastal regions. These models inherently include wave processes such as shoaling, diffraction, refraction, wave-wave and wave-current interactions, and nonlinear transformation, although great care must be taken to understand the deep water accuracy limitations. Only the complete equations, such as the Navier-Stokes equations, include all of the stated transformation processes for waves of any length. The computational requirements of these equations are hindering; a large scale coastal simulation utilizing the complete equations is probably a number of decades away. Thus for practical engineering purposes, attention is currently focused on the depthintegrated models.
1.2
Depth-Integrated Equations
The past decade saw the advent and wide spread applications of Boussinesq-type equation models for studying water wave propagation in one and two horizon-
3 tal dimensions. This depth-integrated modeling approach employs a polynomial approximation of the vertical profile of the velocity field, thereby reducing the dimensions of a three dimensional problem by one. The conventional Boussinesq equations (Peregrine, 1967), which make use of a quadratic polynomial approximation for the vertical flow distribution, have two major constraints: (1) The depth-averaged model poorly describes the frequency dispersion of wave propagation in intermediate depths, and (2) the weakly nonlinear assumption limits the largest wave height that can accurately be modeled. These constraints are consistent with the fundamental assumption of the Boussinesq equations, which states that leading order dispersion and nonlinear effects are of the same order and are weak, i.e., O(µ2o ) = O(εo ) ¿ 1, where µo = wavenumber times depth (kh) and εo = amplitude over depth (a/h). The dispersive properties of the conventional Boussinesq equations have been improved by modifying the dispersive terms (Madsen & Sorensen, 1992) or using a reference velocity at a specified depth (Nwogu, 1993). These techniques yield a set of equations whose linear dispersion relation can be adjusted such that the resulting intermediate-depth dispersion characteristics are close to those of linear wave theory. Liu (1994) and Wei et al. (1995) extended Nwogu’s approach to highly nonlinear waves, developing models that not only can be applied to intermediate water depth but also are capable of simulating wave propagation with strong nonlinear interaction, i.e. εo = O(1). In general, these model equations contain accurate linear dispersion properties to kh ≈ 3 (e.g. Nwogu, 1993). In intermediate depths, nonlinear properties tend to exhibit larger relative errors than linear properties (Madsen & Schaffer, 1998), although additional enhancements can indeed create accurate nonlinear characteristics to near the linear accuracy limit, kh ≈ 3 (Kennedy et al., 2001).
4 Further enhancing the deep water accuracy of the depth-integrated approach is the so-called high-order Boussinesq-type equations. While the model equations described above use a quadratic polynomial approximation for the vertical flow distribution, these high-order models use fourth, and higher, order polynomial approximations. Gobbi et al. (2000), using a fourth-order polynomial, developed a model with excellent linear dispersive properties up to kh ≈ 6. Nonlinear behavior was faithfully captured to kh ≈ 3. With the drastic improvement in accuracy over previous model equations comes a significant computational increase as well. The fourth-order polynomial employed results in fifth-order spatial derivatives in an extremely complex equation system, requiring an equally complex numerical scheme. Moreover, difficulties exist in obtaining physically-meaningful boundary conditions for these high derivative terms. Madsen & Schaffer (1998) and Agnon et al. (1999) derived model equations with even higher order polynomial approximations. The highest order of spatial differentiation in these model equations increases linearly with the order of polynomial approximation. Additionally, the complexity increases again for a two-horizontal dimension (2HD) problem, for which no highorder modeling attempts have yet been made. The reader is directed to Madsen & Schaffer (1998), a thorough analysis of numerous different depth-integrated model equations, for additional information.
1.3
Scope of Thesis
The foundation of this thesis is a new approach to depth-integrated models: the multi-layer derivation presented in Chapter 2. The multi-layer approach offers high-order, deep water accuracy, as described in Chapter 3, without the high-
5 order spatial derivatives occupying all other models of similar type (i.e Gobbi et al., 2000). The great advantage of eliminating the high-order spatial derivatives is a relatively simple numerical scheme, given in Chapter 4. With the ability to accurately simulate wave breaking and wave runup, the numerical model is meant to be a practical engineering tool. The model is applied to a wide spectrum of problems, covered in Chapters 5 and 6, demonstrating its ability to correctly represent wave transformation over large scales in intermediate and shallow water.
Chapter 2 General N -Layer, Depth-Integrated Model Derivation 2.1
Introduction
In this chapter, a new approach to high-order, depth-integrated models is taken. Instead of employing a high-order polynomial approximation for the vertical flow field, multiple quadratic polynomials are used, matched at user-defined interfaces that divide the water column into layers. This approach leads to an accurate model without the high-order spatial derivatives associated with high-order polynomial approximations.
6
7
2.2
Governing Equations & Boundary Conditions
The goal of this derivation is to formulate a set of equations by integrating the primitive equations of motion. The integration will be performed piecewisely. As shown in Figure 2.1, ζ 0 (x0 , y 0 , t0 ) denotes the free surface displacement of a wave train propagating in the water depth h0 (x0 , y 0 , t0 ). The boundary between layers are given as ηn0 (x0 , y 0 , t0 ). The system will be divided into N layers, where the 0 upper and lower boundaries are given by ηo0 = ζ 0 and ηN = −h0 , respectively. All
of the other boundaries will be constructed as ηn0 = αn h0 + βn ζ 0 , where αn and βn are arbitrary and user defined. Note that both h0 and ζ 0 are functions of time, and therefore so is ηn0 . Each of the N layers has a characteristic thickness, dn , as defined by Figure 2.1. Utilizing the layer thicknesses dn as the vertical length scales in the corresponding layers, ho as the characteristic water depth, the characteristic length √ of the wave `o =1/k as the horizontal length scale, `o / gho as the time scale, and the characteristic wave amplitude ao as the scale of wave motion, we can define the following dimensionless variables: 0
0
q
0
(x, y) = (x , y )/`o , zn = z /dn , t =
gho t0 /`o , pn = p0n /ρgao
h = h0 /ho , ζ = ζ 0 /ao , ηn = ηn0 /bn µ
(Un , Vn ) =
(Un0 ,
Vn0 )/
q
εo gho , Wn =
·
Wn0 /
¸
q
εo µo gho
in which the subscript n indicates the layer index, bo = ao , bn =
n X
(2.1) dm for n = 1
m=1
to N , (Un , Vn ) represent the horizontal velocity components in the different layers, Wn the vertical velocity component in the layers, and pn the pressures. Note that the subscript on z indicates that the vertical coordinate is scaled differently in each layer. Dimensionless parameters have been introduced in (2.1), which are εo = ao /ho , µo = ho /`o
(2.2)
8
Figure 2.1: N -Layer problem setup.
9 It is reiterated that `o = 1/k, and thus µo =kho . Assuming that the viscous effects are insignificant, the wave motion can be described by the continuity equation and the Euler’s equations, i.e.,
Ã
µ2n
dn ∂Wn ∇ · Un + =0 ho ∂zn
(2.3)
∂U n ∂U n + εo U n · ∇U n + εn Wn = −∇pn ∂t ∂zn
(2.4)
!
Ã
∂Wn ∂Wn ∂pn 1 + εo U n · ∇Wn + εo µ2o Wn =− + ∂t ∂zn ∂zn εn
!
(2.5)
where µn = dn ho /lo2 , εn = ao /dn , U n = (Un , Vn ) denotes the horizontal velocity vector, and ∇ = (∂/∂x, ∂/∂y) the horizontal gradient vector. On the free surface, z1 = ε1 ζ(x, y, t) the usual kinematic and dynamic boundary condition applies: W1 =
∂ζ + εo U 1 · ∇ζ on z1 = ε1 ζ ∂t p1 = 0 on z1 = ε1 ζ
(2.6) (2.7)
Along the seafloor, zN = − dhNo h, the kinematic boundary condition requires WN + U N · ∇h +
1 ∂h ho = 0, on zN = − h εo ∂t dN
(2.8)
At the imaginary interface between the layers, continuity of pressure and velocity is required: pn = pn+1 ,
on zn =
bn bn ηn , zn+1 = ηn for n = 1, N − 1 dn dn+1
(2.9)
U n = U n+1 , on zn =
bn bn ηn , zn+1 = ηn for n = 1, N − 1 dn dn+1
(2.10)
Wn = Wn+1 , on zn =
bn bn ηn , zn+1 = ηn for n = 1, N − 1 dn dn+1
(2.11)
10 For later use, we note here that the depth-integrated continuity equation can be obtained by integrating (2.3) across each of the layers. After applying the boundary conditions (2.10), (2.11), (2.6), and (2.8), the resulting equation reads ∇·
" N X dn Z n=1
ho
bn−1 ηn−1 dn bn η dn n
#
U n dz +
1 ∂h ∂ζ + =0 εo ∂t ∂t
(2.12)
We remark here that (2.12) is exact.
2.3
Approximate 2HD Governing Equations
A perturbation analysis will be performed utilizing the assumption O(µ2n ) ¿ 1.
(2.13)
Using µ2n as the small parameter, we can expand the dimensionless physical variables as power series of µ2n f=
∞ X
[M ] µ2M ; n f
(f = U n , Wn , ζ, pn )
(2.14)
M =0
Furthermore, we will adopt the following assumption on the vorticity field. We assume that the vertical vorticity components, (∂Un /∂y − ∂Vn /∂x), are of O(1), while the horizontal vorticity components are weaker and satisfy the following conditions ∂ U [0] = 0, ∂zn n
(2.15)
∂ U [1] = ∇Wn[0] . ∂zn n
(2.16)
Consequently, from (2.15), the leading order horizontal velocity components are independent of the vertical coordinate, i.e., [0] U [0] n = U n (x, y, t).
(2.17)
11 Substituting (2.14) into the continuity equation (2.3) and the boundary conditions (2.6) and (2.8), we collect the leading order terms as dn ∂Wn[0] [0] ∇ · Un + = 0 for n = 1, N ho ∂zn ∂ζ [0] + εo U 1 · ∇ζ on z1 = ε1 ζ ∂t ho 1 ∂h [0] [0] WN + U N · ∇h + = 0 on zN = − h εo ∂t dN [0]
W1 =
(2.18) (2.19) (2.20)
Integrating (2.18) with respect to zn and using (2.20) and (2.11) to determine the integration constants, we obtain the vertical profile of the vertical velocity components in the layers: Wn[0] = −zn Sn[0] − Tn[0]
(2.21)
where Sn[0] = Tn[0]
=
N −1 X
Ã
ηm
m=n
dn ∇ · U [0] n ho !
bm [0] 1 ∂h bm [0] [0] Sm+1 − Sm + ∇ · (hU N ) + dm+1 dm εo ∂t
(2.22)
Similarly, integrating (2.16) with respect to z with information from (2.21), we can find the corresponding vertical profiles of the horizontal velocity components: U [1] n = −
zn2 [0] S − zn ∇Tn[0] + C n (x, y, t) 2 n
(2.23)
in which C n are unknown functions. Up to O(µ2n ), the horizontal velocity components can be expressed as [1] 2 4 U n = U [0] n (x, y, t) + µn U n (x, y, z, t) + O(µn )
(2.24)
Now, we can define the horizontal velocity vectors, un (x, y, κn (x, y, t), t) evaluated at z = κn (x, y, t) as (
un =
U [0] n
−
µ2n
)
κ2n ∇Sn[0] + κn ∇Tn[0] + C n + O(µ4n ) 2
(2.25)
12 Subtracting (2.25) from (2.24), we can express U n in terms of un as (
U n = un −
µ2n
)
z 2 − κ2n ∇Sn + (z − κn )∇Tn + O(µ4n ) 2 Sn =
Tn =
N −1 X
Ã
ηm
m=n
(2.26)
dn ∇ · Un ho !
bm bm 1 ∂h Sm+1 − Sm + ∇ · (hU N ) + dm+1 dm εo ∂t
(2.27)
The exact continuity equation (2.12) can be rewritten approximately in terms of ζ and un . Substituting (2.26) into (2.12), we obtain Ã
!
N X 1 ∂h ∂ζ bn−1 bn ηn−1 − ηn un + +∇· εo ∂t ∂t ho ho n=1
−∇ ·
N X n=1
³
+
µ2n
dn ho
´2 bn−1 η n−1 dn
³ ´3 ³ ´3 bn−1 bn bn−1 b 2 n ( ηn−1 − dn ηn )zn dn ηn−1 − dn ηn − dn ∇Sn 6 2
−
³
bn η dn n
´2
2
bn−1 bn −( ηn−1 − ηn )zn ∇Tn = O(µ4n ) dn dn
(2.28)
Equation (2.28) is one of three governing equations for ζ and un . The other two equations come from the horizontal momentum equation, (2.4). However, we must find the pressure field first. This can be accomplished by approximating the vertical momentum equation (2.5) as Ã
∂pn 1 ∂Wn[0] [0] = − − µ2n + εo U [0] n · ∇Wn ∂zn εn ∂t Ã
−µ20
∂Wn[0] εo Wn[0] ∂zn
!
!
+ O(µ20 µ2n , µ4n )
(2.29)
We can integrate the equation above with respect to z1 to find the pressure field in the upper layer as (
z1 ∂S1 ∂T1 1 2 p1 = (ζ − ) + µ21 (z1 − ε21 ζ 2 ) + (z1 − ε1 ζ) ε1 2 ∂t ∂t ¾
½
1 2 2 εo (ε ζ − z12 )S12 + (z12 − ε21 ζ 2 )u1 · ∇S1 + εo (z1 − ε1 ζ)u1 · ∇T1 + εo µ20 2 2 1
13 +(ε1 ζ − z1 )S1 T1 } + O(µ2o µ21 ), η < z1 < ε1 ζ
(2.30)
To derive the governing equations for u1 , we first substitute (2.26) and (2.30) into (2.4) and obtain the following equation, ∂u1 ∂ + εo u1 · ∇u1 + ∇ζ + µ21 ∂t ∂t "
+εo µ21
(
κ21 ∇S1 + κ1 ∇T1 2
)
#
κ21 (u1 · ∇κ1 )∇T1 + κ1 ∇ (u1 · ∇T1 ) + κ1 (u1 · ∇κ1 )∇S1 + ∇ (u1 · ∇S1 ) 2 "
+εo µ2o
Ã
∂T1 T1 ∇T1 − ∇ ζ ∂t "
+ε2o ε1 µ2o ∇
Ã
!#
+
ε2o µ2o ∇
Ã
ho ζ 2 ∂S1 ζS1 T1 − − ζu1 · ∇T1 d1 2 ∂t
ζ2 ho S12 − u1 · ∇S1 2 d1
!#
³
= O µ2o µ21
´
!
(2.31)
It is remarked here that εo µ2o = ε1 µ21 , and all coefficients are written in terms of µo and εo whenever possible. Determination of un for n = 2, N does not require solving additional momentum equations. With boundary condition (2.10) and the known velocity profiles (2.26), un can be explicitly given as a function of un−1 : ´2 ³ κ2n − bn−1 ηn−1 d
un + µ2n
n
2
Ã
∇Sn + κn −
!
bn−1 ηn−1 ∇Tn = un−1 dn
´2 ³ Ã ! κ2n−1 − bn−1 ηn−1 bn−1 dn−1 2 ∇Sn−1 + κn−1 − ηn−1 ∇Tn−1 + O(µ4n−1 , µ4n ) +µn−1 2 dn−1
(2.32) Thus, the lower layer velocities can be directly calculated with knowledge of the upper layer velocity. Equations (2.28), (2.31), and (2.32) are the coupled governing equations, written in terms of un and ζ, for highly nonlinear, dispersive waves. A question that arises with the use of the matched velocity profiles in each layer is whether the vertical velocity gradients are continuous across the layer boundary, which is not a directly enforced boundary condition. If the gradients are not continuous, there is a discontinuity of the nonlinear, vertical transport terms
14 in the horizontal and vertical Euler’s equations. Specifically, the discontinuity would arise in the Wn (∂U n /∂zn ) term in (2.4) and the µ2o Wn (∂Wn /∂zn ) term in (2.5). However, with calculation of these nonlinear terms using the derived vertical velocity profiles, (2.21), and horizontal velocity profiles, (2.26), it can readily be shown that the discontinuity is of the truncation error order in the final model (to be shown), i.e. ∂U n (zn = ∂zn µ2o
∂Wn (zn = ∂zn
bn η ) dn n
bn η ) dn n
= µ2o
=
∂U n+1 (zn+1 =
bn η ) dn+1 n
∂zn+1
∂Wn+1 (zn+1 = ∂zn+1
bn η ) dn+1 n
+ O(µ4n , µ4n+1 )
(2.33)
+ O(µ2o µ2n , µ2o µ2n+1 )
(2.34)
Thus, the discontinuity of the nonlinear, vertical transport terms will not effect the overall accuracy of the model.
2.4
Heuristic Analysis of Truncation Error
In this section, the truncation error of the derived model is examined, and compared to that of other depth-integrated models. It is noted that the form of the truncation error in the N -layer model is a direct function of the initial scaling used to non-dimensionalize Euler’s equations. The overall accuracy of the N-layer equation model, or the largest truncation errors of the three equations, can be expressed as O(µ2o µ21 , µ42 , .., µ4N ). The heuristic approach taken here is to look at this truncation error as a finite value, not an order, and use this value to estimate the accuracy of the model compared to the O(µ2o ) Boussinesq equations (i.e. Ngowu, 1993) and the high-order, O(µ4o ) Boussinesq-type equations (i.e. Gobbi et al., 2000). The N-layer truncation error has an upper bound of O(µ4o ) when any dn is equal to ho , which corresponds to the truncation error of a traditional one-layer,
15 Boussinesq model. The lower bound occurs when µ2o µ21 = µ42 = ... = µ4N , or d1 ho = d22 = ... = d2N . With the constraint d1 + d2 + ... + dN = ho , the solution for d1 can be given by:
d1 =
−(N − 1) +
q
(N − 1)2 + 4
2
2 ho
(2.35)
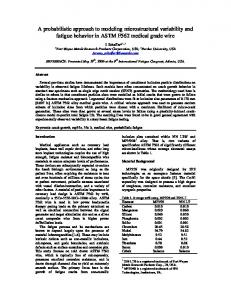
which for N = 2 gives d1 = 0.38ho , for N = 3 gives d1 = 0.17ho , and for N = 4, d1 = 0.09ho . Note that the layer boundaries for these three N ’s will be decided in a future section of this paper, based on agreement with known analytical properties of water waves. However, the decided-on boundary levels are remarkably close to these estimates. We can expect that the N -layer model will yield a more accurate result than the one-layer model, due to the fact that the error of approximation for the N -layer model is smaller. The truncation error values for these models, as well as the high-order Boussinesq-type equations that have a truncation error of O(µ6o ), are shown in Figure 2.2. This plot indicates that over the range µo
q
d1 /ho , however, the N -layer model
should be significantly more accurate than the high-order model. In fact, compared to a single layer model of any order, O(µno ), even the two-layer model should achieve higher accuracy as µo approaches 1. In the N -layer model, the truncation error tells us that µ2o µ21 and µ4n should be small compared to the included terms, which, due to the appearance of both O(µ2o ) and O(µ21 ) in the momentum equations, still requires that both O(µ2o ) and O(µ21 ) ¿ 1. The restriction of O(µ2o ) ¿ 1 could be avoided by including O(µ2o µ21 ) terms, thereby making the truncation error of the model O(µ2o µ41 , µ4n ). However, inclusion of O(µ2o µ21 ) terms yields a model with fifth-order in space derivatives.
16
1
0.9
0.8
Esimated Truncation Error
0.7
0.6
0.5
0.4
0.3
0.2
0.1
0
0
0.1
0.2
0.3
0.4
0.5 µo = kh
0.6
0.7
0.8
0.9
1
Figure 2.2: Comparison of truncation errors for three different models: (– –) error O(µ4o ) Boussinesq equations, (– ·) error O(µ6o ) High-Order Boussinesq equations, (—) 0.38µ4o minimized error for two-layer equations, (–?–) 0.17µ4o minimized error for three-layer equations, (–o–) 0.09µ4o minimized error for four-layer equations.
17 This is unacceptable for this particular derivation, whose primary goal is to create a high-order accurate model without requiring high-order derivatives.
Chapter 3 Analysis & Optimization of Multi-Layer Model 3.1
Introduction
In this chapter, the properties of one-, two-, three-, and four-layer models are discussed. In the next section, it is shown that the one-layer model is identical to the ”fully nonlinear extended Boussinesq equations,” found repeatedly in the literature of the past decade. The two-layer model is then scrutinized, examining linear properties (phase speed, group velocity, and shoaling) and nonlinear properties characterized by Stokes theory. Next, the linear properties of the three- and four-layer models are optimized, and the vertical profiles of the velocity field are given. Lastly, a summary of the multi-layer models is presented and compared with existing depth-integrated models.
18
19
3.2
One-Layer Equation Model
For the one-layer model, the horizontal velocity vector is given as (
U 1 = u1 −
µ2o
)
z12 − κ21 ∇S1 + (z1 − κ1 )∇T1 + O(µ4o ) 2
(3.1)
where S 1 = ∇ · u1 ,
T1 = ∇ · (hu1 ) +
1 ∂h εo ∂t
(3.2)
The exact continuity equation (2.12) can be rewritten approximately in terms of ζ and u1 . Substituting (3.1) into (2.12), we obtain 1 ∂h ∂ζ + + ∇ · [(εo ζ + h) u1 ] εo ∂t ∂t ("
−µ2o ∇
·
#
ε3o ζ 3 + h3 (εo ζ + h)κ21 − ∇S1 6 2
"
#
)
ε2 ζ 2 − h2 + o − (εo ζ + h)κ1 ∇T1 = O(µ4o ) 2
(3.3)
Equation (3.3) is one of two governing equations for ζ and u1 . The momentum equation for u1 is ∂u1 ∂ + εo u1 · ∇u1 + ∇ζ + µ2o ∂t ∂t "
+εo µ2o
(
κ21 ∇S1 + κ1 ∇T1 2
)
#
κ2 (u1 · ∇κ1 )∇T1 + κ1 ∇ (u1 · ∇T1 ) + κ1 (u1 · ∇κ1 )∇S1 + 1 ∇ (u1 · ∇S1 ) 2 "
+εo µ2o
Ã
∂T1 T1 ∇T1 − ∇ ζ ∂t "
+ε3o µ2o ∇
!#
Ã
+
ε2o µ2o ∇
ζ 2 ∂S1 ζS1 T1 − − ζu1 · ∇T1 2 ∂t
!
#
´ ζ2 ³ 2 S1 − u1 · ∇S1 = O(µ4o ) 2
(3.4)
This one-layer model, often referred to as the ”fully nonlinear, extended Boussinesq equations” in the literature (e.g. Wei & Kirby, 1995), has been examined and applied to a significant extent. The weakly nonlinear version of (3.3) and (3.4) (i.e. assuming O(εo ) = O(µ2o ), thereby neglecting all nonlinear dispersive terms) was
20 first derived by Nwogu (1993). Nwogu, through linear and first-order nonlinear analysis of the equation model, recommended that z1 = −0.531h, and that value has been, for the most part, adopted by other researchers using these equations. Nwogu’s model was extended to ”full nonlinearity” by Liu (1994) and Wei & Kirby (1995). There are some discrepancies between Liu’s and Wei & Kirby’s derived equations, which can be attributed to a neglect of some nonlinear dispersive terms in Wei & Kirby (Hsaio & Liu, 2002). The above, one-layer model equations (3.3) and (3.4) are identical to those derived by Liu (1994). The one-layer model has been used to study a number of 2HD real world phenomenon, including rip currents (Chen et al., 1999), longshore currents (Chen et al., 2002), and a variety of harbor problems (e.g. Shi et al., 2002). The numerical scheme employed for these simulations is adopted here for the two-layer model, and will be described in detail in Chapter 4.
3.3
Two-Layer Equation Model
For the two-layer model, we can define the horizontal velocity vectors as (
U 2 = u2 − µ22 (
U 1 = u1 −
µ21
)
z22 − κ22 ∇S2 + (z2 − κ2 )∇T2 + O(µ42 ) 2
(3.5)
)
z12 − κ21 ∇S1 + (z1 − κ1 )∇T1 + O(µ41 , µ21 µ22 ) 2
(3.6)
where S2 =
d2 ∇ · u2 , ho
d1 S1 = ∇ · u1 , ho
T2 = ∇ · (hu2 ) + Ã
1 ∂h εo ∂t !
d1 T1 = η S2 − S1 + T2 d2
(3.7)
21 The exact continuity equation (2.12) can be rewritten approximately in terms of ζ, u1 , and u2 . Substituting (3.5) and (3.6) into (2.12), we obtain "
Ã
!
ho ∂h ho ∂ζ ho + + ∇ · (ε1 ζ − η) u1 + η + h u2 d1 εo ∂t d1 ∂t d1
#
3 3 3 d1 3 ho d1 ho 2 η + h 3 3 (η + h )κ d2 d2 d2 2 d2 −µ22 ∇ · − d2 ∇S2 d1 6 2
d2
2
2
2
η 2 1 − h2 hd2o d2
+
2 ("
−µ21 ∇ ·
− (η
ho d1 + h )κ2 ∇T2 d2 d2 #
ε31 ζ 3 − η 3 (ε1 ζ − η)κ21 − ∇S1 6 2
"
#
)
ε2 ζ 2 − η 2 + 1 − (ε1 ζ − η)κ1 ∇T1 = O(µ41 , µ21 µ22 , µ42 ) 2
(3.8)
Equation (3.8) is one of three governing equations for ζ and un . The governing, momentum equation for u1 is ∂ ∂u1 + εo u1 · ∇u1 + ∇ζ + µ21 ∂t ∂t "
+εo µ21
(
κ21 ∇S1 + κ1 ∇T1 2
)
#
κ2 (u1 · ∇κ1 )∇T1 + κ1 ∇ (u1 · ∇T1 ) + κ1 (u1 · ∇κ1 )∇S1 + 1 ∇ (u1 · ∇S1 ) 2 "
+εo µ2o
Ã
∂T1 T1 ∇T1 − ∇ ζ ∂t "
+ε2o ε1 µ2o ∇
Ã
!#
Ã
+
ε2o µ2o ∇
ho ζ 2 ∂S1 ζS1 T1 − − ζu1 · ∇T1 d1 2 ∂t
ho ζ2 S12 − u1 · ∇S1 2 d1
!
!#
= O(µ41 , µ20 µ21 , µ21 µ22 )
(3.9)
Determination of u2 does not require solving an additional momentum equation. With boundary condition (2.10) and the known velocity profiles (3.5) and (3.6), u2 can be explicitly given as a function of u1 : Ã ! d2 κ22 − d12 η 2 d1 2 u2 + µ22 ∇S2 + κ2 − η ∇T2 = 2 d2 (
u1 +
µ21
)
κ21 − η 2 ∇S1 + (κ1 − η) ∇T1 + O(µ41 , µ21 µ22 , µ42 ) 2
(3.10)
22 Thus, the lower layer velocity can be directly calculated with knowledge of the upper layer velocity. Equations (3.8), (3.9), and (3.10) are the coupled governing equations for the two-layer system.
3.3.1
Analysis of Model Equations
In this section, the properties of the two-layer model will be scrutinized and optimized. First, it is shown that the two-layer model will reduce to the well-studied, ”extended” Boussinesq model derived by Ngowu (1993). With the use of O(µ2n ) substitutions, namely: u2 = u1 + O(µ2n ),
(3.11)
we can eliminate one of the unknowns from our equation system. Rewriting (3.8) in terms of u1 only, assigning d1 = ho , κ2 = − hd2o h, η = −h, and examining the weakly nonlinear form of the equations, gives 1 ∂h ∂ζ + + ∇ · [(εo ζ + h) u1 ] εo ∂t ∂t ("
−µ2o ∇
·
#
"
#
)
h3 hκ21 h2 ∇S1∗ − − + hκ1 ∇T1∗ = O(εo µ2o , µ4o ) 6 2 2
(3.12)
where S1∗ = ∇u1 ,
T1∗ = ∇ · (hu1 ) +
1 ∂h εo ∂t
(3.13)
The momentum equation, (3.9), becomes ∂u1 ∂ + εo u1 · ∇u1 + ∇ζ + µ2o ∂t ∂t
(
)
κ21 ∇S1∗ + κ1 ∇T1∗ = O(εo µ2o , µ4o ) 2
(3.14)
This system for ζ and u1 is identical to the model derived by Ngowu. Additionally, the nonlinear dispersive terms, which have been truncated for the sake of brevity in (3.12) and (3.14), are identical to those derived by Liu (1994) (and derived in section 3.1). For the rest of this paper, the ”extended” Boussinesq model including
23 all the nonlinear dispersive terms up to O(µ2o ), as given by Liu (1994), will be referred to as the one-layer model. For the rest of this section, the focus will be on analysis of the three-unknown, (ζ, u1 , and u2 ) two-layer system. Additionally for the rest of this section, all quantities discussed are in dimensional form, with asterisks no longer applied. With the weak rotationality assumption, the momentum equation, (3.9), can be simplified, in dimensional form, to (see Hsiao and Liu, 2002) ∂u1 1 ∂ + ∇(u1 · u1 ) + g∇ζ + ∂t 2 ∂t (
+∇
(
Ã
!
)
κ21 ζ2 ∇S1 + κ1 ∇T1 − ∇ S1 − ∇ (ζT1 ) 2 2
´ ∂ζ 1³ 2 (T1 + ζS1 ) + (κ1 − ζ) (u1 · ∇) T1 + κ1 − ζ 2 (u1 · ∇) S1 ∂t 2 ¾
i 1h + (T1 + ζS1 )2 = 0 2
(3.15)
This is the momentum equation that will be analyzed and numerically solved in this paper. Before solving the system, the linear and nonlinear dispersion properties are examined. Let us define the arbitrary evaluation levels and the boundary between the two layers as: κ1 = α1 h + β1 ζ,
η = α2 h + β2 ζ,
κ2 = α3 h + β3 ζ
(3.16)
where the coefficients α and β are arbitrary and user-defined. The one-horizontal dimension, constant water depth, two-layer equations are rewritten in dimensional form, keeping, for brevity, only linear terms. These equations are 3 ∂u1 ∂u2 ∂ζ ∂ 3 u1 3 ∂ u2 + δ1 h + δ2 h + δ3 h3 + δ h =0 4 ∂t ∂x ∂x ∂x3 ∂x3
∂u1 ∂ζ ∂ 3 u1 ∂ 3 u2 +g + δ5 h2 2 + δ6 h2 2 = 0 ∂t ∂x ∂x t ∂x t 2 2 ∂ u1 2 ∂ u2 u1 − u2 − δ7 h2 − δ h =0 8 ∂x2 ∂x2
(3.17) (3.18) (3.19)
24 where δ1 = −α2 ,
δ2 = 1 + α 2 ,
−2α23 + 6α1 α22 − 3α12 α2 δ3 = , 6
2α23 − 6α1 α22 − 6α1 α2 + 3α32 α2 + 6α3 α2 + 3α32 + 6α3 + 2 , 6 α12 α12 + α22 δ5 = − α1 α2 , δ6 = α1 α2 + α1 , δ7 = − + α1 α2 2 2 α2 + α32 δ8 = 2 − α1 α2 + α3 − α1 (3.20) 2 δ4 =
The assumed dimensional solution form ζ = ²ζ (0) eiθ + ²2 ζ (1) e2iθ + .... (0)
(1)
u1 = ²u1 eiθ + ²2 u1 e2iθ + ....
(0)
(1)
u2 = ²u2 eiθ + ²2 u2 e2iθ + ....
(3.21)
where θ = kx − wt, k is the wavenumber, w is the wave frequency, and ² is simply an ordering parameter, are substituted into the derived equations. Linear Dispersion Relation The first order (in ²) system yields the linear dispersion relation: c2 =
w2 gh [1 + N1 (kh)2 + N2 (kh)4 ] = k2 1 + D1 (kh)2 + D2 (kh)4
(3.22)
where c is the wave celerity and the coefficients N1 , N2 , D1 , and D2 are given in Appendix A.1 and are solely functions of α1 , α2 , and α3 . The above dispersion relation will be compared with both the [4,4] Pade approximation c2 =
gh [1 + 1/9(kh)2 + 1/945(kh)4 ] w2 = k2 1 + 4/9(kh)2 + 1/63(kh)4
(3.23)
and the [6,6] Pade approximation c2 =
gh [1 + 5/39(kh)2 + 2/715(kh)4 + 1/135135(kh)6 ] w2 = k2 1 + 6/13(kh)2 + 10/429(kh)4 + 4/19305(kh)6
(3.24)
25 of the exact linear dispersion relation: c2e =
w2 g = tanh(kh) 2 k k
(3.25)
The Pade approximates utilized here are approximations of the hyperbolic tangent function, where the numbers in the brackets represent the highest polynomial order of kh in the numerator and denominator. Group velocity of the two-layer model equations, cg , can be determined straightfowardly by taking the derivative of (3.22) with respect to k. Vertical Velocity Profile Let us define the function f1 (z) as the horizontal velocity, with constant water depth, normalized by its value at z = 0. This function is composed of two quadratic polynomial elements, given by: f1 (z) =
1 + (kh)2
h
1 2
(0)
1 − (kh)2
f1 (z) = f1 (η)
i
(0)
(z 2 /h2 − α12 ) + α2 (α1 − z/h) + u2 /u1 (α2 + 1)(z/h − α1 )
1 + (kh)2
h
h
1 2 α 2 1
(0)
(0)
− α2 α1 + u2 /u1 (α2 + 1)α1
for z ≥ η = α2 h 1 2
1 + (kh)2
1 2
i
(α22 − α32 ) + (α2 − α3 )
,
(3.26)
i
(z 2 /h2 − α32 ) + (z/h − α3 )
h
i
, for z < η = α2 h (3.27)
From the linear equation system we know that, (0)
u1 = (0)
u2 = (0)
(0)
and thus the ratio u2 /u1
gζ (0) [kh − δ8 (kh)3 ] hw [1 + D1 (kh)2 + D2 (kh)4 ]
(3.28)
gζ (0) [kh + δ7 (kh)3 ] hw [1 + D1 (kh)2 + D2 (kh)4 ]
(3.29)
present in (3.26) can be evaluated. Similarly, the
vertical velocity profile, normalized by the velocity at the still water level, is given by f2 (z): (0)
f2 (z) =
(0)
z/h − α2 + u2 /u1 (α2 + 1) (0)
(0)
−α2 + u2 /u1 (α2 + 1)
, for z ≥ η = α2 h
(3.30)
26 f2 (z) = f2 (η)
z/h + 1 , for z < η = α2 h α2 + 1
(3.31)
which is a piecewise linear function. Linear Shoaling Properties Based on linear theory, the exact shoaling gradient is given as: hx [1 − khtanh(kh)][1 − tanh2 (kh)] hx aex = Aex = −khtanh(kh) a h {tanh(kh) + kh[1 − tanh2 (kh)]}2 h
(3.32)
The linear shoaling properties of the two layer model are determined using the constancy of energy flux concept, i.e ax 1 (Cg )x =− a 2 Cg
(3.33)
where Cg is the wave group velocity. First, the derivative of (3.22) is taken with respect to k, giving: w (kh)S1 cg = g S22
(3.34)
where cg is the wave group velocity, and S1 = D2 N2 (kh)8 + 2D1 N2 (kh)6 + (3N2 + D1 N1 − D2 ) (kh)4 + 2N1 (kh)2 + 1 (3.35) S2 = D2 (kh)4 + D1 (kh)2 + 1
(3.36)
Taking the derivative of (3.34) with respect to x, noting that dw/dx=0, we have S3 w (cg )x = (kh)x 3 g S2
(3.37)
where S3 = D22 N2 (kh)12 + 3D1 D2 N2 (kh)10 + (6D12 N2 − 3D1 D2 N1 + 3D22 )(kh)8 +(17D1 N2 − 10D2 N1 + D12 N1 − D1 D2 )(kh)6 + (15N2 + 3D1 N1 − 12D2 )(kh)4
27 +(6N1 − 3D1 )(kh)2 + 1
(3.38)
(cg )x (kh)x S3 = cg kh S1 S2
(3.39)
giving the ratio
Taking the derivative of the dispersion relation (3.22), with respect to x, gives kx 1 S4 hx =− k 2 S1 h
(3.40)
where S4 = D2 N2 (kh)8 + (3D1 N2 − D2 N1 )(kh)6 +(5N2 + D1 N1 − 3D2 )(kh)4 + (3N1 − D1 )(kh)2 + 1
(3.41)
Finally, the linear shoaling gradient of the two-layer model can be given: µ
1 ax S4 =− − a 2 4S1
S3 hx S1 S2 h
(3.42)
Note that this solution form is valid in any system for which the dispersion relation can be expressed in the form of (3.22). Second Order, Nonlinear Interactions: Steady Waves Now we find the nonlinear corrections to the linear problem. The two-layer equations must now be truncated to include quadratic nonlinear terms, as well as linear terms. Collecting the O(²2 ) terms from the substitution of the assumed steady wave, (3.21), into the nonlinear equation system will yield an equation system in the general form:
b11 b21
0
b12 b13 ζ b22
(1)
(1) b23 u1
b32 b33
(1)
u2
R1 = R2
R3
28 where b11 , ..., b33 are functions of the linear δ coefficients, and R1 , .., R3 are tedious functions of the α and β parameters. This approximate expression can be compared to the second-order solution: 2
(1) ζStokes
kζ (0) = [3coth3 (kh) − coth(kh)] 4
(3.43)
which is derived from Stokes theory. Second Order, Nonlinear Interactions: Bichromatic Interactions Examining a two-wave group, the free surface can be written as (0)
(0)
(1)
(1)
ζ = ²ζ1 ei(k1 x−w1 t) + ²ζ2 ei(k2 x−w2 t) + ²2 ζ1 e2i(k1 x−w1 t) + ²2 ζ2 e2i(k2 x−w2 t) +²2 ζ + ei(k+ x−w+ t) + ²2 ζ − ei(k− x−w− t)
(3.44)
where ζ+ , ζ− are the sum and difference components of the two first order wave frequencies, k∓ = k1 ∓ k2 , and w∓ = w1 ∓ w2 . Similar expressions can be given for un . To find the sub- and super-harmonic amplitudes for the bichromatic wave group problem, the procedure is the same as described above for the steady wave (single, first-order harmonic) problem. The assumed solution (3.44) is substitued into the two-layer equation system. For each of the forced second-order solutions, [(k1 − k2 )x − (w1 − w2 )t] and [(k1 + k2 )x + (w1 − w2 )t], the matrix system is written in the same form as for the steady wave problem. The sum and difference free ∓ surface components can be compared with those from Stokes theory, ζStokes , which
can be found in Shaffer (1996).
3.3.2
Choice of Arbitrary Levels: Linear Optimization
Through examination of linear and nonlinear properties, the most accurate set of arbitrary levels will be chosen in this section. First, the linear properties of the
29 two-layer model will be optimized, independent of nonlinearity. In the linear sense, the three levels are given as κ1 = α1 h, η = α2 h, and κ2 = α3 h, where κ1 and κ2 are the levels at which horizontal velocities are evaluated in the upper and lower layers, and η is the location of the interface between the layers. Of course, possible values are bounded by 0 ≥ α1 ≥ α2 ≥ α3 ≥ −1. Defining a model accuracy, or model error, can be difficult and often can depend on the specific physical problem being examined. For this analysis, a representation of the overall error, including errors in wave speed, group velocity, and shoaling, is sought. The error will be given by the minimization parameter ∆Linear :
∆Linear
Ω X |ceg − cg |
Ω X |ce − c|
1 kh=0.1 kh = Ω X 3 |ce | kh=0.1 kh
+
kh=0.1 Ω X
kh
|ceg | kh=0.1 kh
Ω X |Aex − Ax |
+
kh=0.1 Ω X
kh
|Aex | kh=0.1 kh
(3.45)
where ce , ceg , and Aex are the exact linear phase speed, group velocity, and shoaling gradient, whereas c, cg , and Ax are the approximate values taken from the two-layer model derived here. The right hand side is divided by three, so as to normalize the total error created by the three different sources. All of the summations are divided by kh so that errors at low wave numbers are more important than high wave number errors. The reason for this weighting is a peculiarity of the optimization: it was possible to sacrifice low wavenumber accuracy (kh 10) during runup and rundown. The results of the numerical simulation are shown in Figure 4.8. Figure 4.8a) shows the numerical free surface at various times, along with two profiles of the analytic free surface. The comparison between analytic and numerical horizontal shoreline movement is shown as Figure 4.8b). The agreement is good. Also, as a check on the convergence properties of δ, an additional simulation with δ = ao /5000 was run. A comparison between the δ = ao /50 shows little difference, and is not given in this paper . The maximum deviation in shoreline at any time between the two δ runs is on the order of 0.01% of the maximum excursion.
87
a)
0.02
Z (m)
0.01 0 −0.01 −0.02
Vert. Shoreline Movement (m)
−12
−10
−8
−6 X (m)
−4
−2
0
b)
0.02 0.01 0 −0.01 −0.02 0
5
10
15 Time (s)
20
25
30
Figure 4.8: Sine wave runup on a planar beach, a) Numerical free surface at various times, analytic free surface is shown by the dashed line (−−), and is only compared for the maximum and minimum shoreline movement profiles. b) Comparison between analytical (−−) and numerical (−) shoreline movement. Nonbreaking and Breaking Solitary Wave Runup Solitary wave runup and rundown was investigated experimentally by Synolakis (1986,1987). In his work, dozens of experimental trials were performed, encompassing two orders of magnitude of solitary wave height. The beach slope was kept constant at 1:19.85. Many researchers have used this data set to validate numerical models (e.g., Zelt, 1991; Lin et al., 1999). To compare with this data, solitary waves with heights in the range of 0.005 < ε < 0.5 are made to runup
88 and rundown a slope and the maximum vertical runup is calculated. Note that this range includes both non-breaking and breaking waves. For all simulations, q
∆x/h = 0.3 and ∆t g/h = 0.03. As a test of the sensitively of wave runup to bottom friction, three sets of simulations were undertaken with different bottom friction coefficients, f . Set 1 was run with no bottom friction, Set 2 with f = 10−3 , and Set 3 with f = 10−2 . The numerical results are compared with the experimental data in Figure 4.9, where maximum vertical runup is scaled by the water depth. For the smallest solitary waves (ε < 0.01) bottom friction does not affect the runup, as maximum runup is identical for all three numerical sets. This is consistent with previous research (e.g., Liu et al. 1995), where it is shown that bottom friction effects are minor for nonbreaking waves, and will typically alter the runup by < 0.5% of the maximum. For larger wave heights, breaking is initiated, both experimentally and numerically, near εo = 0.04. It is at this point that the numerical runup for Set 1 and Set 2 begins to diverge. Note that due to the log-log scale used in Figure 4.9, the deviation in maximum runup may not be apparent. As an example, for εo = 0.3, scaled runup with no bottom friction is 1.21, with f = 10−3 runup is 0.73, and with f = 10−2 is 0.45, which are significantly different. Use of f = 5 ∗ 10−3 yields the best agreement with experimental data for this particular case. It would seem that inclusion of an accurate bottom friction parameterization becomes increasingly important with increasing degree of wave breaking. The probable reason is that as a broken wave runs up a mild slope, it travels up the slope as a fairly thin layer of water. As can be seen from (4.34), the smaller the total water depth, the more important bottom friction becomes. Synolakis (1986) also photographed the waves during runup and rundown. One
89 0
R/h
10
−1
10
−2
10
−2
−1
10
10 H/h
Figure 4.9: Nondimensional maximum runup of solitary waves on a 1:19.85 beach versus nondimensional wave height. The points represent experimental data taken from Synolakis (1986), the dotted line is the numerical result with no bottom friction, the solid line is the numerical result with a bottom friction coefficient, f , of 10−3 , and the dashed line with f = 10−2 . set of these snapshots, for εo = 0.28, was digitized and compared with the numerical prediction, shown in Figure 4.10. The numerical simulation shown in this figure uses f = 10−3 . The wave begins to break between Figs. 4.10a) and 4.10b), and the runup/rundown process is shown in Figs. 4.10c)-d). In Fig 4.10c), numerical snapshots from three other models are plotted. The comparisons indicate a significant improvement over weakly nonlinear Boussinesq equation results of Zelt (1991)
90 and the NLSW results of Titov and Synolakis (1995). Additionally, the numerical results presented in this paper compare favorably to the two dimensional (vertical plane) results of Lin et al. (1999), which makes use of a complex turbulence model.
4.3.4
Validation in Two Horizontal Dimensions
Long Wave Resonance in a Parabolic Basin Analytic solutions exist for few nonlinear, two horizontal dimension problems. One such solution is that for a long wave resonating in an circular parabolic basin. Thacker (1981) presented a solution to the NLSW equations, where the initial free surface displacement is given as: "
ζ(r, t = 0) = ho
r2 (1 − A2 )1/2 −1− 2 1−A a
(
1 − A2 −1 (1 − A2 )2
)#
(4.50)
and the basin shape is given by: Ã
h(r) = ho
r2 1− 2 a
!
(4.51)
where A=
a4 − ro4 , a4 + ro4
(4.52)
ho is the center point water depth, r is the distance from the center point, a is the distance from the center point to the zero elevation on the shoreline, and ro is the distance from the center point to the point where the total water depth is initially zero. The numerical values used for this test are : ho = 1.0m, ro = 2, 000m, and a = 2, 500m. The centerline initial condition and depth profile is shown in Figure 4.11. Thacker showed the solution to this problem to be: "
ζ(r, t) = ho
(1 − A2 )1/2 r2 −1− 2 1 − A cos wt a
(
)#
1−A −1 (1 − A cos wt)2
(4.53)
91
0.6 0.4 0.2 a)
0 −0.2 −20
−15
−10
−5
0
5
10
0.6 0.4 0.2 b)
0 −0.2 −20
−15
−10
−5
0
5
10
0.6
z/h
0.4 0.2 c)
0 −0.2 −20
−15
−10
−5
0
5
10
0.6 0.4 0.2 d)
0 −0.2 −20
−15
−10
−5
0
5
10
Figure 4.10: Breaking solitary wave runup and rundown on a planar beach at t(g/h)1/2 = a) 15, b) 20, c) 25, d) 45. The solid line represents the numerical results and the points experimental data. In c) the dashed line represents numerical results by Lin et al. (1999) (closest to experiment and numerical results presented in this paper), the dotted line represents results by Zelt (1991), and the dashed-dotted line results by Titov and Synolakis (1995).
92
Figure 4.11: Initial free surface and depth profile for parabolic basin test. where 1 w = (8gho )1/2 a
(4.54)
and g is gravity. Cho (1995) also used this solution as a test for his NLSW moving boundary model. Cho’s model, an explicit leap-frog finite-difference scheme which includes numerical frequency dispersion, reproduced the analytical solution very well for roughly one-half of an oscillation, but began to deviate soon after. A simulation using the extrapolation boundary technique presented in this paper was undertaken, truncating the dispersive terms in (3.3) and (3.4) to be consistent with the NLSW solution, and using ∆x = 28m and ∆t = 0.9s. Bottom friction is not included and the wave does not break. The comparison between the numerical and analytic results is shown in Figure 4.12. The numerical free surfaces
93 2
2 b)
1.5
1.5
1
1 Z (m)
Z (m)
a)
0.5
0.5
0
0
−0.5
−0.5
−1
0
2000
4000 X (m)
6000
−1
8000
2
0
2000
4000 X (m)
6000
2 d)
1.5
1.5
1
1 Z (m)
Z (m)
c)
0.5
0.5
0
0
−0.5
−0.5
−1
8000
0
2000
4000 X (m)
6000
8000
−1
0
2000
4000 X (m)
6000
8000
Figure 4.12: Centerline free surface profiles for numerical (−−) and analytical (···) bowl oscillation solutions at t= a) 5T , b) 5 16 T , c) 5 31 T , d) 5 12 T , where T is the oscillation period. shown in Fig 4.12a)-d) are from the fifth oscillation, and show excellent agreement with the analytic solution. Additionally, a test using the full equations (3.3) and (3.4), with dispersive terms, was performed. Interestingly, the wave field in this situation becomes chaotic after the first oscillation, and shows a similar pattern of divergence from the analytical solution as Cho’s results. Therefore this parabolic basin comparison would appear to be an ideal test for NLSW models, as the effects of numerical dispersion or dissipation become evident rapidly.
94 Runup on a Conical Island Briggs et al. (1994) presented a set of experimental data for solitary wave interaction around a conical island. The slope of the island is 1:4 and the water depth is 0.32m. Three cases were simulated, corresponding to solitary wave heights of 0.013 m (εo = 0.04) , 0.028 m (εo = 0.09), and 0.058 m (εo = 0.18). In addition to recording free surface elevation at a half dozen locations, maximum wave runup around the entire island was measured. This data set has been used by several researchers to validate numerical runup models (e.g., Liu et al., 1995; Titov and Synolakis, 1998; Chen et al., 2000). In this paper, free surface elevation is compared at the locations shown in Figure 4.13. Gages #6 and #9 are located near the front face of the island, with #9 situated very near the initial shoreline position. Gages #16 and #22 are also located at the initial shoreline, where #16 is on the side of the island and #22 on the back face. Simulations were performed using ∆x = 0.15m and ∆t = 0.02s; bottom friction is neglected for these numerical tests. A soliton is placed in the numerical domain, as an initial condition. Numerical-experimental time series comparisons are shown in Figure 4.14. Figures 4.14a)-d) are for Case 1 (εo = 0.04), 4.14e)-h) are for Case 2 (εo = 0.09), and 4.14i)-l) are for Case 3 (εo = 0.18). The gage number is shown in the upper left of each subplot. For all comparisons, the lead wave height and shape is predicted very well with the current model. Also, for all comparisons, the secondary depression wave is not predicted well. The numerical results show less of a depression following the main wave than in the experiments. This deviation is consistent with other runup model tests (e.g., Liu et al., 1995; Chen et al., 2000). The agreement of Case 3 is especially notable, as the soliton breaks along the back side of the island as the trapped waves intersect. This breaking occurs both
95
Figure 4.13: Conical island setup. The gage locations are shown by the dots, and the wave approaches the island from the left. experimentally, as discussed in Liu et al. (1995), and numerically. As mentioned, maximum runup was also experimentally recorded. The vertical runup heights are converted to horizontal runups, scaled by the initial shoreline radius, and plotted on Figure 4.15. The crosshairs represents the experimental data, where Fig. 4.15a) is for Case 1., Fig. 4.15b) is for Case 2, and Fig. 4.15c) is for Case 3. The numerical maximum inundation is also plotted, given by the solid line. The agreement for all cases is very good.
96 0.05 0.02
#6
a)
0.1 #6
e)
0.01
Z (m)
#6
i)
0.05
0
0
0
−0.01
−0.05
−0.02 10
15
20
25
−0.05
10
15
20
0.05 0.02
#9
b)
10
15
20
0.1 #9
f)
#9
j)
0.05
0.01
Z (m)
−0.1
0
0
0
−0.01
−0.05
−0.02 10
15
20
25
−0.05
10
15
20
0.05 0.02
#16
c)
10
15
20
0.1 #16
g)
#16
k)
0.05
0.01
Z (m)
−0.1
0
0
0
−0.01
−0.05
−0.02 10
15
20
25
−0.05
10
15
20
0.05 0.02
#22
d)
10
15
20
0.1 #22
h)
#22
l)
0.05
0.01
Z (m)
−0.1
0
0
0
−0.01
−0.05
−0.02 10
15 20 Time (s)
25
−0.05
10
15 Time (s)
20
−0.1
10
15 Time (s)
20
Figure 4.14: Experimental (- -) and numerical (–) time series for solitary wave interaction with a conical island. Figures a) - d) are for case A, e) - h) are for case B, and i) - l) are for case C. The gage number is shown in the upper left. Soliton Evolution in a Trapezoidal Channel Peregrine (1969) presented laboratory experiments wherein solitary waves propagated through a trapezoidal channel. To experimentally create the solitons, a
97
120
90 1
60
0.5
150
a)
120
30
180
330 240
270
300
60
0.5
150 0
210
90 1
b)
120
30
180
330 240
270
300
60
0.5
150 0
210
90 1
c) 30
180
0
210
330 240
270
300
Figure 4.15: Maximum horizontal runup, scaled by the initial shoreline radius, for case A a), case B b), and case C c). Experimental values are shown by the stars and the numerical results by the solid line. piston wavemaker was cut to fit the channel and could slide horizontally along the trapezoidal channel. In the numerical simulations, as it is difficult to implement a piston wavemaker in a trapezoidal channel, the solutions of solitary waves in rectangular channels are used as an initial condition everywhere in the channel. Once a solitary wave enters a trapezoidal channel, it deforms. Eventually, in certain channels, the leading wave will reach a quasi steady state, and the waveform will not change in time. After reaching this quasi steady state, numerical results of the lead wave height are compared with Peregrine’s experimental results. The comparisons are shown in Figure 4.16. For this comparison, a trapezoidal half - channel (one vertical wall and one sloping side wall) with constant depth width of 1.5ho , where ho is the depth at the non-sloping part the channel, and a sidewall slope of 1:1 is employed. Three different amplitude solitary waves (a = 0.08ho , a = 0.12ho , and a = 0.18ho ) are simulated and compared with experimental results. The numerical results show reasonably good agreement with laboratory data, although there is a clear trend of under prediction of wave height near the
98 0.35
0.3
0.25
0.2 z/ho
a=0.18
0.15 a=0.12 0.1 a=0.08
0.05
0
0
0.5
1
1.5 x/ho
2
2.5
3
Figure 4.16: The transverse profile of a solitary wave in a trapezoidal channel. The continuous line shows the numerical result; the crosses indicate the measured profile digitized from Peregrine’s (1969) paper. shoreline. An interesting property of wave evolution in certain trapezoidal channels is the successive regeneration of the wave front. When the channel is wide enough, with respect to the wavelength, and the side-wall slope is gradual enough, the wave energy that is reflected off the side walls does not resituate in the original wave, as occurs in the Peregrine (1969) experiments discussed above, but forms a distinct wave behind the original wave front. Wave energy is continually transferred from the original wave front into the new wave behind, until the original wave front
99 virtually disappears. The new front has a smaller height, and a slightly longer wavelength than the original. One example of the phenomenon is discussed in this section. A half channel is created (one vertical wall at y = 0, one sloping side wall), with a constant water depth width of 9ho and a length of 250ho , where ho is the constant water depth along the center of the channel. The side wall is sloped at 1:5. A solitary wave, with wave height 0.1ho is placed in the channel as an initial condition. The wave does not break, and bottom friction is not included. For this simulation, ∆x/ho = 0.14 q
and ∆t g/ho = 0.05 are used. Figure 4.17 shows four snapshots, in plan view, of the wave propagating through the part of channel. The dashed line plotted across the channel is the x − ct = 0 √ line, where c is the linear long wave speed, gho . Seafloor elevation contours are also shown on each plot. Fig. 4.17a) shows the wave soon after the simulation has begun, and the front is beginning to arc, due to slower movement in the shallower water. By the time shown in Fig. 4.17b), wave energy has reflected off the slope, and has formed a second, trailing, wave crest behind the original wave. As this slope-reflected wave crest interacts with the vertical wall (or centerline of channel), a Mach stem forms at the vertical wall, and virtually no wave energy is reflected off the vertical wall. Also at this time, an oscillatory train, trailing the leading wave, forms along the slope. At time = 65, shown in Fig. 4.17c), most of the wave energy has transferred from the original wave front, to the secondary crest. In the last plot, Fig. 4.17d), the process has started to repeat itself, evidenced by the lobe growing behind the second front, near a depth of 0.9. This process can be examined from a different perspective with Figure 4.18. This figure shows numerous time series, taken along the centerline of the channel
100
Figure 4.17: Evolution of a solitary wave in a trapezoidal channel (half channel shown), at t(g/h)1/2 = a) 7.5 b) 35 c) 65 d) 93. Seafloor elevation contours are shown at increments of 0.5 ho , by the solid lines. The line of x − ct = 0 is shown by the dashed line. (y = 0). Also shown are three characteristic lines. Following the first characteristic, we can see that the lead wave as nearly disappeared by x = 140ho , whereas the secondary wave is clearly defined by this point. The process repeats; at x = 230ho , the secondary wave is vanishing, and a third wave front is beginning to take shape. The phenomenon shown in Figs. 4.17 and 4.18 is an interesting one, although not wholly unexpected, and is a demonstration of the interaction between nonlinearity and refraction.
101
20 x= 230ho x= 220ho
18
x= 210ho x= 200ho
16
x= 190ho x= 180ho
14
x= 170ho x= 160ho
12 z/a
x= 150ho x= 140ho
10
x= 130ho x= 120ho
8
x= 110ho x= 100ho
6
x= 90ho x= 80ho
4
x= 70ho x= 60h
2
o
x= 50ho 0 0
50
100
150
200
x= 40ho
1/2
t(g/h ) o
Figure 4.18: Time series along the centerline of the channel (y = 0); location of each time series is note along the right border of the figure. Characteristics are shown by the dashed-dotted lines.
Chapter 5 One-Layer Modeling Topics 5.1
Landslide-Generated Waves
In recent years, significant advances have been made in developing mathematical models to describe the entire process of generation, propagation and run-up of a tsunami event (e.g. Yeh et al . 1996; Geist 1998). These models are based primarily on the shallow-water wave equations and are adequate for tsunamis generated by seismic seafloor deformation. Since the duration of the seismic seafloor deformation is very short, the water surface response is almost instantaneous and the initial water surface profile mimics the final seafloor deformation. The typical wavelength of this type of tsunami ranges from 20 km to 100 km. Therefore, frequency dispersion can be ignored in the generation region. The nonlinearity is also usually not important in the generation region, because the initial wave amplitude is relatively small compared to the wavelength and the water depth. However, the frequency dispersion becomes important when a tsunami propagates for a long distance. Nonlinearity could also dominate as a tsunami enters the runup phase. Consequently, a complete model that can describe the entire process of tsunami 102
103 generation, evolution, and runup needs to consider both frequency dispersion and nonlinearity. Tsunamis are also generated by other mechanisms. For example, submarine landslides have been documented as one of possible sources for several destructive tsunamis (Moore & Moore 1984, von Huene et al . 1989, Jiang & LeBlond 1992, Tappin et al . 1999, Keating & McGuire 1999). On November 29, 1975, a landslide was triggered by a 7.2 magnitude earthquake along the southeast coast of Hawaii. A 60 km stretch of Kilauea’s south coast subsided 3.5 m and moved seaward 8 m. This landslide generated a local tsunami with a maximum runup height of 16 m at Keauhou (Cox & Morgan 1977). More recently, the devastating Papua New Guinea tsunami in 1998 is thought to be caused by a submarine landslide (Tappin et al . 1999, Keating & McGuire 1999, Tappin et al . 2001). In terms of tsunami generation mechanisms, two significant differences exist between submarine landslide and coseismic seafloor deformation. First, the duration of a landslide is much longer and is in the order of magnitude of several minutes. Hence the time history of the seafloor movement will affect the characteristics of the generated wave and needs to be included in the model. Secondly, the effective size of the landslide region is usually much smaller than the coseismic seafloor deformation zone. Consequently, the typical wavelength of the tsunamis generated by a submarine landslide is also shorter, i.e., about 1 to 10 km. Therefore, the frequency dispersion could be important in the wave generation region. The existing numerical models based on shallow-water wave equations may not be suitable for modeling the entire process of submarine landslide generated tsunami (e.g., Raney & Butler 1976, Harbitz et al . 1993). In this paper, we shall present a new model describing the generation and
104 propagation of tsunamis by a submarine landslide. In this general model only the assumption of weak frequency dispersion is employed, i.e., the ratio of water depth to wavelength is small or O(µ2o ) ¿ 1. Until the past decade, weakly dispersive models were formulated in terms of a depth-averaged velocity (e.g. Peregrine, 1967). Recent work has clearly demonstrated that modifications to the frequency dispersion terms (Madsen et al ., 1992) or expression of the model equations in terms of an arbitrary-level velocity (Ngowu, 1993; Liu, 1994) can extend the validity of the linear dispersion properties into deeper water. The general guideline for dispersive properties is that the ”extended” versions of the depth-integrated equations are valid for wavelengths greater than two water depths, whereas the depth-averaged model is valid for lengths greater than five water depths (e.g., Nwogu, 1993). Moreover, in the model presented in this paper, the full nonlinear effect is included, i.e., the ratio of wave amplitude to water depth is of order one or εo = O(1). Therefore, this new model is more general than that developed by Liu & Earickson (1983), in which the Boussinesq approximation, i.e., O(µ2o ) = O(εo ) ¿ 1 was used. In the special case where the seafloor is stationary, the new model reduces to the model for fully nonlinear and weakly dispersive waves propagating over a varying water depth (e.g. Liu 1994, Madsen & Sch¨affer 1998). The model is applicable for both the impulsive slide movement and creeping slide movement. In the latter case the time duration for the slide is much longer than the characteristic wave period.
5.1.1
Accuracy Limitation of Numerical Model
This section is organized in the following manner. The general model equations are simplified for special cases. The numerical model is tested using available experimental data (e.g., Hammack 1973) for one-dimensional situations. Employing
105 a Boundary Integral Equation Model, which solves for potential flow in the vertical plane, a deep water limit for waves generated by submarine slides is determined for the depth-integrated model. The importance of nonlinearity and frequency dispersion is inferred through numerical simulation of a large number of different physical setups. Approximate Two-Dimensional Governing Equations Equations (3.3) and (3.4) are the coupled governing equations, written in terms of uα and ζ, for fully nonlinear, weakly dispersive waves generated by a seafloor movement. In this section, this one-layer model will be referred to as FNL-EXT, for fully-nonlinear, ”extended” equations. Creeping ground movements The general derivation of Chapter 2 assumed that the time scale of the seafloor movement is the same order of magnitude as the typical period of generated water √ wave, tw = `0 / gh0 as given in (2.1). When the ground movement is creeping in nature, the time scale of seafloor movement, tc , could be larger than tw . The only scaling parameter that is directly affected by the time scale of the seafloor movement is the characteristic amplitude of the wave motion. After introducing the time scale tc into the time derivatives of h in the continuity equation, (3.3), along with a characteristic change in water depth ∆h, the coefficient in front of ht becomes δ tw εo tc
(5.1)
106 where δ = ∆h/ho . To maintain the conservation of mass, the above parameter must be of order one. Thus, εo = δ
tw δlo = √ tc tc gho
(5.2)
The above relationship can be interpreted in the following way: During the creeping ground movement, over the time period t < tc the generated wave has propagated √ a distance t gho . The total volume of the seafloor displacement, normalized by ho , is δlo ttc , which should be the same as the volume of water underneath the generated √ wave crest, i.e., εo t gho . Therefore, over the ground movement period, t < tc , the wave amplitude can be estimated by (5.2). Consequently, nonlinear effects become important only if ε defined in (5.2) is O(1). Since, by definition of a creeping slide, the value
tc
√lo
gho
is always less than one, fully nonlinear effects will be important
for only the largest slides. The same conclusion was reached by Hammack (1973), using a different approach. The importance of the fully nonlinear effect when modeling creeping ground movements will be tested in a following section. Weakly nonlinear waves In many situations the seafloor displacement is relatively small in comparison with the local depth, and the seafloor movement can be approximated as h(x, y, t) = h0 (x, y) + δh(x, y, t),
(5.3)
in which δ is considered to be small. In other words, the maximum seafloor displacement is much smaller than the characteristic water depth. Since the free surface displacement is directly proportional to the seafloor displacement, i.e. O(εo ζ) = O(δh) or much less than the seafloor displacement in the case of creeping ground movements, we can further simplify the governing equations derived in the
107 previous section by allowing O(εo ) = O(δ) = O(µ2o ) ¿ 1
(5.4)
which is the Boussinesq approximation. Thus, the continuity equation, (3.3) can be reduced to ½
δ ζt + ∇ · (Huα ) + ht − µ2 ∇ · h0 ε µ
·µ
Ã
1 δ − h0 + zα ∇ ∇ · (h0 uα ) + ht 2 ε
1 2 1 2 h − z ∇(∇ · uα ) 6 0 2 α
!#)
= O(µ4 , µ2 ε, δµ2 )
(5.5)
The momentum equation becomes ∂ uαt + εuα · ∇uα + ∇ζ + µ ∂t 2
(
)
1 2 δ zα ∇(∇ · uα ) + zα ∇[∇ · (h0 uα ) + ht ] 2 ε
= O(µ4 , εµ2 , δµ2 )
(5.6)
These model equations will be referred to as WNL-EXT, for weakly-nonlinear, ”extended” equations. The linear version of the above will also be utilized in the following analysis, and will be referred to as L-EXT, for linear, ”extended” equations. It is also possible to express the approximate continuity and momentum equations in terms of a depth-averaged velocity. One version of the depth-averaged equations will be employed in future sections, which is subject to the restraint (5.4), and is given as δ ht = 0 εo ( ) h20 h0 δ 2 ∂ ∇(∇ · u) − ∇[∇ · (h0 u) + ht ] ut + εo u · ∇u + ∇ζ + µo ∂t 2 6 ε ζt + ∇ · (Hu) +
= O(µ4o , εo µ2o , δµ2o )
(5.7)
(5.8)
where the depth-averaged velocity is defined as Z εo ζ 1 u(x, y, t) = u(x, y, z, t) dz h + εo ζ h
(5.9)
108 This set of model equations, (5.7) and (5.8), will be referred to as WNL-DA, for weakly-nonlinear, depth-averaged equations. Nonlinear shallow-water waves In the case that the water depth is very shallow or the wavelength is very long, the governing equations, (3.3) and (3.4), can be truncated at O(µ2 ). These resulting equations are the well-known nonlinear shallow water equations in which the seafloor movement is the forcing term for wave generation. This set of equations will be referred to as NL-SW, for nonlinear, shallow-water equations. Comparisons with Experiment and Other Models As a first check of the present model, a comparison between Hammack’s (1973) experimental data for an impulsive bottom movement in a constant water depth is made. The bottom movement consists of a length, lo = 24.4 water depths, which is pushed vertically upward. The change in depth for this experiment, δ, is 0.1, so nonlinear effects should play a small role near the source region. Figure 5.1 shows a comparison between the numerical results using FNL-EXT, experimental data, and the linear theory presented by Hammack. Both the fully nonlinear model and the linear theory agree well with experiment at the edge of the source region (Figure 5.1a). From Figure 5.1b, a time series taken at 20 water depths from the edge of the source region, the agreement between all data is again quite good, but the deviation between the linear theory and experiment is slowly growing. The purpose of this comparison is to show that the present numerical model accurately predicts the free surface response to a simple seafloor movement. It would seem that if one was interested in just the wave field very near the source, linear theory
109 is adequate. However, as the magnitude of the bed upthrust, δ, becomes large, linear theory is not capable of accurately predicting the free surface response even very near the source region. One such linear vs. nonlinear comparison is shown in Figure 5.1 for δ = 0.6. The motion of the bottom movement is the same as in Hammack’s case above. Immediately on the outskirts of the bottom movement, there are substantial differences between linear and nonlinear theory, as shown in Figure 5.1c. Additionally, as the wave propagates away from the source, errors in linear theory are more evident. A handful of experimental trials and analytic solutions exist for non-impulsive seafloor movements. However, for the previous work that made use of smooth obstacles, such as a semi-circle (e.g., Forbes & Schwartz, 1982) or a semi-ellipse (e.g., Lee et al., 1989), the length of the obstacle is always less than 1.25 water depths, or µ ≥ 0.8. Unfortunately, these objects will create waves too short to be modeled accurately by a depth-integrated model. Watts (1997) performed a set of experiments where he let a triangular block free fall down a planar slope. In all the experiments, the front face (deep water face) of the block was steep, and in some cases vertical. Physically, as the block travels down a slope, water is pushed out horizontally from the vertical front. Numerically, however, using the depth-integrated model, the dominant direction of water motion near the vertical face is vertical. This can be explained as follows. Examining the depth-integrated model equations, starting from the leading order, shallow water wave equations, the only forcing term due to the changing water depth appears in the continuity equation. There is no forcing term in the horizontal momentum equation. Therefore, in the non-dispersive system, any seafloor bottom cannot directly create a horizontal velocity. This concept can be further illuminated by
110 0.08
0.08 a)
0.06
b) 0.06
δ=0.1 x/h=0 ζ/h
0.04
ζ/h
0.04
δ=0.1 x/h=20
0.02
0.02
0
0
−0.02 −10
0
10
20
30
40
50
−0.02 −10
0
t (g/h)0.5 − x/h
δ=0.6 x/h=0
40
50
0
d) δ=0.6 x/h=20
0.4 ζ/h
ζ/h
30
0.6
c)
0.2
−0.2 −10
20
t (g/h)0.5 − x/h
0.6
0.4
10
0.2
0
0
10
20
30
40
50
−0.2 −10
0
t (g/h)0.5 − x/h
10
20
30
40
50
t (g/h)0.5 − x/h
Figure 5.1: Shown in subplots a) and b), a comparison between Hammack’s (1973) experimental data (dots) for an impulsive seafloor upthrust of δ=0.1, FNL-EXT numerical simulation (solid line), and linear theory (dashed line); a) is a time series at x/h=0 and b) is at x/h=20, where x is the distance from the edge of the impulsive movement. Subplots c) and d) show FNL-EXT (solid line) and L-EXT (dashed line) numerical results for Hammack’s setup, except with δ=0.6. the equation describing the vertical profile of horizontal velocity: u(x, y, z, t) = uα (x, y, t) + O(µ2o )
(5.10)
Again, the changing seafloor bottom cannot directly create a horizontal velocity component for the non-dispersive system. All of the seafloor movement, whether
111 it is a vertical or translational motion, is interpreted as strictly a vertical motion, which can lead to a very different generated wave pattern. When adding the weakly dispersive terms, the vertical profile of the horizontal velocity becomes: u(x, y, z, t) = uα (x, y, t)− (
µ2o
"
z 2 − zα2 ht ∇(∇ · uα ) + (z − zα )∇ ∇ · (huα ) + 2 εo
#)
+ O(µ4o )
(5.11)
Now, with the higher-order dispersive formulation, there is the forcing term, ∇ht , which accounts for the effects of a horizontally moving body. Keep in mind, however, that this forcing term is a second-order correction, and therefore should represent only a small correction to the horizontal velocity profile. Thus, with rapid translational motion and/or steep side slopes of a submarine slide, the flow motion is strongly horizontal locally, and the depth-integrated models are not adequate. In slightly different terms, let the slide mass have a characteristic side length, Ls . A side length is defined as the horizontal distance between two points at which ∂h/∂t = 0. This definition of a side length is described graphically in Figure 5.2. Figure 5.2a shows a slide mass that is symmetric around its midpoint in the horizontal direction, where the back (shallow water) and front (deep water) side lengths are equal. Figure 5.2b shows a slide mass whose front side is much shorter that the back. Note that for the slide shown in Fig. 5.2b, the side lengths, measured in the direction parallel to the slope, are equal, whereas for the slide in Fig. 5.2a the slide lengths are equal when measured in the horizontal direction. An irregular slide mass will have least two different side lengths. In these cases, the characteristic side length, Ls , is the shortest of all sides. When Ls is small compared to a characteristic water depth, ho , that side is considered steep, or in deep water, and the shallow-water based depth-integrated model will not be accu-
112
a)
b)
0.2
0.2 −∂ h / ∂ t
−∂ h / ∂ t
0
0 L1
L1
L2 L =L =L
−0.2
L =L to is shown by the dashed line. The negative of the change in water depth (or the approximate free surface response in the non-dispersive equation model) during the increment t − to is shown by the thick line plotted on z=0.1. rate. For the vertical face of Watts’ experiments, Ls = 0, and therefore Ls /ho = 0 and the situation resembles that of an infinitely deep ocean. The next section will attempt to determine a limiting value of Ls /ho where the depth-integrated model begins to fail.
113 Limitations of the Depth-Integrated Model Before utilizing the model for practical applications, the limits of accuracy of the depth-integrated model must be determined. As illustrated above, just as there is a short wave accuracy limit (wave should be at least 2 water depths long when applying the ”extended” model), it is expected that there is also a slide length scale limitation. By comparing the outputs of this model to those of the BIEM model, a limiting value of Ls /ho can be inferred. The high degree of BIEM model accuracy in simulating wave propagation is well documented (e.g. Grilli 1989, Grilli et al. 1994). The comparison cases will use a slide mass travelling down a constant slope. The slide mass moves as a solid body, with velocity described following Watts (1997). This motion is characterized by a decreasing acceleration until a terminal velocity is reached. All of the solid body motion coefficients used in this paper are identical to those employed by Grilli & Watts (1999). Note that all of the submarine landslide simulations presented in this paper are non-breaking. The setup of the slide mass on the slope is shown in Figure 5.3. The time history of the seafloor is described by "
Ã
∆h x − xl (t) h(x, t) = ho (x) − 1 + tanh 2 S
!# "
Ã
x − xr (t) 1 − tanh S
!#
(5.12)
where ∆h is the maximum vertical height of the slide, xl is the location of the tanh inflection point of the left side of the slide, xr is the location of the inflection point on the right side, and S is a shape factor, controlling the steepness of the slide sides. The right and left boundaries, and steepness factor are given by: b xl (t) = xc (t) − cos(θ), 2
b xl (t) = xc (t) + cos(θ), 2
S=
0.5 cos(θ)
where xc is the horizontal location of the center point of the slide, and is determined
114
Figure 5.3: Setup for submarine landslide comparisons. using the equations governing the solid body motion of the slide. The angle of the slope is given by θ. The thickness of the ”slideless” water column, or the baseline water depth, at the centerpoint of the slide is defined by hc (t) = ho (xc (t)) = ∆h + d(t). With a specified depth above the initial center point of the slide mass, do = d(t = 0), the initial horizontal location of the slide center, xc (t = 0), can be found. The length along the slope between xl and xr is defined as b, and all lengths are scaled by b. For the first comparison, a slide with the parameter set: θ=6◦ , do /b=0.2, and ∆h/b=0.05 is modeled with FNL-EXT and BIEM. With these parameters the characteristic horizontal side length of the slide mass, Ls /b, is 1.7. Ls is defined as in Figure 5.2, or specifically, the horizontal distance between two points at
115 which ∂h/∂t is less than 1% of the maximum ∂h/∂t value. Note that a 6◦ slope is roughly 1/10. Figure 5.4 shows four snapshots of the free surface elevation from both models. The lowest panel in the figure shows the initial location of the slide mass, along with the locations corresponding to the four free surface snapshots. Initially, as shown in Figures 5.4a and b, where Ls /hc =6.1 and 4.5 respectively, the two models agree, and thus are still in the range of acceptable accuracy of the depth-integrated model. In Figure 5.4c, as the slide moves into deeper water, where Ls /hc =3.1, the two models begin to diverge over the source region, and by Figure 5.4d, the free surface responses of the two models are quite different. These results indicate that in the vicinity of x/b=5, the depth-integrated model becomes inaccurate. At this location, hc /b=0.5, and Ls /hc =3.4. Numerous additional comparison tests were performed, and all indicated that the depth-integrated model becomes inaccurate when Ls /hc < 3 ∼ 3.5. One more of the comparisons is shown here. Examining a 20◦ slope and a slide mass with a maximum height ∆h/b=0.1, the initial depth of submergence, do /b, will be successively increased from 0.4 to 0.6 to 1.0. The corresponding initial Ls /hc values are 3.4, 2.4, and 1.5, respectively. Time series above the initial centerpoint of the slide masses and vertical shoreline movements are shown in Figure 5.5. The expectation is that the first case (Ls /hc = 3.4 initially) should show good agreement, the middle case (Ls /hc = 2.4 initially) marginal agreement, and the last case (Ls /hc = 1.5 initially) bad agreement. The time series above the center, Figures 5.5a, c, and e, do clearly agree with the stated expectation. Various different zα levels were tested in an attempt to better the agreement with the BIEM model results for the deeper water cases, but zα =-0.531h provided the most accurate output. Rundown, as shown in Figures 5.5b, d, and f, shows good agreement for all the trials. The
116
z/do
0.02 0 −0.02 −0.04 −0.06
s
0 z/do
0.02 0 −0.02 −0.04 −0.06
c
1
2
3
4
5
6
7
b)
Ls/hc=4.5 0
z/do
0.02 0 −0.02 −0.04 −0.06
1
2
3
4
5
6
7
c)
Ls/hc=3.1 0
0.02 0 −0.02 −0.04 −0.06
1
2
3
4
5
6
7
z/do
d) Ls/hc=2.5 0
∆ h/d
a)
L /h =6.1
1
2
3 t=0
0.2
a)
4
5
b)
6 c)
7 d)
0.1 0
0
1
2
3
4 x/b
5
6
7
Figure 5.4: Free surface snapshots for BIEM (solid line) and depth-integrated (dashed line) results at t(g/do )1/2 = a) 10.6, b) 21, c) 31.6, and d) 41. The lower subplot shows the location of the slide mass in each of the above four snapshots. explanation is that the wave that creates the rundown is generated from the backface of the slide mass. This wave sees a characteristic water depth that is less than hc , and thus this backface wave remains in the region of accuracy of the depthintegrated model, whereas the wave motion nearer to the front face of the slide is inaccurate. This feature is also clearly shown in Figure 5.4. Thus, if one was solely interested in the leading wave approaching the shoreline, the characteristic water depth should be interpreted as the average depth along the backface of the
117 0
0
0
−0.005
−0.002 −0.005
−0.01
−0.004
z/do
−0.015 −0.01
−0.02
−0.006
−0.025
−0.008 −0.015
−0.03
−0.01 a) L /h =3.4
−0.035
s
c
0
c) L /h =2.4 s
O
5
10
−0.02
0
e) L /h =1.5
c
s
O
5
10
−0.012
0
0
−0.01
−0.005
−0.002
−0.02
−0.01
−0.004
Vert. Shoreline Movement / do
0
−0.025 d) Ls/hc =2.4
O
0
10
−0.01
b) Ls/hc =3.4
−0.05
5
−0.008
−0.02
−0.04
O
−0.006
−0.015
−0.03
0
c
5
10
−0.03
0
1/2
t(g/do)
5
10 1/2
t(g/do)
f) Ls/hc =1.5
−0.012
O
O
0
5
10 1/2
t(g/do)
Figure 5.5: Time series above the initial centerpoint of the slide (top row) and vertical movement of the shoreline (bottom row) for a 20◦ slope and a slide mass with a maximum height ∆h=0.1. BIEM results are shown by the solid line, depthintegrated results by the dashed line. Subplots a & b are for do /b=0.4, c & d for do /b=0.6, and e & f for do /b=1.0. slide, instead of hc . The inaccurate elevation waves created by the front face of the moving mass could be absorbed numerically, such as with a sponge layer, so that they do not effect the simulation. A guideline that the depth-integrated ”extended” model will yield accurate results for Ls /hc > 3.5 is accepted. This restriction would seem to be more strin-
118 gent than the ”extended” model frequency dispersion limitation, which requires that the free surface wave be at least two water depths long. In fact, the slide length scale limitation is more in line with the dispersion limitations of the depthaveraged (conventional) model. The limitations of the various model formulations, i.e. ”extended” and depth-averaged, are discussed in the next section. Importance of Nonlinearity and Frequency Dispersion Another useful guideline would be to know when nonlinear effects begin to play an important role. This can be determined by running numerous numerical trials, employing the FNL-EXT, WNL-EXT, and L-EXT equation models. These three equation sets share identical linear dispersion properties, but have varying levels of nonlinearity. The linear dispersion limit of these ”extended” equations, for the rigid bottom case, is near kh=3, where k is the wavenumber. Nonlinearity, however, is only faithfully captured to near kh=1.0 for the FNL-EXT model, and to an even lesser value for WNL-EXT (Gobbi et al., 2000). The source-generation accuracy limitation of the model is such that the side length of the landslide over the depth must be greater than 3.5. If the slide is symmetric in the horizontal direction, which is the only type of slide examined in this section, then the wavelength of the generated wave will be 2*3.5*h, or roughly kh=1. Thus up to the accuracy limit found in the previous section, nonlinearity is expected to be well captured. The FNL-EXT model will be considered correct, and any difference in output compared to the other models with lesser nonlinearity would indicate that full nonlinear effects are important. The importance of nonlinearity will be tested through examination of various ∆h/do combinations, using the slide mass described in the previous sec-
119 Table 5.1: Characteristics of the landslide simulations performed to determine the importance of nonlinearity. Set #
Slope (degrees)
hco /b
Ls /hco
1
30
0.55
3.5
2
15
0.55
3.5
3
5
0.55
3.5
4
5
0.15
13
tion. The value of ∆h/do can be thought of as an impulsive nonlinearity, as this value represents the magnitude of the free surface response if the slide motion was entirely vertical and instantaneous. The procedure will be to hold the value hco = hc (t = 0) = ∆h + do constant for a given slope angle, while altering ∆h and do . Two output values will be compared between all the simulations: maximum depression above the initial centerpoint of the slide and maximum rundown. For q
all simulations presented in this section ∆x/b = 0.003 and ∆t ghco /b = 0.0003. Figure 5.6 shows the output from four sets of comparisons, whose characteristics are given in Table 5.1. Figures 5.6a & b show the depression above the centerpoint and the rundown for Set 1, Figures 5.6c & d for Set 2, Figures 5.6e & f for Set 3, and Figures 5.6g & h for Set 4. Examining the maximum depression plots for Sets 1,2, & 3, it is clear that the trends between the three sets are very similar, with FNL-EXT predicting the largest depression, and L-EXT predicting the smallest. The difference between FNL-EXT and WNL-EXT is solely due to nonlinear dispersive terms, which are of O(εo µ2o ), while the difference between WNL-EXT and L-EXT is caused by the nonlinear divergence term in the continuity equation and the convection term in the momentum equation, which are of O(εo ). The relative
120
Max Depression/do
0
0 a)
b) −0.05
Max Rundown/do
−0.05 −0.1
−0.15
Slope=30o, h L /h s
−0.25
−0.15
/b=0.55
c
−0.2 0
c
O
=3.5
−0.1
c
L /h s
O
0.2
0.4
0.6 ∆ h/do
0.8
−0.25
1
0
0
/b=0.55 O
O
0.2
0.4
0.6 ∆ h/do
0.8
1
d)
−0.05
−0.05
−0.1
−0.15
−0.1 Slope=15o, hc /b=0.55 O
Ls/hc =3.5
−0.15
Slope=15o, hc /b=0.55
−0.2
0.2
0.4
O
Ls/hc =3.5
−0.25
O
0
O
0.6 ∆ h/do
0.8
1
0
0
0.2
0.4
0.6 ∆ h/do
0.8
1
0 f)
Max Rundown/do
Max Depression/do
e) −0.05
−0.02
−0.04 Slope=5o, hc /b=0.55 Ls/hc =3.5
−0.06
O
−0.1 Slope=5o, hc /b=0.55 Ls/hc =3.5
−0.15
O
0
0.2
0.4
O
O
0.6 ∆ h/do
0.8
1
0
0
0.2
0.4
0.6 ∆ h/do
0.8
1
0 g)
h)
−0.1
Max Rundown/do
−0.05
Max Depression/do
c
=3.5
0 c)
Max Rundown/do
Max Depression/do
Slope=30o, h
−0.2
−0.1
−0.2
−0.15
−0.3
−0.2
−0.4
Slope=5o, hc /b=0.15
−0.25
Ls/hc =13
−0.3
0.5
Ls/hc =13
−0.6
O
0
Slope=5o, hc /b=0.15
−0.5
O
1 ∆ h/do
1.5
2
O
O
0
0.5
1 ∆ h/do
1.5
2
Figure 5.6: Maximum depression above the initial centerpoint of the slide mass and maximum rundown for four different trial sets. FNL-EXT results indicated by the solid line, WNL-EXT by the dashed line, and L-EXT by the dotted line.
121 differences in the maximum depression predicted between FNL-EXT and WNLEXT are roughly the same as the differences between WNL-EXT and L-EXT for Sets 1,2, & 3. Therefore, in the source region, for Ls /hco values near the accuracy limit of the ”extended” model (near 3.5), the nonlinear dispersive terms are as necessary to include in the model as the leading order nonlinear terms. As the Ls /hc value is increased, the slide produces an increasingly longer (shallow water) wave. Frequency dispersion plays a lesser role, and thus the nonlinear dispersive terms become expectedly less important. This can be seen in the maximum depression plot for Set 4. For this set, Ls /hco = 13, and the FNL-EXT and WNL-EXT results are nearly indistinguishable. Inspecting the maximum rundown plots for Sets 1, 2, & 3, it seems that the trends between the three different models have changed. Now, WNL-EXT predicts the largest rundown, while L-EXT predicts the smallest. It is hypothesized that the documented over-shoaling of WNL-EXT (Wei et al., 1995) cancels out the lesser wave height generated in the source region compared to FNL-EXT, leading to rundown heights that agree well between the two models. As the slope is decreased, the error in the L-EXT rundown prediction increases. This is attributed to a longer distance of shoaling before the wave reaches the shoreline. As the slope is decreased, while hco is kept constant, the horizontal distance from the shoreline to the initial centerpoint of the slide increases. The slide length is roughly the same for the three sets, therefore the generated wavelength is roughly the same. Thus, with a lesser slope the generated wave shoals for a greater number of wave periods. During this relatively larger distance of shoaling, nonlinear effects, and in particular the leading order nonlinear effects, accumulate and yield large errors in the linear (L-EXT) simulations. This trend is also evident in the rundown plot
122 for Set 4. Also note that in Set 4, where the nonlinear dispersive terms are very small, the FNL-EXT and WNL-EXT rundowns are identical. A deep water limit has been determined for the ”extended” model (Ls /hc > 3.5), but it would also be interesting to know the limits of applicability of the depthaveraged (WNL-DA) and shallow water (NL-SW) models. The only differences between these three models (the weakly nonlinear ”extended”, weakly nonlinear depth-averaged, and nonlinear shallow-water) are found in the frequency dispersion terms - the nonlinear terms are the same. The testing method to determine the deep water limits of the various model types will be to fix both a slope of 15◦ and a slide mass, with ∆h/b = 0.05 and Ls /b = 1.85, while incrementally increasing the initial water depth above the centerpoint of the slide, d. Figure 5.7 shows a summary of the comparisons of the three models. Figures 5.7a & d show the maximum free surface depression measured above the initial centerpoint of the slide and the maximum rundown for various Ls /hco combinations. WNL-EXT solutions are indicated by solid lines, WNL-DA by dashed lines, and NL-SW by the dotted lines. Also shown in Figures 5.7b & e are the maximum depression and rundown results from WNL-DA and NL-SW relative to the results from WNLEXT, thereby more clearly depicting the differences between the models. These figures show WNL-EXT and WNL-DA agreeing nearly exactly, while the errors in NL-SW decrease with increasing Ls /hco . The NL-SW results do not converge with the WNL-EXT results until Ls /hco >∼15. Figures 5.7c & f are time series of the free surface elevation above the initial centerpoint of the slide and the vertical movement of the shoreline for the case of Ls /hco =3.5, respectively. Differences between NL-SW and WNL-EXT are clear, with NL-SW under-predicting the free surface above the slide, but over-predicting the rundown due to over shoaling in the
123 non-dispersive model. The only significant difference between the WNL-EXT and WNL-DA results come after the maximum depression in Figure 5.7c, where WNLDA predicts an oscillatory train following the depression. These results indicate that to the deep water limit that WNL-EXT was shown to be accurate, WNLDA is accurate as well. As mentioned previously, altering the level on which zα is evaluated in the ”extended” model does not increase the deep water accuracy limit for slide generated waves. In summary, the nonlinear dispersive terms are important for slides near the deep water limit (Ls /hc = 3.5) whose heights, or ∆h/do values, are large (> 0.4). For shallow water slides (Ls /hc > 10), the nonlinear dispersive terms are not important near the source, even for the largest slides. The ”extended” formulation of the depth-integrated equations does not appear to offer any benefits over the depth-averaged formulation in regards to modeling the generation of waves in deeper water. The ”extended” model would be useful if one was interested in modeling the propagation of shallow-water, slide-generated waves into deeper water, which is not the focus of this paper. The shallow water wave equations are only valid for slides in very shallow water, where Ls /hco >∼15.
5.1.2
Case Study: Papua New Guinea Tsunami of 1998
In July of 1998, a moderate earthquake initiated a slope failure in the form of a slump along the north coast of Papua New Guinea (PNG). The moving slump generated a tsunami that was locally devastating. Over a stretch of about 5 km, near Sissano Lagoon, tsunami heights approached 10 m. Damage was limited to roughly 20 km of coastline. A detailed review of the tsunami event can be found in Synolakis et al. (2002).
124
−3
Max Depression/do
0
0
x 10
a)
−0.05
c)
−0.1 −2
−0.15 Slope=15o ∆ h/b=0.05 L /b=1.85
−0.2
−4
5
10
15
Max Dep/Max Dep WNL−EXT
Ls/hc
z/do
s
−0.25
20
O
−6
b)
1.02 1
Ls/hc =3.5 O
0.98 −8 0.96 0.94 0.92
0 5
10
15 Ls/hc
10
20
30
40
50
time*(g/do)1/2
20
O
0 d) 0.005 −0.1
f)
−0.15
Slope=15o ∆ h/b=0.05 L /b=1.85
−0.2
Max Rundown/Max Rundown WNL−EXT
0
s
5
Shoreline Movement/do
Max Rundown/do
−0.05
−0.005
10
15
20
L /h s
c
O
1.3 e)
1.25
−0.01
−0.015
1.2 1.15
−0.02
1.1
Ls/hc =3.5 O
1.05 −0.025
1 5
10
15 Ls/hc
O
20
0
10
20
30
40
50
time*(g/do)1/2
Figure 5.7: Maximum depression above the initial centerpoint of the slide mass a) and maximum rundown d) for a set of numerical simulations on a 15◦ slope. Shown in b) and e) are the maximum depression and maximum rundown scaled by the corresponding values from the WNL-EXT model. Time series comparisons for Ls /hco = 3.5 showing the free surface elevation above the centerpoint c) and vertical shoreline movement f) are given on the right. WNL-EXT results indicated by the solid line, WNL-DA by the dashed line, and NL-SW by the dotted line.
125 The tsunami generated by this slump is not the typical tsunami that has been modeled for decades using the NL-SW equations. These equations are accurate for large scale tsunamis, such as those that impact the entire pacific rim, whose wavelength is very large compared to the ocean depth. Local tsunamis, such as at PNG, have wavelengths that are still large compared to the water depth, on the order of 10 times the depth. For waves of this length, the NL-SW equations have large, leading order errors. Therefore, it is suspect to use NL-SW models to draw conclusions about local tsunami events. On the other hand, the Boussinesq (one-layer) equations are well-known to be accurate for waves of this length. In this section, two of the reported initial conditions for the PNG event, used previously in NL-SW models, will be employed in both NL-SW and FNL-EXT (one-layer) simulations. These ”hot start” initial conditions are meant to yield a reasonable facsimile of the free surface disturbance caused by the slump. Thus, the actual movement of the slump is not being recreated here, a very simplified approach has been taken. The initial free surface condition, with zero velocity, is placed above the slump region and evolves after the numerical simulation is started. These initial conditions are based on a number of observations of the post-slump seafloor profile, as well as assumptions of the failure motion (Synolakis et al. 2002). Figures 5.8 and 5.9, taken from Borrero (2001), depict two of the initial conditions employed in the literature.
The initial condition in Fig. 5.8,
called in this thesis the short-fat initial condition, represents the initial condition founded on recent observations of the offshore slump. This condition can then be thought of as more up-to-date than the long-narrow initial condition shown in Fig. 5.9, which had been developed before offshore studies of the slump area had been undertaken. It must be noted that there is a large degree of uncertainty
126
Figure 5.8: The short-fat initial condition (SFIC) for the Papua New Guinea event. The island is located on the bottom of the figure; Sissano Lagoon is shown. (taken from Borrero, 2001)
127
Figure 5.9: The long-narrow initial condition (LNIC) for the Papua New Guinea event. The island is located on the bottom of the figure; Sissano Lagoon is shown. (taken from Borrero, 2001)
128 in even the short-fat initial condition, as these initial conditions are attempting to approximate a dynamic situation (tsunami generation and seafloor movement occuring simultaneously) with a static, ”hot start” initial condition. It is, however, difficult to quantify this error, as little can be inferred of the exact motion of the slump. For simplicity, the short-fat initial condition will be referred to as SFIC, and the long-narrow initial condition as LNIC. Before looking at the numerical output, the expectation of the importance of frequency dispersion effects can be roughly inferred. For both initial conditions, the wavelength is on the order of 10 km in a water depth of about 1.5 km. From linear analysis, it should be expected that initially this wave will behave as an intermediate water depth wave, not a shallow water depth, or long, wave. For reference, the ratio of the wave speed of a 10 km wave to the wave speed of a long wave in 1.5 km of water is 0.9. Thus, initially, frequency dispersion will play an important role. However, as the wave propagates into shallower water, frequency dispersion effects become increasingly minor. The question to be answered is: Will the dispersion effects near the source, in the deeper water, play a significant enough role to alter the waveform in the shallow water? In an attempt to resolve this question, for each of the two initial conditions, simulations were run using both the FNL-EXT (including weak frequency dispersion effects) and NL-SW (non-dispersive) models. First, we examine the LNIC. Figure 5.10 shows a summary of the numerical results. In the top row of the figure, snapshots of the free surface are taken from both simulations at a time of 3 minutes after the hot start. Both images show a leading depression wave traveling towards the spit, while a leading elevation wave is encroaching upon the shore to the west of the spit. Differences between the two
129 are obvious, with the FNL-EXT simulation exhibiting a well defined secondary depression wave moving towards the spit. Also, the wave predicted by NL-SW at this time has a larger height than that predicted by FNL-EXT. The middle plot in the figure shows the difference in the predicted maximum free surface elevation between the models, where positive values indicate the NL-SW predicted a larger free surface elevation at that point. In the deeper water, near the source, there is virtually no difference between the models. As the wave approaches the spit, the scenario changes, and NL-SW predicts a much larger wave, nearly 10 m higher. Interestingly, there is a sharp contrast between the large difference between the models and a much smaller difference as the wave travels shoreward. This contrast is attributed to wave breaking, and in fact, this contrast occurs in the same region where breaking is initiated in both the models. The nearshore cancellation of the large differences in the models just seaward of the breaking line is a strong indication that breaking in this area is depth-limited. The lower plot in the figure shows the maximum free surface elevation predicted over dry land, including over the inundated spit. Also plotted are the recorded field data. The FNL-EXT and NL-SW predict very similar flooding patterns, although there exist local differences on the order of 40%, particularly east of latitude 142.15. It may be possible that east of this latitude, breaking is not governed by depth, whereas seaward of the spit, breaking is depth-limited. Numerical results for the second initial condition, SFIC, are shown in Figure 5.11. All of the conclusions stated in the above paragraph, for LNIC, are directly applicable to initial condition SPIC as well. Some differences do exist however. Examining the middle plot in Figure 5.11, we see that the region of largest difference between the NL-SW and FNL-EXT models is shifted to the east, as compared to
130
Figure 5.10: Dispersion effects with the long-narrow initial condition. The top plots (in the top row) show the instantaneous free surface elevation predicted by the NL-SW and FNL-EXT models. The middle plot shows the difference in maximum free surface elevation between the models. Positive values indicate that the shallow water model predicts a higher free surface at that location. The lower plot compares the predicted inland water elevations with field data.
131 the same plot in Figure 5.10. This is due to the fact that with SFIC, wave energy is focused slightly more to the east than with LNIC, and where the largest waves are located will also be the location of the largest difference between the NL-SW and FNL-EXT models. The numerical results using SFIC appear to give a better agreement than LNIC with the field data for water elevation over dry land. Thus far, only the spatial differences due to dispersive effects have been examined. It would likewise be interesting to look at the time-dependent aspects, such as differences in tsunami arrival time, and number of crests. To do this, time series of the numerical free surface elevation are recorded at three different locations. The three locations are located near the shoreline, and the given in Figure 5.12. The time series comparisons at these three locations are shown in Figure 5.13 for the SFIC. Clearly, FNL-EXT and NL-SW predict very different waveforms. In all of the plots in Fig. 5.13, the FNL-EXT model gives a first crest arrival time roughly 30 seconds later than the NL-SW model. This time corresponds to the arrival time of the second trough in the NL-SW results. The number of distinct wave crests contained in the waveform is the same with both models. While it is immediately evident that frequency dispersion has a leading order impact on the wave form, it is equally clear that this impact would be difficult to extract from eyewitness accounts. An eyewitness arrival time record with a accuracy to seconds would be a tough find, especially in the PNG area. It would seem that for the PNG case, in the region of primary interest (near the lagoon), frequency dispersion effects are unimportant to the prediction of runup and inundation. This is not because dispersion effects are unimportant offshore, it is only because of what appears to be depth-limited breaking negating a large difference in offshore wave height. While use of NL-SW might lead to good runup
132
Figure 5.11: Dispersion effects with the short-fat initial condition. The top plots (in the top row) show the instantaneous free surface elevation predicted by the NL-SW and FNL-EXT models. The middle plot shows the difference in maximum free surface elevation between the models. Positive values indicate that the shallow water model predicts a higher free surface at that location. The lower plot compares the predicted inland water elevations with field data.
133
(3) (2)
(1)
Figure 5.12: Locations of the PNG time series comparisons. Depth contours are every 100 m.
134
Free surfave elevation at Location #1 20 15
Z (m)
10 5 0 −5 300
350
400
450
500
550
600
650
550
600
650
550
600
650
Free surfave elevation at Location #2 20 15
Z (m)
10 5 0 −5 300
350
400
450
500
Free surfave elevation at Location #3 20 15
Z (m)
10 5 0 −5 300
350
400
450
500 Time (s)
Figure 5.13: PNG time series comparisons of the free surface for the three locations shown in Figure 5.12, for the SFIC. FNL-EXT results are given by the solid line, NL-SW by the dashed line.
135 prediction, other properties of the tsunami, such as arrival time, show larger errors. It should be noted, however, that the large uncertainty associated with the tsunami generation dynamics in the source region represents an error much larger than that due to neglect of frequency dispersion. Sensitivity of Predicted PNG Runup to Initial Condition In the previous section, two initial conditions, LNIC and SFIC, were discussed. In this section, the relation between these two initial conditions will be more closely scrutinized, along with a third initial condition. This third initial condition, meant to be close to the simplest reduction to the complex hot start problem, is a single sine wave fit with a Gaussian distribution in the transverse direction. The sine wave has a length of 10 km and a width of 5 km. The sine wave initial condition, or SineIC, is centered at the same location as the other two initial conditions. Figure 5.14 shows a number of snapshots of the free surface for all three initial conditions. In the first column are the numerical results, using FNL-EXT, with SFIC, the second column with LNIC, and the third column SineIC. The first row are the initial conditions, at time=0. The second row, at time=1 minute, shows the three initial conditions spreading out radially. At time=3 minutes, shown in the third row, it is clear how the different initial conditions each produce very different offshore wave heights and different number of waves. In the last row, at time=7 minutes, breaking has initiated in all of the simulations, creating similar wave heights offshore of the lagoon for all three initial conditions, but still different number of waves. A summary of the numerical results from the three initial conditions is given in Figure 5.15. In the top row are shown the maximum free surface elevations
136
Figure 5.14: The evolution in time of three different initial conditions. In the first column are the results from the short-fat initial condition, the middle column the long-narrow initial condition, and the last column the sine-wave initial condition. The first row is for the initial time, the second row for t=1 min, the third for t=3 min, and the fourth for t=7 min.
137 predicted by the three initial conditions. SFIC gives the largest maximum free surface elevation, and also predicts the highest flooding of dry land, as shown by the lower plot. LNIC and SineIC are in close agreement overall. Let us now examine the maximum predicted free surface elevation averaged over the spit (roughly 142.09 to 142.2 degrees). Over this distance, the SFIC predicts heights in the range of 10 meters. The LNIC and the SineIC predict nearly the exact inundation patterns, with an average height near 6 meters. It is interesting to note that despite the large difference in shape between LNIC and SineIC, the predicted runups are in good agreement. One possible explanation for this agreement is that the potential energy of the initial condition is the dominant factor in predicting runup for this case, whereas the shape and orientation will play secondary roles. The initial potential energy, or the potential energy of the ”hot start” condition, is given by:
PE =
Z LZ W 0
o
|ζ(x, y, t = 0)| dx dy
(5.13)
where L and W are the domain widths in the y and x directions. The following ratios are calculated: P E(LN IC) P E(SineIC) = = 0.58 P E(SF IC) P E(SF IC)
(5.14)
Note that the maximum depression of SineIC was chosen so that its initial potential energy was equal to that of LNIC. Not coincidentally, the ratios of initial potential energy are very close to the ratios of maximum inundation heights over the spit (6m/10m). Thus, it would seem that the finer detail of the initial condition plays a small role in maximum runup for the PNG case. However, these details will play a significant role in prediction of wave arrival time, the maximum runup away from the spit, and the number of distinct waves hitting the coastline.
138
Figure 5.15: Comparisons from the three different initial conditions. The top row shows the maximum ocean surface predicted by the different initial conditions, and the bottom plot comparisons the inland free surface elevations.
139
5.1.3
Case Study: Landslide Tsunami Hazard near Puerto Rico
Modeling A Submarine Slump As a case study to apply this model, a prehistoric, massive submarine slump off the Northern coast of Puerto Rico is investigated. According to Grindlay (1998), the slump was approximately 57 km wide, occurring on a steep slope (roughly 1/10) with a length of about 40 km; the top of the failure slope is at a depth of 3000 meters, the bottom at 7000 meters. The catastrophic failure is estimated to involve over 900 km3 of soil. With this information and the evidence of a circular slip, the maximum decrease in water depth along the slope is estimated at 700 m. Assuming solid body motion of the mass and using the estimated soil density given by Grindlay, the duration of the movement is calculated to be on the order of 10 minutes. To implement any bottom movement in the model, the evolution of the motion must be completely known beforehand. There are different slide mechanisms, which of course will determine the free surface response. In the previous sections, a solid mass slid down a slope. In this section, a rotational slump is examined. This type of seafloor movement is most likely the type that occurred off the coast of Puerto Rico, where there is a large circular cut-out of a steep slope (Grindlay 1998). A depth transformation function that approximates this motion is a sinewave addition. In this approach, a sine wave, whose amplitude is a function of time and wavelength is a constant in time, is added to the initial water depth. In order to numerically model a two horizontal dimension slump, the transverse motion is described with a Gaussian distribution of the centerline profile. The time history
140 of the seafloor for the rotational slump is given by ·
x − xc h(x, y, t) = ho (x, y) + a(t) G(y) sin 2π lo
¸
for −
lo lo ≤ x − xc ≤ 2 2
(9.1)
where ´
³
a(t) = ∆h 1 − e−πt/tc , 2
G(y) = e−(y−yc )
/ro2
,
∆h is the maximum change in depth due to the slump, xc is x-coordinate of the mid-point of the slump, yc is the y-coordinate, and ro is the half-width of the slump. Figure 5.16 shows the evolution of ground movements. The nonlinearity parameter (3.4) for this failure is: l h 700m 60000m q √o = = 0.048 tc gh h0 600s 9.81m/s2 6000m 6000m Thus, nonlinear effects are weak over the source region, but of primary interest will be wave heights in shallow water near the coast. Assuming a characteristic failure side length of half the slump length and a characteristic depth as the depth at the midpoint of the slump, the side length parameter is Ls 30000m = = 5.0 ho 6000 and this submarine mass movement is near the deep water limit of FNL-EXT. Numerical Results The first numerical simulation presented is for a one-horizontal dimension (1D) problem. At the top of the slope the water depth is 3000 m, at the bottom it is 7000 m. The slope in the failure region is 1/10. This failure slope is connected to the shallow water by a milder slope of 1/50, and the depth is constant in the
141
−3000
−3500
−4000
z (m)
−4500
−5000
−5500
−6000
−6500
−7000
0
10
20
30 x (km)
40
50
60
Figure 5.16: Submarine slump modeled using a sine wave transformation, where the solid line is the initial water depth, the dashed line at t = tc /12, the dasheddotted line at t = tc /3, and the dotted line at t = tc .
142 deep water. The maximum change in water depth during the slide, ∆h, is 700 m, and the slump period, tc , is 10 minutes. The numerical results using FNL-EXT are given as Figure 5.17. In Figure 5.17a, the slump is 2 minutes old, and very large waves have been created. A large negative wave is created over the region of the slump where the depth increases, and vice-versa. Almost halfway through the slump period, Figure 5.17b, the waves have begun to propagate away from the slide region. In Figures 5.17c and 5.17d, the wave propagating into the shallow water region begins to shorten and amplify, and nonlinear effects begin to become important. In this last subplot, the predicted free surface using L-EXT is also shown, indicating the importance of leading order nonlinearity. Up to the time shown in this figure, there is no difference between FNL-EXT and WNL-EXT simulation results. However, as the wave continues to travel towards the shoreline, the FNL-EXT and WNL-EXT models begin to deviate for a short time before breaking initiates. Figure 5.17 and other numerical tests seem to indicate that the leading, and largest amplitude waves are only a function of the initial seafloor motion. A simple physical argument can provide an explanation. Focusing on the slump in Figure 5.17, the average depth in the region is 5000 m, and the linear long wave speed, c, is 220 m/s. The horizontal slump side length, Ls , is 30 km, and so the time required for a wave (disturbance) to travel across the half the slump region, Ls /c, is about 2 minutes. Therefore, after about 2 minutes of seafloor motion, the leading waves should be exiting the source region. Examination of Figure 5.17a supports this value, as the leading waves are separating and moving from the failure slope 2 minutes after the slump start. The argument can be further solidified by examining the effects of slumps with different durations. If the arrival times of
Z (m)
143
200
200
150
150
100
100
50
50
0
0
−50
−50
−100
−100
−150
−150 0
100
200
a), t=2 min
Z (m)
0
0
−2000
−4000
−4000
−6000
−6000
Z (m)
100
200
300
200
200
150
150
100
100
50
50
0
0
−50
−50
−100
−100
−150
−150 0
100
200
300
c), t=8 min
0
−2000
−4000
−4000
−6000
−6000 100
200 X (km)
300
200
300
b), t=4 min
0
100
200
300
0
50
100
150
d), t=12 min
0
−2000
0
100
0
−2000
0
Z (m)
300
0
100
200 X (km)
300
Figure 5.17: 1D simulation of a submarine slump using FNL-EXT. Numerical free surface results from L-EXT are also shown by the dotted line for the last time.
144
150 100
ζ (m)
50 0 −50 −100 −150 −200 100
120
140
160
180
200 X (km)
220
240
260
280
300
Figure 5.18: Effect of slump duration, comparing free surface response due to slumps of the same geometry, but different periods, for tc =20 min (—), tc =10 min (– –), tc =5 min(– ·). Profiles are taken 5 minutes after the start of the movement. the leading waves for slumps with different durations are the same, that would indicate that the waves have exited the source region at the same time, and the seafloor movement after about 2 minutes will not affect the leading waves. Figure 5.18 shows free surface snapshots for slumps of identical geometry, but different durations of motion (tc values). All the slumps have identical arrival times, but very different amplitudes as each of the leading waves experiences a different twominute water depth change. Thus, it is shown that for an accurate modeling of the leading waves created by a slump, one only needs to correctly model the first Ls /c seconds of the motion. This statement is limited to small amplitude waves, where the nonlinear phase speed correction is minor. Looking back to Figure 5.17, it is clear that when the waves reach the shoreline, they will be of extremely large amplitude. Realistically, the tsunami created from this event would not be as large, due to spreading effects. To demonstrate this, a two dimensional numerical simulation is performed, with a slide width of 57 km (ro =28.5 km). Numerical profiles are shown in Figure 5.19.
Initially, the wave
145
Figure 5.19: 2D free surface response to a submarine slump. amplitude is still large, with a maximum depression and elevation of nearly 100 m about 2 minutes after the slide start (Figure 5.19a). Some of this wave energy spreads, and by the time the slide is over, Figure 5.19d, the leading depression traveling towards the shoreline has an amplitude of less than 70 m, followed by an elevation wave of about 100 m. Comparison of spatial profiles with the 1D results gives an estimate of the importance of 2D effects. The comparisons are given as Figure 5.20.
The 2D
profiles given in the figure are the centerline free surface displacements.
The
two sets of numerical simulations have very similar waveforms, but the 1D results are larger in amplitude, especially the leading depression traveling into shallower
146
a) t=2 min
100
100
50
50
0
−50
−100
−100
−150
−150 100
200 X (km)
300
0
c) t=8 min
150 100
100
50
50
0
−50
−100
−100
−150
−150 100
200 X (km)
300
200 X (km)
300
d) t=12 min
0
−50
0
100
150
Z (m)
Z (m)
0
−50
0
b) t=6 min
150
Z (m)
Z (m)
150
0
100
200 X (km)
300
Figure 5.20: Comparison between 1D (—) and 2D centerline (– –) spatial profiles. water. Naturally, the width of the slide (2ro ) directly effects the importance of twodimensional spreading. Figure 5.21, a plot of the maximum depression recorded at the top of the slide slope (x=150 km in Figure 5.17) as a function of slide width, shows this relationship. The trend very closely resembles an exponential decay, where for an aspect ratio of unity, the maximum depression along the centerline for a 2D simulation is roughly 80% of the corresponding value from a 1D result. Clearly, the 1D model can give highly conservative results, depending on the aspect ratio of the failure region. With the real bathymetry of the north coast of Puerto Rico, simulations are performed to estimate the tsunami runup along the island’s shorelines. The bathymetry
147
|Max Depression|/ ∆ h
0.2
0.15
0.1
0.05
0
0
0.5
1
1.5 2 Slide Width/Slide Length
2.5
3
Figure 5.21: Dependence of the maximum depression generated at the top of the failure slope on the aspect ratio of the slump region. The dashed line represents the maximum depression predicted by a 1D simulation. was provided by Dr. Mercado at the University of Puerto Rico at Mayaguez (1998). The one-laer model was used to simulate a number of landslides with different durations, which were presented, along with runup in Mercado et al (2001). One of the results is presented here, that for a landslide duration of 15 minutes. A number of snapshots of the free surface from the numerical results are shown in Figure 5.22. After 3 minutes, a large depression wave has been created along the top of the failure slope, measuring about 35 m in wave amplitude. Also, an elevation wave of height 18 m has formed above the deep water region, where the depth is decreasing. Roughly 8 minutes after the initiation of the slide, the leading depression wave has reached the north coast of Puerto Rico, where it has shoaled to a depression of 45 m. This wave is actually an N -wave, with a trailing elevation wave roughly 8 m. After the depression wave reflects off the island, the trailing positive elevation wave generates extremely large runup heights along the coast. The greatest free surface elevations, nearly 70 m, are reached about 15 minutes after the submarine slide motion initiates. The positive elevation wave continues
148 to flood the coast more than 25 minutes after the slide start. In fact, at this time, the tsunami is just beginning to impact the populous eastern half of the north coast of the island. Figure 5.23 shows a closeup of the maximum recorded free surface elevation very near the coast of Puerto Rico. The initial shoreline is noted on the plot, and the land that remains dry for the entire duration of the tsunami event is shown by the solid white coloring. This plot shows maximum elevations near 70 m. The largest free surface elevations are localized near the western half of the island (from around around Y =110 km to Y =190 km). The effects of the tsunami are focused on the northern coast of Puerto Rico. The maximum free surface elevations on the western side of the island (near Y =200 km) are relatively small, only reaching single digits values. The finger-like intrusions of runup (at Y =150 km and Y =130 km) are actually the tsunami traveling up river channels. Inundation distance in this vicinity is on the order of 5 km. Also note that along the eastern half of the island, the maximum elevation is not that great (5-10 m), but the inundation distance is also large. This is due to the fact that this area is a gradually sloping coastal plain, with land elevations only a few meters above sea level.
149
Figure 5.22: Plan-view snapshots of the waves generated by a submarine slump. The subplot in the upper left shows the water depth profile. The island of Puerto Rico is located on the bottom of each subplot.
150
Figure 5.23: The maximum free surface elevation recorded near the coast of Puerto Rico.
Chapter 6 Two-Layer Modeling Topics 6.1
Highly Nonlinear Solitary Waves
As a first numerical application of the two-layer model, the properties of a very large amplitude solitary wave are analyzed. The solitary wave represents a balance of nonlinear and dispersive effects, thereby creating a wave of permanent form. When the amplitude of a solitary wave is small, the characteristic length of the wave is relatively large, and weakly nonlinear, weakly dispersive theories can describe the soliton very well (e.g. Wei & Kirby, 1995). However, as the amplitude increases, the wavelength shortens, and therefore higher-order nonlinear and dispersive effects become more important. This phenomenon is discussed in detail in Gobbi et al. (2000), where it was shown that models with nonlinear accuracy into the deepwater regime are required to accurately simulate highly nonlinear solitary waves. One of the examples presented in their paper will be investigated again here, with the two-layer model results included. As an initial condition for the numerical model, the solitary wave solution of Wei & Kirby (1995), which is derived from the weakly nonlinear, one-layer 151
152 model, is inputted into the domain. As this wave solution is not the solitary wave solution of the two-layer model, when the numerical simulation is started, the soliton ”sheds” some waves, as a tail. The soliton, which moves rapidly due to its large amplitude, eventually leaves this tail far behind and reaches a steady form. Due to this initial fluctuation in wave form, the amplitude of the initial condition is chosen based on trial-and-error until a solitary wave with the desired amplitude is generated. This initial transient state is also mentioned in Gobbi et al. (2000). For the solitary wave examined in this section, with an amplitude=0.65h, roughly 100 water depths of propagation were needed to separate the solitary wave from its trailing tail. Additionally for this simulation, a grid length, ∆x, of 0.04h and a √ Courant number, ∆x/(∆t gh), where ∆t is the time step, of 0.5 were employed. The wave breaking and bottom friction dissipation modules were turned off. The numerical solitary wave of the two-layer model will be compared with the numerical waveform of the one-layer model, the high-order model of Gobbi et al. (2000), and the exact solution to the full boundary value problem presented by Tanaka (1986). Figure 6.1 compares the free surface profiles of the four different solutions. The two-layer model matches the exact solution to a very high accuracy, although there is some small error for x/h > 2, which is difficult to discern in the figure. The twolayer model shows the best agreement with the exact solution as compared to the one-layer model and the high-order model of Gobbi et al. (2000). In Figure 6.2, the vertical profiles of horizontal velocity under the wave crest for the various models are shown. Near the seafloor, the two-layer model exhibits the best agreement with the exact solution, although the difference between the two-layer model and Gobbi et al.’s high-order model is small. Moving towards the free surface, these two models converge in their predictions, showing equal errors in the maximum
153 0.7
0.6
0.5
ζ/h
0.4
0.3
0.2
0.1
0
0
0.5
1
1.5 x/h
2
2.5
3
Figure 6.1: Shape of solitary wave with amplitude ζ/h=0.65. The exact solution is given by the dashed line, the two-layer model by the solid line, Gobbi et al. (2000) high-order model by the dots, and the one-layer model by the dash-dotted line. horizontal velocity. It is clear from these comparisons that the two-layer model captures to a highly accurate degree the physics of a nonlinear solitary wave, with agreement on par or slightly better than that found with the model of Gobbi et al. (2000).
154
0.6
0.4
0.2
z/h
0
−0.2
−0.4
−0.6
−0.8
−1
0.4
0.45
0.5
0.55
0.6
0.65
0.7
0.75
u/(gh)0.5
Figure 6.2: Vertical profile of horizontal velocity under the crest of a solitary wave with amplitude ζ/h=0.65. The exact solution is given by the dashed line, the twolayer model by the solid line, Gobbi et al. (2000) high-order model by the dots, and the one-layer model by the dash-dotted line.
155
6.2
Wave Propagation over a Submerged Bar
In this section, wave interaction with a submerged bar is examined. The setup is taken from the experiments presented by Dingemans (1994), who recorded free surface time series at numerous locations in front of and behind the obstacle. The orientation of the bar is shown in the top subplot of Figure 6.3. The wave, as it approaches the bar, is truly a long wave, with a kh=0.7 (wavelength of 7.7 m in 0.86 m of water). This incident wave corresponds to Case A in Dingemans (1994). As the wave shoals, it steepens and nonlinear transfers create superharmonics. The superharmonics, while still shallow or intermediate water waves on top of the bar, become deep water waves as they enter the deeper water behind. As discussed in Woo & Liu (2001), significant wave energy (about 75% of the peak spectral amplitude) is present at kh ≈ 4 in the region behind the bar. For this reason, Boussinesq-type models (one-layer O(µ2o ) models), whose linear dispersion accuracy limit is near kh ≈ 3, do not correctly predict the wave field behind the bar. The numerical simulation results for this case are shown in Figure 6.3. Time series are taken at the four locations depicted in the top subplot, and both the one- and two-layer models are compared with experimental data. The column on the left shows the one-layer results, the column on the right, the two-layer. On top of the bar, at location #1, both models are in agreement, and the twolayer model shows no benefit. This is expected, as all of the dominant wave components at this location have kh values less than 2.0. However as the wave components progress into deeper water, the one-layer model becomes inaccurate. This is evident at locations #2-#4, where the one-layer model deviates from the experimental results. The two-layer model, on the other hand, shows its strength
156
0.2
#1
#2
#3
#4
z (m)
0 −0.2 −0.4 −0.6 −0.8 0
5
10
15
20
z (m)
z (m)
z (m)
z (m)
One−Layer Model 0.06 0.04 0.02 0 −0.02 −0.04 13 0.06 0.04 0.02 0 −0.02 −0.04 13 0.06 0.04 0.02 0 −0.02 −0.04 13 0.06 0.04 0.02 0 −0.02 −0.04 13
15
16
16
0.06 0.04 0.02 0 −0.02 −0.04 13
16
0.06 0.04 0.02 0 −0.02 −0.04 13
16
0.06 0.04 0.02 0 −0.02 −0.04 13
#2
14
15 #3
14
15 #4
14
15 t/T
30
0.06 0.04 0.02 0 −0.02 −0.04 13
#1
14
25 x (m)
35
40
45
50
Two−Layer Model #1
14
15
16 #2
14
15
16 #3
14
15
16 #4
14
15
16
t/T
Figure 6.3: Comparison between numerical (solid lines) and experimental (dots) free surface displacements for Case A of Dingemans (1994), where the experimental setup and gauge locations are shown in the top subplot. The column on the left shows the numerical results from the one-layer model, the right column shows the two-layer results. Time series locations are indicated in the upper right of each subplot, corresponding to the gauge locations shown in the top subplot.
157 and predicts the wave field excellently. A second case was presented in Dingemans (1994), that for a shorter incident wave traveling over the same submerged bar as discussed above. This experimental data set, named Case C in Dingemans (1994), employs an intermediate depth wave with a kh=1.8 (wavelength of 3.0 m in 0.86 m of water). As the wave passes over the top of the bar, energy is transferred into the second harmonic, with only a small amount of energy in the third harmonic behind the step. The second harmonic has a kh=6.3 in the 80 cm water depth behind the step, and certainly it is not expected that the one-layer should correctly predict the wave field in this region. Figure 6.4 proves this expectation, while the two-layer model captures the free surface extremely well. This particular case also exhibits the strength of the two-layer model over high-order Boussinesq-type models with dispersion properties equivalent to a [4,4] Pade approximation of the dispersion relation. For the kh=6.3 component behind the step, the [4,4] Pade predicts a celerity about 1% faster than that given by linear potential theory. Between locations #3 and #4 in Fig. 6.4, this kh=6.3 wave will have traveled more than 5 wavelengths, equating to a minor arrival time error in the vicinity of 5%. These phase errors are evident in the numerical results given by Gobbi and Kirby (1999), who compared a high-order model ([4,4] Pade representation of the dispersion relation) with experimental data very similar to that given in Dingemans (1994) and compared here. As the twolayer model presented in this paper has a 0.05% celerity error at kh=6.3, there are no noticeable phase differences in Figure 6.4.
158
0.2
#1
#2
#3
#4
z (m)
0 −0.2 −0.4 −0.6 −0.8 0
5
10
15
20
One−Layer Model
25 x (m)
0.1
30
35
40
45
Two−Layer Model 0.1 #1
z (m)
z (m)
#1 0.05 0 −0.05 30
31
32
0.05 0 −0.05 30
33
0.1
31
32 #2
z (m)
z (m)
#2 0 31
32
0.05 0 −0.05 30
33
0.1
31
32 #3
z (m)
z (m)
#3 0 31
32
0.05 0 −0.05 30
33
0.1
31
32 #4
0.05
z (m)
z (m)
33
0.1 #4
0 −0.05 30
33
0.1
0.05
−0.05 30
33
0.1
0.05
−0.05 30
50
31
32 t/T
33
0.05 0 −0.05 30
31
32
33
t/T
Figure 6.4: Comparison for Case C of Dingemans (1994), where the figure notation is as in Fig. 6.3.
159
6.3
Wave Generation by Submarine Landslide
The derivation presented in this paper did not make the simplifying assumption of a constant seafloor elevation in time. This will allow for the study of waves generated by seafloor movements, such as submarine landslides and slumps. Using the onelayer model equations to study wave creation by submarine seafloor movements has been examined previously in section 5.1.1. In that section, a deep water accuracy limitation, in regard to accurate prediction of the generated waves, of the one-layer model was determined. Focusing on a submarine slide mass that is symmetric about its centerpoint in the horizontal plane, a single length scale of the slide mass can be given, ls , the horizontal length of the slide. For the one-layer model, accuracy is expected as long as ls /hc > 7, where hc is the water depth above the centerpoint of the slide mass. This accuracy limitation was found through comparison of the one-layer model with a fully nonlinear potential flow calculation. One of the comparisons presented in section 5.1.1, specifically, ”Limitations of the Depth-Integrated Model”, is re-examined here with the present two-layer model. The scenario to be recreated in this section involves a non-deforming mass translating down a planar slope in solid body motion. The mathematical description of the slide evolution can be found in section 5.1.1 (see Figure 5.3), and will not be repeated here. This particular problem, already simulated using potential flow theory and a one-layer model, is calculated again with the two-layer equations, and the results are shown in Figure 6.5. The top subplot of this figure shows the location of the slide mass at four different times, which correspond to the free surface snapshots shown in the lower four subplots. Given on each of these four plots is the ls /hc ratio at the time the snapshot is taken. Note that ls is constant in time, but as the slide moves into deeper water, hc increases. For the times t1 and
160 t2 , all three models agree, and the depth-integrated models are still in the range of accuracy. As can be seen by time t3 , the one-layer model begins to diverge from the potential flow results, indicating that the slide is in water too deep for this model to handle accurately. At this time, the two-layer model is still in excellent agreement with potential theory. By time t4 , the two-layer model is beginning to differ from potential theory. Although the rigorous determination of the accuracy limit for the one-layer model done in section 5.1.1 will not be repeated here for the two-layer model, it is clear that the two-layer model gives accurate results into deeper water than the one-layer model does.
6.4
Deep Water Wave Group Propagation
Deformation of wave groups is inherently a strongly nonlinear process. In intermediate and deep water, the nonlinear energy transfer into the so-called side bands can be an O(1) effect, depending on the closeness of the wave components. Looking at a bichromatic wave group, with two frequencies ω1 and ω2 , the side bands are the 2ω1 − ω2 and 2ω2 − ω1 frequencies, which arise from second-order nonlinear interactions. These side bands have been studied extensively since Benjamin and Feir (1967) noted that a nonlinear water wave group is unstable to perturbations of its envelope. Side-band instability is a nonlinear, deep-water occurrence, and to this date, the only models capable of simulating the phenomenon are those accurate only for deep water waves (i.e. the nonlinear Schrodinger equation) and the full boundary equations (i.e nonlinear potential theory). Depth-integrated models are ill-suited to simulate deep water wave groups, due to the fact that typically deep water nonlinearity is poorly recreated. The one-layer model has good first-
161
t
z (m)
−0.2
1
t
2
−0.4
t3
−0.6
t4
−0.8
z (m)
z (m)
z (m)
z (m)
1 0.02 0 −0.02 −0.04 −0.06 −0.08
t
0.02 0 −0.02 −0.04 −0.06 −0.08
t2
0.02 0 −0.02 −0.04 −0.06 −0.08
t3
0.02 0 −0.02 −0.04 −0.06 −0.08
t4
2
3
4
5
6
7
8
9
10
2
3
4
5
6
7
8
9
10
2
3
4
5
6
7
8
9
10
2
3
4
5
6
7
8
9
10
2
3
4
6
7
8
9
10
1
ls/hc=12.2 1
ls/hc=9.0 1
ls/hc=6.2 1
ls/hc=5.0 1
5 x (m)
Figure 6.5: Numerical simulation of a submarine landslide. Top plot shows the location of the slide mass at the four times corresponding to the free surface snapshots in the four lower plots. Free surface snapshots for potential flow theory (dots), one-layer model (dashed line), and two-layer model (solid line) are given.
162 order nonlinear properties to a kh ≈ 1 (Gobbi et al, 2000), while second-order nonlinear accuracy is reasonable only at the shallow water limit of kh ≈ 0. While second-order nonlinear properties of the two-layer model are not examined in this thesis, it has been shown in Chapter 3 that first-order nonlinearity is captured up to kh ≈ 5. Therefore, the two-layer model may be capable of simulating certain deep water wave group features. Stansberg (1993) presented a number of deep water wave experiments, including regular, bichromatic, and irregular wave trials. The experiments were performed in a 270 m in length wave channel at MARINTEK, Norway. The channel is 10 m deep for the initial 80 m of length, and 5 m deep elsewhere. The two depths are connected with a vertical step. The two-layer model will be compared with the experimental run ”00060”. This run employed a bichromatic wave group composed of waves with periods = 1.9 and 2.1 seconds, or equivalently kh = 5.5 and 4.6 in the 5 m depth water (kh = 11 and 9.1 in the 10 m depth water). Each component had an amplitude of 0.16 m. Time series were recorded at 9.3, 40, 80, 120, 160, and 200 m from the wavemaker. An initial obstacle to overcome is the vertical step found in the experimental channel bottom profile. While the generated waves are clearly deep water waves and will not ”feel” this vertical step, the step represents a discontinuity of water depth. The numerical model will have severe problems at this location due to extremely large (infinite) value of the bottom slope. Additionally, in the 10 m deep water the kh values of the generated waves are too large to be accurately simulated with the two-layer model. To remove these issues, the numerical wave channel has a constant water depth of 5 m everywhere. This numerical alteration of the physical problem should lead to only minor discrepancies, as the wave components, whether
163 they are in the 5 or 10 m depth, are very deep water waves and neither can feel the channel bottom. The linear wave speed of the 2.1 s component in 5 m of water is 3.2797 m/s, while in 10 m it is 3.2804 m/s, or roughly a 0.005% difference. The two-layer model has 0.01% wave speed error at kh=4.5 (the kh of the 2.1 second wave in 5 m of water) compared to linear theory. The numerical simplification of the channel profile is not the largest error of the numerical simulation, and should not have a noticeable effect on the comparisons. Another, somewhat unexpected, obstacle to an accurate numerical simulation of longterm wave groups is a very precise determination of the periods comprising the wave group. As mentioned above, the reported wave periods are 1.9 and 2.1 seconds. One of the experimental recording stations was very close to the wavemaker, 9.3 m from it. At this proximity, one can expect that nonlinear effects have not perturbed the wave group, and linear theory is still applicable at this close range. A comparison with experiment and linear theory, with periods equal to 1.900 and 2.100 seconds, is given in Figure 6.6a). As can be seen, linear theory and experiment match up very well at early times, but as we move to later times, by ≈ 200 seconds, linear theory and experiment show large differences. If the assumption that linear theory is valid at this point in the experiment, this plot is a clear indication that the wave periods used in the linear theory are not what was truly utilized in the experiment. In fact, if the wave period of 1.9 seconds is changed to 1.904 seconds in the linear theory, the profiles match up excellently, as shown in Figure 6.6b). This altered period of 1.904 seconds is taken from a FFT of the experimental data. The longer period remains 2.1 seconds. The sensitivity of the wave group modulation to a precise determination of the wave periods is an extremely important point that must be taken into consideration for
164
a)
0.2 0.15
Free Surface (m)
0.1 0.05 0 −0.05 −0.1 −0.15 −0.2
50
100
150 Time (s)
200
250
b)
0.2 0.15
Free Surface (m)
0.1 0.05 0 −0.05 −0.1 −0.15 −0.2
50
100
150 Time (s)
200
250
Figure 6.6: Deep water wave group comparisons 9.3 m from wavemaker, where the solid lines are the linear theory, and the dots are the MARINTEK experimental data. Linear theory in the top plot is for wave periods of 1.9 and 2.1 seconds, while the lower plot is for wave periods of 1.904 and 2.1 seconds.
165 both experimental and numerical analysis. The purpose of such studies is usually to examine the effects of a nonlinear perturbation on the wave group. Clearly, a small error in the wave period calculation is a perturbation in its own right, and one that can have large effects in time. For the numerical simulations to be performed here, periods of 1.904 and 2.1 seconds are used, as well as wave amplitudes of 0.078 m for each component. The amplitudes are also taken from the FFT of the experimental time series at 9.3 m from the wavemaker, and differ slightly from the target amplitude of 0.08 m. Figures 6.7-6.12 show the experimental-numerical comparisons at the 6 experimental measurement locations.
In each of these figures, the top subplot shows
the time series comparison of the free surface displacement, the middle and bottom subplots give the results of FFT’s on both numerics and experiments, where the middle plot looks at the main frequency components and the bottom the high frequency components. As a reminder, ω1 =1/2.1s=0.476 Hz and ω2 =1/1.904s=0.525 Hz. Closest to the wavemaker, in Fig. 6.7, numerics and experiment match up very well. Note that although the model appears to be predicting the high frequency components well, this is not expected. These components have kh values well out of the range of the two-layer model, for example the 1 Hz components has a kh ≈ 10. These high frequency components will have very large phase errors in the two-layer model. This point becomes increasingly important when we look at the comparisons further downstream, where the sidebands quickly grow. While the individual side bands have kh values in the realm of accuracy of the two-layer model, they are generated through the interaction of the primary components, ω1 and ω2 , with the secondary (high frequency) components. If the physics of the high frequency components is not being captured by the two-layer model, which
166 Time Series Comparison at x=9.3 m 0.3
Free Surface (m)
0.2 0.1 0 −0.1 −0.2 200
Amplitude (m)
0.08
205
210
2ω1−ω2
215
ω1
220
225 230 Time (s) Main Frequency Components
ω2
2ω2−ω1
235
240
3ω2−2ω1
4ω2−3ω1
0.6 0.65 Frequency (Hz) High Frequency Components
0.7
245
250
5ω2−4ω1
0.06 0.04 0.02 0 0.4
0.45
0.5
0.55
0.75
0.8
0.012
Amplitude (m)
0.01
4ω1−2ω2
3ω1−ω2
2ω1
ω1+ω2
2ω2
3ω2−ω1
4ω2−2ω1
0.008 0.006 0.004 0.002 0 0.8
0.85
0.9
0.95
1 Frequency (Hz)
1.05
1.1
1.15
1.2
Figure 6.7: Deep water wave group comparisons 9.3 m from wavemaker, where the solid lines are the numerical results, and the dashed line in the top subplot and the stars in the lower two subplots are the MARINTEK data. The top plot shows free surface, the middle plot shows spectral amplitudes for the primary components, and the bottom plot gives amplitudes for the higher frequency components. The ∗’s represent the experimental spectrum in the lower two plots. The thin dashed vertical lines in the bottom two plots indicate expected locations of spectral peaks, where the ω combinations are shown to the right of the lines.
167
Time Series Comparison at x=40 m 0.3
Free Surface (m)
0.2 0.1 0 −0.1 −0.2 200
Amplitude (m)
0.08
205
210
2ω1−ω2
215
ω1
220
225 230 Time (s) Main Frequency Components
ω2
2ω2−ω1
235
240
245
3ω2−2ω1
4ω2−3ω1
5ω2−4ω1
0.6 0.65 Frequency (Hz) High Frequency Components
0.7
0.75
250
0.06 0.04 0.02 0 0.4
0.45
0.5
0.55
0.8
0.012
Amplitude (m)
0.01
4ω1−2ω2
3ω1−ω2
2ω1
ω1+ω2
2ω2
3ω2−ω1
4ω2−2ω1
0.008 0.006 0.004 0.002 0 0.8
0.85
0.9
0.95
1 Frequency (Hz)
1.05
1.1
1.15
1.2
Figure 6.8: Deep water wave group comparisons 40 m from wavemaker, where the solid lines are the numerical results, and the dashed line in the top subplot and the stars in the lower two subplots are the MARINTEK experimental data. Figure setup is the same as with Fig. 6.7.
168
Time Series Comparison at x=80 m 0.3
Free Surface (m)
0.2 0.1 0 −0.1 −0.2 200
Amplitude (m)
0.08
205
210
2ω1−ω2
215
ω1
220
225 230 Time (s) Main Frequency Components
ω2
2ω2−ω1
235
240
245
3ω2−2ω1
4ω2−3ω1
5ω2−4ω1
0.6 0.65 Frequency (Hz) High Frequency Components
0.7
0.75
250
0.06 0.04 0.02 0 0.4
0.45
0.5
0.55
0.8
0.012
Amplitude (m)
0.01
4ω1−2ω2
3ω1−ω2
2ω1
ω1+ω2
2ω2
3ω2−ω1
4ω2−2ω1
0.008 0.006 0.004 0.002 0 0.8
0.85
0.9
0.95
1 Frequency (Hz)
1.05
1.1
1.15
1.2
Figure 6.9: Deep water wave group comparisons 80 m from wavemaker, where the solid lines are the numerical results, and the dashed line in the top subplot and the stars in the lower two subplots are the MARINTEK experimental data. Figure setup is the same as with Fig. 6.7.
169
Time Series Comparison at x=120 m 0.3
Free Surface (m)
0.2 0.1 0 −0.1 −0.2 200
Amplitude (m)
0.08
205
210
2ω1−ω2
215
ω1
220
225 230 Time (s) Main Frequency Components
ω2
2ω2−ω1
235
240
245
3ω2−2ω1
4ω2−3ω1
5ω2−4ω1
0.6 0.65 Frequency (Hz) High Frequency Components
0.7
0.75
250
0.06 0.04 0.02 0 0.4
0.45
0.5
0.55
0.8
0.012
Amplitude (m)
0.01
4ω1−2ω2
3ω1−ω2
ω1+ω2
2ω1
2ω2
3ω2−ω1
4ω2−2ω1
0.008 0.006 0.004 0.002 0 0.8
0.85
0.9
0.95
1 Frequency (Hz)
1.05
1.1
1.15
1.2
Figure 6.10: Deep water wave group comparisons 120 m from wavemaker, where the solid lines are the numerical results, and the dashed line in the top subplot and the stars in the lower two subplots are the MARINTEK experimental data. Figure setup is the same as with Fig. 6.7.
170
Time Series Comparison at x=160 m 0.3
Free Surface (m)
0.2 0.1 0 −0.1 −0.2 200
Amplitude (m)
0.08
205
210
2ω1−ω2
215
ω1
220
225 230 Time (s) Main Frequency Components
ω2
2ω2−ω1
235
240
245
3ω2−2ω1
4ω2−3ω1
5ω2−4ω1
0.6 0.65 Frequency (Hz) High Frequency Components
0.7
0.75
250
0.06 0.04 0.02 0 0.4
0.45
0.5
0.55
0.8
0.012
Amplitude (m)
0.01
4ω1−2ω2
3ω1−ω2
ω1+ω2
2ω1
2ω2
3ω2−ω1
4ω2−2ω1
0.008 0.006 0.004 0.002 0 0.8
0.85
0.9
0.95
1 Frequency (Hz)
1.05
1.1
1.15
1.2
Figure 6.11: Deep water wave group comparisons 160 m from wavemaker, where the solid lines are the numerical results, and the dashed line in the top subplot and the stars in the lower two subplots are the MARINTEK experimental data. Figure setup is the same as with Fig. 6.7.
171
Time Series Comparison at x=200 m 0.3
Free Surface (m)
0.2 0.1 0 −0.1 −0.2 200
Amplitude (m)
0.08
205
210
2ω1−ω2
215
ω1
220
225 230 Time (s) Main Frequency Components
ω2
2ω2−ω1
235
240
245
3ω2−2ω1
4ω2−3ω1
5ω2−4ω1
0.6 0.65 Frequency (Hz) High Frequency Components
0.7
0.75
250
0.06 0.04 0.02 0 0.4
0.45
0.5
0.55
0.8
0.012
Amplitude (m)
0.01
4ω1−2ω2
3ω1−ω2
ω1+ω2
2ω1
2ω2
3ω2−ω1
4ω2−2ω1
0.008 0.006 0.004 0.002 0 0.8
0.85
0.9
0.95
1 Frequency (Hz)
1.05
1.1
1.15
1.2
Figure 6.12: Deep water wave group comparisons 200 m from wavemaker, where the solid lines are the numerical results, and the dashed line in the top subplot and the stars in the lower two subplots are the MARINTEK experimental data. Figure setup is the same as with Fig. 6.7.
172 they are not, it is unfair to expect the model to reproduce correctly the children of the high frequency waves, the side bands. Therefore, the only model that will properly recreate these experiments of Stansberg is one that has good linear and nonlinear accuracy to kh ≈ 12. The three-layer model will likely have these traits, and will be applied to this problem in the near future.
6.5
2HD Wave Evolution over a Shoal
One of the most frequently studied 2HD problems is that of wave interaction with a submerged elliptic shoal. Experiments by Berkoff et al. (1982), Vincent & Briggs (1989), and others have been used repeatedly to validate mild-slope equations models (e.g. Liu et al., 1985) as well as Boussinesq-type models (e.g. Chen et al., 2000). The submerged shoal is a particularly desirable 2HD validation problem because the wave field behind the shoal can vary greatly in both the along-channel and cross-channel directions, indicating the 2HD effects are very important. In this paper, one of the experiments of Vincent & Briggs (1989) will be numerically simulated. The elliptic shoal is 6.1 m long in the x direction and 7.92 m wide in the y direction, with a maximum height of 30.5 cm in 45.7 cm of water. The precise mathematical description of the shoal can be found in Vincent & Briggs. A large variety of incident wave conditions were studied, ranging from non-breaking monochromatic waves to breaking directional spectra. A non-breaking monochromatic incident condition is examined in this paper. The incident wave has a height of 4.8 cm and a period of 1.3 s (kh=1.27). The incident wave height was chosen based on agreement with experimental data taken nearest to the wavemaker, which varied significantly from the experimental target wave height of 5.5 cm. A snap-
173
Figure 6.13: Numerical snapshot from a two-layer, 2HD shoal simulation, where the location of the shoal is denoted by the dashed contours. The snapshot is taken 32 s into the simulation, or roughly 24.6 wave periods. shot of the quasi-steady state free surface, taken 32 s into the simulation, is shown in Figure 6.13. From this image, the processes of wave transformation can be explained. The waves approach from the left, and in passing over the shoal, the wave front slows in the shallower water, and the wave crest narrows and steepens. On the lee of the shoal, refracting wave fronts meet, creating a free surface elevation maximum. Oblique wave interactions dominate the wave field behind the shoal, creating an irregular sea surface. Both one- and two-layer simulations were performed, and shown in Figure 6.14 is the difference in the free surface elevation predicted by the models at time=32 s.
174 This instantaneous difference shows that the wave fields predicted by the models behind the shoal do not agree particularly well. Differences in the models are in the range of ∓1.25 cm, in an area where the wave has an amplitude of 4-5 cm. As in the one-horizontal dimension problem of section 4.2, it is expected that the higher frequency waves generated due to nonlinear transfers on the shoal are not accurately predicted by the one-layer model behind the shoal. Figure 6.15 proves this expectation. First, however, given in Fig. 6.15b) is the experimental significant wave height along the centerline of the channel (y=0) plotted with the one- and two-layer values. The trends of the experimental and numerical data are very similar, with small but clear differences between the one- and two-layer models behind the shoal. Figs. 6.15c) and 6.15d) are the first and second harmonic amplitudes, respectively, from the one- and two-layer simulations. The two models agree closely on first harmonic amplitudes, but do exhibit 0.25 cm differences behind the shoal. Figs 6.15c) shows very clearly the focusing of wave energy behind the shoal. The refracting wave fronts meet and create a peak height near x=10 m, after which the wave energy spreads laterally, decreasing the first harmonic amplitude. Looking at the second harmonic amplitudes, the results of the two models diverge quickly behind the shoal. In the deep water behind the shoal, this second harmonic has a kh=4.35, and therefore the one-layer model will not be able to properly capture the physical properties of this wave component. This fact also explains the differences shown in Fig. 6.14, where the errors in the one-layer model are directly attributable to the incorrect phase speed prediction of the second harmonic. Therefore for this type of problem, the accuracy of the one-layer model correlates directly to the magnitude of energy transfer into the second harmonic. The two-layer model will
175
Figure 6.14: Difference between one- and two-layer numerical simulations at time=32 s. The location of the shoal is denoted by the dashed contours.
176
10
a)
z (cm)
0 −10 −20 −30 −40 2
4
6
8
10
12
14
16
6
8
10
12
14
16
6
8
10
12
14
16
6
8
10
12
14
16
12
8
H
sig
(cm)
b) Significant Wave Height 10
6 4
2
4
6
Amplitude (cm)
c) First Harmonic 5 4 3 2
2
4
Amplitude (cm)
1.5 d) Second Harmonic 1
0.5
0
2
4
x (m)
Figure 6.15: Characteristics of the elliptic shoal case, along the channel centerline (y=0). The centerline depth profile is given in a). Shown in b) is the significant wave height of the Vincent and Briggs (1989) experiments (dotted-dashed line, where dots represent measurement locations), one-layer model results (dashed line), and two-layer model (solid line). In c) and d) are the first and second harmonic amplitudes, respectively, for the one- and two-layer models.
177 capture the second harmonic properly, although if energy transfer into the third harmonic (kh=9.8 in the water behind the shoal) is significant, even this model will have errors. The amplitude of the third harmonic for the case analyzed above is less than 0.2 cm in the region behind the shoal.
Chapter 7 Conclusions A multi-layer model for the transformation of highly nonlinear and dispersive waves is derived. The model utilizes N quadratic polynomials to approximate the vertical profile of the horizontal flow field, matched along layer interfaces. The profile of the vertical velocity is made up of N linear segments, also matched at the interfaces. The resulting set of model equations consists of one continuity equation, for solving the free surface displacement, one vector momentum equation, for solving the upper layer characteristic velocity, and N -1 ”matching” vector equations to solve for the characteristic velocities in the lower layers. Through linear and nonlinear optimization of the interface and velocity evaluation locations, it is shown that the two-layer model exhibits accurate linear characteristics up to a kh ≈ 8 and nonlinear accuracy to kh ≈ 6. This is a greater than two-fold extension to higher kh over existing O(µ2o ) Boussinesq-type (onelayer) models, while maintaining the maximum order of spatial differentiation at three. Three- and four-layer models are also examined, although in lesser detail than the two-layer model. Optimizing the phase and group velocity of these two models, it is given that the three-layer model is accurate kh ≈ 15 and the four178
179 layer to kh ≈ 20, both only in the linear sense. Additionally, the vertical velocity profiles match with linear theory very well up to these limits. Owing to this maximum order of differentiation at three of any N -layer model, a tractable numerical algorithm is developed for the general 2HD problem, employing a well-studied predictor-corrector scheme. Wave breaking and bottom friction are included in the one-layer model, in an attempt to develop a practical engineering tool. The breaking model is heavily adopted from Kennedy et al. (2000), with some minor changes, and is validated with experimental data sets. A moving boundary algorithm is developed for use with the derived depth-integrated equations . Used here in conjunction with a fixed grid finite difference scheme for the one-layer model, the moving boundary algorithm could also be employed by a finite element scheme. Founded around the restrictions of the high-order numerical wave propagation model, the moving boundary scheme employs linear extrapolation of free surface and velocity through the wet-dry boundary, into the dry region. The linear extrapolation is simple to implement and can be straightforwardly incorporated into a numerical model. The technique is numerically stable, does not require any sort of additional dissipative mechanisms or filtering, and conserves mass. The moving boundary is tested for accuracy in conjunction with the one-layer model using one and two dimensional analytical solutions and experimental data sets. Nonbreaking and breaking solitary wave runup is accurately predicted, yielding a validation of both the eddy viscosity breaking parameterization and the runup model. For strongly breaking waves, the proper numerical estimation of bottom friction is shown to be important. Two dimensional wave runup in a parabolic basin and around a conical island is investigated, and comparisons with published
180 data show excellent agreement. The one-layer model is employed in the study of landslide generated waves. Rarely will fully nonlinear effects be important above the landslide region, but the model has the advantage of allowing the slide-generated waves to become fully nonlinear in nature, without requiring a transition among governing equations. The numerical generation of waves by both impulsive and creeping movements agrees with experimental data and other numerical models. A deep-water accuracy limit of the model is adopted. Within this limitation, the ”extended” formulation of the depth-integrated equations shows no benefit over the ”conventional”, depthaveraged approach near the source region. Leading order nonlinear effects were shown to be important for prediction of shoreline movement, and the fully nonlinear terms are important for only the thickest slides with relatively short length scales. Two case studies of modeling landslide generated tsunamis with the one-layer model are presented. The effect of frequency dispersion on the Papua New Guinea tsunami is quantified. If one were to use the Nonlinear Shallow Water Wave (NLSW) equations, which are non-dispersive, for simulating this event, errors in the form of arrival time and number of wave crests attacking the shoreline will exist. The NL-SW equations and the one-layer model do, however, agree closely on the maximum runup due to the tsunami. It needs to be noted that uncertainty of the slide dynamics, and hence the waves generated by it, may overshadow any error associated with not including frequency dispersion effects in a numerical simulation. Along the north coast of Puerto Rico, there is evidence of a prehistoric, massive submarine slope failure (Grindlay, 1997), as well as hints that one might occur again. The one-layer model is used to recreate this ancient slide, in order to get
181 an understanding of what might occur if a similar submarine landslide were to occur today. Using a simplified model of slump evolution, the one-layer model predicts huge wave heights (≈ 50m) along the coastline nearest to the slide, with the tsunami impacting the beach just 15 minutes after slope failure. Clearly, such an event would be an enormous disaster, and more needs to be learned of the slide possibilities in this region. As a final remark regarding landslide-tsunami modeling, it is noted that prediction of landslide tsunamis in real cases is subject to the large uncertainty inherent in knowing the time-evolution of a landslide. Extensive field research of high-risk sites is paramount to reducing this uncertainty. In the last chapter of this thesis, the two-layer model is applied to a number of 1HD and 2HD topics, and the presented model shows its strength by capturing the propagation of nonlinear and deep-water waves to a higher degree of accuracy than the one-layer model. Also, through simulation of deep water wave groups, an accuracy limitation of the two-layer model is realized.
Chapter 8 Future Work There are a number of extensions to the multi-layer model concept that the author will likely pursue in the near future. Of paramount importance to making the twolayer model a practical tool is the inclusion of a wave breaking model. While an adoption of the simple breaking scheme presented in section 4.2.2 by the twolayer model is straightforward, a more sophisticated model could be employed. The breaking model in section 4.2.2 is tuned to be accurate for the experimental comparisons, but it is known that the tuned coefficients required by the model may change value depending on the irregularly of the beach (Kennedy et al. 2000). Therefore, it is prudent to not trust the breaking model in any real world simulation where the breaking location cannot be tuned before hand. This uncertainty in the tuned coefficients arises primarily from the fact that the model is so simplistic. The first approach the author will take is a depth-integration of the κ − ² turbulence model, which has been used successfully in Navier-Stokes equation models (e.g. Lin et al., 1999). This approach was mentioned in the thesis work of Lin (1998), along with potential pitfalls, and this author will continue this line of research. It is possible that for certain situations, the two-layer model would not be 182
183 adequate in regard to simulating a correct picture of the wave field. As shown in the deep water wave group comparisons in section 6.4, the two-layer model is not up to task. Another example would be for the 2HD shoal problem discussed in section 6.5. If the incident wave had a greater amplitude, perhaps even breaking, the third harmonic amplitude (kh =9.8 behind the shoal) would be significant, and the two-layer model inaccurate. For these situations, a numerical model of the three- or four- layer equations should be sufficient. The numerical approach for these increased layer-number models is identical to that in section 4.1. Numerical models for the three- and four-layer equation sets will be developed. Concerning landslide generated tsunamis, one facet of this topic that has not yet received a great deal of attention is the tsunamis due to aerial and sub-aerial landslides. The most probable reason for this is the complexity involved in modeling a coupled situation of wave generation/ground movement/runup at the shoreline. Preliminary simulations have indicated that the moving boundary scheme of section 4.3, in conjunction with the derived equations that allow the seafloor to move in time, can accurately simulate the waves generated by sub-aerial slides. A parametric numerical study, including 2HD slides, will be performed. The N -layer, same fluid derivation given in Chapter 2 can be modified to accommodate an N -layer, N -fluid system. The primary difference with the N -fluid system is computational; whereas the N -layer, same fluid system has one continuity equation, one (vector) momentum equations, and N -1 ”matching” (vector) equations, the N -fluid system would have N continuity and N (vector) momentum equations. The N -fluid system will be more CPU intensive, however, it will be capable of simulating a new class of problems. Internal waves, or waves traveling along density interfaces in lakes and oceans, could be approximated. Sediment
184 transport, with a layer near the seafloor representing a high concentration of sand, could also be modeled with a variation of the N -fluid equations.
Appendix A Coefficients of Three-Layer Dispersion Relation The dispersion relation for the three-layer model takes the form: h
w2 =
(3)
(3)
(3)
k 2 gh 1 + (kh)2 N1 + (kh)4 N2 + (kh)6 N3 (3)
(3)
i
(3)
1 + (kh)2 D1 + (kh)4 D2 + (kh)6 D3
(A.1)
The coefficients N (3) and D(3) are tedious functions of the evaluations levels. The expressions for the coefficients will be presented directly as FORTRAN code, attached on the following page. When coding in FORTRAN, the evaluation levels are described by κ1 = ah,
η1 = bh,
κ2 = ch,
η2 = dh,
κ3 = eh
(A.2)
where a, b, c, d, and e are free parameters between -1 and 0. This is different from (3.53), but has the one-to-one correspondence: α1 = a,
α2 = b,
α3 = c,
α4 = d,
α5 = e (3)
(A.3)
The coefficients are given on the following page, where N1 is expressed simply as n1. The same is done for the other coefficients. 185
186
Appendix B Coefficients of Four-Layer Dispersion Relation The dispersion relation for the four-layer model takes the form: h
w2 =
(4)
(4)
(4)
(4)
k 2 gh 1 + (kh)2 N1 + (kh)4 N2 + (kh)6 N3 + (kh)8 N4 (4)
(4)
(4)
i
(4)
1 + (kh)2 D1 + (kh)4 D2 + (kh)6 D3 + (kh)8 D4
(B.1)
The coefficients N (4) and D(4) are tedious functions of the evaluations levels. The expressions for the coefficients will be presented directly as FORTRAN code, attached on the following page. When coding in FORTRAN, the evaluation levels are described by κ1 = ah, η1 = bh, κ2 = ch, η2 = dh, κ3 = eh, η3 = f h, κ4 = gh
(B.2)
where a, b, c, d, e, f and g are free parameters between -1 and 0. This is different from (3.67), but has the one-to-one correspondence: α1 = a, α2 = b, α3 = c, α4 = d, α5 = e, α6 = f, α7 = g (4)
(B.3)
The coefficients are given on the following page, where N1 is expressed simply as n1. The same is done for the other coefficients. 187
188
189
190
191
192
193
194
Bibliography [1] Agnon, Y., Madsen, P. A., and Schaffer, H. 1999 A new approach to high order Boussinesq models. J. Fluid Mech. 399, 319-333. [2] Balzano, A. 1998 Evaluation of methods for numerical simulation of wetting and drying in shallow water flow models. Coast. Engng., 34, 83-107. [3] Benjamin, T. B., and Feir, J. 1967 The disintegration of wave trains on deep water. Journal of Fluid Mechanics, 27, 417-430. [4] Berkoff, J. C. W., Booy, N., and Radder, A. C. 1982 Verification of numerical wave propagation models for simple harmonic linear water waves. Coast. Engng. 6(3), 255-279. [5] Borrero, J. C. 2001 Changing field data gives better model results: An example from Papua New Guinea. in Proceedings of International Tsunami Sympsium 2001, 397-405. [6] Briggs, M. J., Synolakis, C. E., and Harkins, G. S. 1994. Tsunami runup on a conical island. Proc., Waves-Physical and Numerical Modeling, 446455. [7] Carrier, G. F., and Greenspan, H. P. 1958 Water waves of finite amplitude on a sloping beach. Journal of Fluid Mechanics, 4, 97-109. [8] Chen, Q., Dalrymple, R. A., Kirby, J. T., Kennedy, A. and Haller, M. C. 1999 Boussinesq modeling of a rip current system. Journal of Geophysical Research, 104 , 617 - 637. [9] Chen, Q., Kirby, J. T., Dalrymple, R. A., Kennedy, A. B., and Chawla, A. 2000 Boussinesq modeling of wave transformation, breaking, and runup. Part I: 2D. Journal of Waterway, Port, Coastal and Ocean Engng. 126(1), 57-62. [10] Chen, Q., Kirby, J. T., Dalrymple, R. A., Shi, F. and Thornton, E. B. 2002 Boussinesq modeling of longshore currents. Submitted to Journal of Geophysical Research 195
196 [11] Chen, Y., and Liu, P. L.-F. 1995 Modified Boussinesq Equations and Associated Parabolic Model for Water Wave Propagation. J. Fluid Mech., 228, 351–381. [12] Cho, Y.-S. 1995 Numerical simulations of tsunami propagation and run-up, Ph. D. Thesis, Cornell University. 264 pgs. [13] Cox, D. C. and Morgan, J 1977 Local Tsunamis and Possible Local Tsunamis in Hawaii, Hawaii Institute of Geophysics, University of Hawaii, Report HIG 77-14. [14] Dingemans, M. 1994 Comparison of computations with Boussinesq-like models and laboratory measurements. Mast-G8M note, H1684, Delft Hydraulics 32 pp. [15] Forbes, L. K., and Schwartz, L. W. 1982 Free-Surface Flow over a Semicircular Obstruction. J. Fluid Mech. 114, 299-314 [16] Geist, E. L 1998 Local Tsunami and Earthquake Source Parameters Advances in Geophysics, 39, 117-209. [17] Gobbi, M. F. and Kirby, J. T. 1999 Wave evolution over submerged sills: Tests of a high-order Boussinesq model Coast. Engng. 37, 57-96. [18] Gobbi, M. F., Kirby, J. T., and Wei, G. 2000 A fully nonlinear Boussinesq model for surface waves. Part II. Extension to O(kh)4 ) . J. Fluid Mech. 405, 182-210. [19] Gopalakrishnan, T. C. 1989 A moving boundary circulation model for regions with large tidal flats., International Journal for Numerical Methods in Engineering , 28, 245-260. [20] Grilli, S.T 1993. Modeling of nonlinear wave motion in shallow water. Chapter 3 in Computational Methods for Free and Moving Boundary Problems in Heat and Fluid Flows (eds. I.C. Wrobel and C.A. Brebbia), pps. 37-65, Computational Mechanics Publication, Elsevier Applied Sciences, London, UK. [21] Grilli, S.T, Skourup, J., and Svendsen, I.A 1989 An Efficient Boundary Element Method for Nonlinear Waves Engng. Analysis with Boundary Elements , 6, 97-107. [22] Grilli, S.T, Subramanya, R., Svendsen, I.A., and Veeramony, J. 1995 Shoaling of Solitary Waves on Plane Beaches. Journal of Waterway, Port, Coastal and Ocean Engng., 120, 74-92. [23] Grilli, S.T, and Watts, P 1999 Modeling of Waves Generated by a Moving Submerged Body. Applications to Underwater Landslides Engng. Analysis with Boundary Elements , 23, 645-656.
197 [24] Grindlay, N. 1998 Volume and Density Approximations of Material Involved in a Debris Avalanche on the South Slope of the Puerto Rico Tench, Puerto Rico Civil Defense Report. [25] Harbitz, C. B., Pedersen, G., and Gjevik, B 1993 Numerical Simulation of Large Water Waves due to Landslides, J. Hydraulic Engineering 119, 1325-1342. [26] Hammack, H. L. 1973 A Note on Tsunamis: Their Generation and Propagation in an Ocean of Uniform Depth. J. Fluid Mech. 60, 769-799. [27] Hsiao, S.-C. 2000 Permeable effects on nonlinear water waves. Ph. D. Thesis, Cornell University [28] Hsiao, S.-C. and Liu, P. L.-F. 2002 Permeable effects on nonlinear water waves. Royal Society of London A in press. [29] Jiang, L., Ren, X., Wang, K.-H., and Jin, K.-R 1996 Generalized Boussinesq Model for Periodic Non-Linear Shallow-Water Waves. Ocean Engng., 23, 309-323. [30] Jiang, L. and LeBlond, P. H. 1992 The Coupling of a Submarine Slide and the Surface Waves Which It Generates. J. Geophys. Res., 97, 12,731-12,744. [31] Kanayama, S., Tanaka, H., and Shuto, N. 1998 A multi-level model for nonlinear dispersive water waves. In Coastal Engineering 1998 (ed. Billy L. Edge), vol. 1, pp.576-588. ASCE. [32] Keating, B. H. and McGuire, W. J 1999 Island Edifice Failures and Associated Hazards. In Pure and Applied Geophysics, Special Issue: Landslide and Tsunamis. In press. [33] Kennedy, A. B., Chen, Q., Kirby, J. T., and Dalrymple, R. A. 2000 Boussinesq modeling of wave transformation, breaking, and runup. Part I: 1D. Journal of Waterway, Port, Coastal and Ocean Engng., 126(1), 39-47. [34] Kennedy, A. B., Kirby, J. T., Chen, Q. and Dalrymple, R. A. 2001 Boussinesq-type equations with improved nonlinear behaviour. Wave Motion 33, 225-243. [35] Kirby, J.T., Wei, G., Chen, Q., Kennedy, A.B. and Dalrymple, R.A. 1998 FUNWAVE 1.0: Fully Nonlinear Boussinesq Wave Model Documentation and User’s Manual. Center for Applied Coastal Research, University of Delaware. [36] Kobayashi, N. Karjadi, E.A., and Johnson, B.D. 1997 Dispersion effects on longshore currents in surf zones. Journal of Waterway, Port, Coastal and Ocean Engng., 123(5), 240-248.
198 [37] Kowalik, Z. and Bang, I. 1987 Numerical computation of tsunami run-up by the upstream derivative method. Science of Tsunami Hazards, 5(2), 77-84. [38] Lee, S.-J., Yates, G. T., and Wu, T. Y. 1989 Experiments and analyses of upstream-advancing solitary waves generated by moving disturbances. J. Fluid Mech. 199, 569-593. [39] Leendertse, J. J. 1987 Aspects of SIMSYS2D, a system for two-dimensional flow computation. R-3752-USGS. Rand Corp., Santa Monica, CA, 80. [40] Li, Y. and Raichlen, F. 2002 Non-breaking and breaking solitary wave run-up ., Journal of Fluid Mechanics, 456, 295-318. [41] Lin, P. 1998 Numerical modeling of breaking waves. Ph. D. Thesis, Cornell University [42] Lin, P., Chang, K.-A., and Liu, P. L.-F. 1999 Runup and rundown of solitary waves on sloping beaches. Journal of Waterway, Port, Coastal and Ocean Engng., 125(5), 247-255. [43] Liu, P. L.-F. 1994 Model equations for wave propagation from deep to shallow water. In Advances in Coastal Engineering (ed. P. L.-F. Liu), vol. 1, pp.125157. World Scientific. [44] Liu, P. L.-F., Cho, Y.-S., Briggs, M. J., Kanoglu, U., and Synolakis, C. E. 1995 Runup of solitary waves on a circular island., Journal of Fluid Mechanics, 302, 259-285. [45] Liu, P. L.-F., Hsu, H.-W., and Lean, M.H 1992 Applications of Boundary Integral Equation Methods for Two-Dimensional Non-Linear Water Wave Problems. Int. J. for Numer. Meth. in Fluids, 15, 1119-1141. [46] Liu, P.L.-F., Yoon, S.B. and Kirby, J.T. 1985 Nonlinear refractiondiffraction of waves in shallow water. J. Fluid Mech. 153, 184-201. [47] Liu, P. L.-F. and Earickson, J 1983 A Numerical Model for Tsunami Generation and Propagation. in Tsunamis: Their Science and Engineering (eds. J. Iida and T. Iwasaki), Terra Science Pub. Co., 227-240. [48] Mader, C. L. 1990 Numerical tsunami flooding study. Science of Tsunami Hazards. 8(2), 79-96. ¨ ffer, H.A. 1998. Higher-Order Boussinesq-type [49] Madsen, P.A. and Scha Equations for Surface Gravity Waves: Derivation and Analysis. Phil. Trans. R. Soc. Lond. A, 356, 2123–3184. [50] Madsen, P. A., and Sorensen, O. R. 1992 A new form of the Boussinesq equations with improved linear dispersion characteristics. Part II: A slowly varying bathymetry. Coast. Engng. 18, 183-204.
199 [51] Madsen, P. A., Sorensen, O. R., and Schaffer, H A. 1997 Surf zone dynamics simulated by a Boussinesq-type model. Part I: Model description and cross-shore motion of regular waves. Coast. Engng., 32, 255-287. [52] Mercado, A. I. 1998 personal communication [53] Mercado, A. I., Grindlay, N., Lynett, P., and Liu, P. L.-F. 2001 Investigation of the potential tsunami hazard on the north coast of Puerto Rico due to submarine landslides along the Puerto Rico Trench. Submitted to Puerto Rico State Emergency Management Agency 245 pps. [54] Moore, G. and Moore, J. G 1984 Deposit from Giant Wave on the Island of Lanai. Science, 222, 1312-1315. [55] Nwogu, O. 1993 Alternative form of Boussinesq equations for nearshore wave propagation. Journal of Waterway, Port, Coastal and Ocean Engng. 119(6), 618-638. [56] Peregrine, D. H. 1967 Long waves on a beach. Journal of Fluid Mechanics 27, 815-827. [57] Peregrine, D. H. 1969 Solitary waves in trapezoidal channels, Journal of Fluid Mechanics, 35, 1-6. [58] Petera, J., and Nassehi, V. 1996 A new two-dimensional finite element model for the shallow water equations using a Lagrangian framework constructed along fluid particle trajectories, International Journal for Numerical Methods in Engineering , 39, 4159-4182. [59] Press, W.H., Flannery, B.P., and Teukolsky, S.A 1989 Numerical Recipes. Cambridge University Press, 569-572. [60] Raney, D. C. and Butler, H. L 1976 Landslide Generated Water Wave Model. J. Hydraulic Div., 102, 1269-1282. [61] Schaffer, H. A. 1996 Second-order wavemaker theory for irregular wave. Ocean Engineering 23(1), 47-88. [62] Shi, F., Kirby, J. T., Dalrymple, R. A. and Chen, Q. 2002 Wave simulations in Ponce de Leon Inlet using a Boussinesq model. Submitted to Journal of Waterway, Port, Coastal and Ocean Engineering. [63] Sielecki, A. and Wurtele, M.G. 1970 The numerical integration of the nonlinear shallow-water equations with sloping boundaries. Journal of Computational Physics, 6, 219-236. [64] Stansberg, C. T. 1993 Propagation-dependent spatial variations observed in wavetrains generated in a long wave tank. Report presented to Norwegian Research Council.
200 [65] Synolakis, C.E. 1986 The runup of long waves PhD thesis, California Institute of Technology, Pasadena, Calif. [66] Synolakis, C.E. 1987 The runup of solitary waves Journal of Fluid Mechanics, 185, 523-545 [67] Synolakis, C.E., Bardet, J.-P., Borrero, J. C., Davies, H. L., Okal, E. A., Solver, E. A., Sweet, S., and Tappin, D. R. 2002 The slump origin of the 1998 Papua New Guinea Tsunami. Royal Society of London A, 458, 763-789 [68] Tanaka, M. 1986 The stability of solitary waves. Phys. Fluids 29, 650-655. [69] Tao, J. 1983 Computation of wave runup and wave breaking Internal Report, Danish Hydraulics Institute, Denmark. [70] Tao, J. 1984 Numerical modeling of wave runup and breaking on the beach. Acto Oceanologica Sinica, 6(5), 692-700 (in Chinese). [71] Tappin, D. R., et al. 1999 Sediment Slump Likely Caused 1998 Papua New Guinea Tsunami. EOS, 80(30), 329. [72] Tappin, D. R., Watts, P., McMurtry, G. M., Lafoy, Y., and Matsumoto, T. 2001 The Sissano, Papau New Guinea Tsunami of July 1998 Offshore Evidence on the Source Mechanism. Marine Geology, 175, 1-23. [73] Thacker, W. C. 1981 Some exact solutions to the nonlinear shallow water wave equations. Journal of Fluid Mechanics, 107, 499-508. [74] Titov, V. V., and Synolakis, C. E. 1998 Numerical modeling of tidal wave runup. Journal of Waterway, Port, Coastal and Ocean Engng., 124(4), 157-171. [75] Vincent, C. L. and Briggs, M. J. 1989 Refraction-diffraction of irregular waves over a mound. Journal of Waterway, Port, Coastal and Ocean Engng. 115, 269-284. [76] von Huene, R. Bourgois, J. Miller, J. and Pautot, G 1989 A Large Tsunamigetic Landslide and Debris Flow Along the Peru Trench. J. Geophys. Res., 94, 1703-1714. [77] Wang, K-H 1993 Diffraction of Solitary Waves by Breakwaters. Journal of Waterway, Port, Coastal and Ocean Engng., 119, 49-69. [78] Watts, P 1997 Water Waves Generated by Underwater Landslides. Ph. D. Thesis, California Institute of Technology, 1997 [79] Wei, G. 1995 A fully nonlinear Boussinesq model for surface waves. Ph. D. Thesis, University of Delaware
201 [80] Wei, G. and Kirby, 1995 A time-dependent numerical code for extended Boussinesq equations. Journal of Waterway, Port, Coastal and Ocean Engng. 120, 251-261. [81] Wei, G., Kirby, J. T., Grilli, S. T., and Subramanya, R. 1995 A fully nonlinear Boussinesq model for surface waves. Part I. Highly nonlinear unsteady waves. J. Fluid Mech. 294, 71-92. [82] Whitford, D.J. and Thornton, E.B. 1996 Bed shear stress coefficients for longshore currents over a barred profile. Coast. Engrg., 27, 243-262. [83] Woo, S.-B. 2002 Finite element modeling of the fully-nonlinear extended Boussinesq equations. Ph. D. Thesis, Cornell University [84] Woo, S.-B. and Liu, P. L.-F. 2001 A Petrov-Galerkin finite element model for one-dimensional fully non-linear and weakly dispersive wave propagation. International Journal for Numerical Methods in Engineering 37, 541-575. [85] Yeh, H., Liu, P. L.-F. and Synolakis, C. (Eds) 1996 Long-wave Runup Models. Proc. 2nd Int. Workshop on Long-wave Runup Models, World Scientific Publishing Co., Singapore. [86] Zelt, J. A. 1991 The runup of nonbreaking and breaking solitary waves. Coast. Engrg., 15, 205-246. Much of the work presented in this thesis can also be found in these papers by the author: [87] Lynett, P., Wu, T.-R., and Liu, P. L.-F. 2002 Modeling Wave Runup with Depth-Integrated Equations. Coast. Engrg., 46(2), 89-107. [88] Lynett, P. and Liu, P. L.-F. 2002 A Numerical Study of Submarine Landslide Generated Waves and Runup. Royal Society of London A in press. [89] Lynett, P. and Liu, P. L.-F. 2002 A Multi-Layer Approach to Water Wave Modeling. Journal of Fluid Mechanics submitted. Papers of similar topic by the author, but not presented in this thesis: [90] Lynett, P., Liu, P. L.-F., Losada, I., and Vidal, C. 2000 Solitary Wave Interaction with Porous Breakwaters. Journal of Waterway, Port, Coastal and Ocean Engng. 126(6), 314-322. [91] Lynett, P. and Liu, P. L.-F. 2002 A Two-Dimensional, Depth-Integrated Model for Internal Wave Propagation. Wave Motion in press.