sensors Article
A Network Coverage Information-Based Sensor Registry System for IoT Environments Hyunjun Jung 1 , Dongwon Jeong 2, *, Sukhoon Lee 3 , Byung-Won On 2 and Doo-Kwon Baik 4, * 1 2 3 4
*
Department of Computer and Radio Communications Engineering, Korea University, Anam-dong, Seongbuk-Gu, Seoul 136-701, Korea;
[email protected] Department of Statistics and Computer Science, Kunsan National University, Miryong-dong, Gunsan-si, Jeollabuk-do 573-701, Korea;
[email protected] Department of Biomedical Informatics, Ajou University School of Medicine, Woncheon-dong, Yeongtong-gu, Suwon 433-721, Korea;
[email protected] Department of Computer Science and Engineering, Korea University, Anam-dong, Seongbuk-Gu, Seoul 136-701, Korea Correspondence:
[email protected] (D.J.);
[email protected] (D.-K.B.); Tel.: +82-63-469-4617 (D.J.); +82-2-925-3706 (D.-K.B.)
Academic Editors: Mihai Lazarescu and Luciano Lavagno Received: 19 April 2016; Accepted: 19 July 2016; Published: 25 July 2016
Abstract: The Internet of Things (IoT) is expected to provide better services through the interaction of physical objects via the Internet. However, its limitations cause an interoperability problem when the sensed data are exchanged between the sensor nodes in wireless sensor networks (WSNs), which constitute the core infrastructure of the IoT. To address this problem, a Sensor Registry System (SRS) is used. By using a SRS, the information of the heterogeneous sensed data remains pure. If users move along a road, their mobile devices predict their next positions and obtain the sensed data for that position from the SRS. If the WSNs in the location in which the users move are unstable, the sensed data will be lost. Consider a situation where the user passes through dangerous areas. If the user’s mobile device cannot receive information, they cannot be warned about the dangerous situation. To avoid this, two novel SRSs that use network coverage information have been proposed: one uses OpenSignal and the other uses the probabilistic distribution of the users accessing SRS. The empirical study showed that the proposed method can seamlessly provide services related to sensing data under any abnormal circumstance. Keywords: network coverage; Sensor Registry System; sensor information
1. Introduction The Internet of Things (IoT) is a large-scale network of physical objects, including microcomputers and sensing nodes, that provides users with much better personalization services. Objects such as RFIDs, sensors, actuators, mobile phones, smart cars, and electronic devices are all interconnected via the Internet [1]. The IoT allows these heterogeneous objects to gather, combine, and exchange data. As a good example of these IoT-based services, SFpark (sfpark.org) has provided useful parking information since about 8200 car parking space sensor devices were installed in San Francisco. Every automobile driver can reduce the time wasted in finding an available parking space by using the SFpark application. In this case, the IoT-based service makes life very convenient. To embody its services, the wireless sensor network (WSN) is used as the core infrastructure of the IoT. In the WSN, various types of sensed data are collected from multiple, heterogeneous sensors, e.g., temperature, illumination, humidity, sound, pressure, and vibration sensors, in real time. Then, these sensing data are combined and used to provide better services. For example, as mentioned above, the
Sensors 2016, 16, 1154; doi:10.3390/s16081154
www.mdpi.com/journal/sensors
Sensors 2016, 16, 1154
2 of 20
sensors located in about 8200 parking lots in San Francisco frequently collect information regarding the available parking spaces, and then send the information to an agent operating in a computer server that collates all the information and detects an available parking space near a user who requests this information. Finally, the available parking space is shown to the user on the SFpark application display. However, the IoT is likely to have different WSNs [2,3]. Each WSN stores and distributes data in a different format. For instance, the standard temperature unit in WSNs located in the US is Fahrenheit, while that in Canada and Mexico is Celsius. Thus, when sensed data are exchanged between different WSNs, interoperability problems occur. To overcome this barrier, depending on the situation, Fahrenheit must be converted to Celsius, or vice versa. Currently, a Sensor Registry System (SRS) is used to resolve the interoperability problem. Many types of sensor information named sensor metadata are registered at the SRS. The sensor metadata are used to interpret, recognize, and process the meanings of sensed data [4]. Recently, to achieve a “safe” city, an IoT-based service was constructed in Gimpo-si near Seoul in Korea. Many sensors were attached to street lamps, security lights, closed-circuit television cameras (CCTVs), underground facility management systems controlling water/sewage pipes, electricity cables, communication lines, gas pipes, control centers of parks and apartment complexes, and even next-generation traffic information systems. In this service, the sensed data are exchanged among the heterogeneous sensors, and incidents or crimes can be efficiently predicted and thus prevented. This IoT-based system makes use of SRS to address the interoperability problem of sensed data. To enable issuing of advanced warnings about dangerous sinkholes on roads, sensors are located in subways and water/sewage pipes. To enable the prediction of a gas explosion, sensors are installed in the sectors and districts of the city. All the sensed data transmitted by the sensors located around subways and water/sewage pipes and by gas detection sensors is registered in the SRS. The mobile devices of users walking along a road regularly access and obtain the relevant sensed information stored in the SRS and attempt to interpret the meaning of the sensor data they receive. If a user passes through dangerous areas, for example, where they could encounter sinkholes, or through a dangerous gas leak area, the user’s mobile device should predict their next position on the road relative to the current position. First, the mobile device can obtain the GPS information, using which the user’s past position is tracked. Second, based on the previous path information, several candidates for the next position can be predicted. Finally, from the current position, if one of the candidate positions was frequently selected by many other persons in a particular time interval, it is determined as the user’s next position. In this way, Path Prediction-based SRS [5] (PP-SRS) is used for receiving the relevant sensor information from SRS and predicting the user’s path. However, if the network quality of the WSNs in the location in which the user moves is unstable, the mobile device, in some instances, cannot receive the sensed data, and further, encounters the interoperability problem. To address the interoperability problem under unstable WSN conditions, this paper proposes a SRS that uses network coverage information. By using the coverage information of the WSNs provided by OpenSignal [6], the network quality of the WSNs can be detected. If the network quality of the next position that is predicted by PP-SRS is determined to be poor, the proposed method can pre-fetch the sensed data information for that position from the SRS. Thus, the prevention of incidents or even crimes can be facilitated, even when the network is unstable. Additionally, this paper presents a novel method based on the probabilistic distribution of the users accessing SRS to detect the network quality of the next position, rather than OpenSignal. According to the experimental results, as compared to the existing PP-SRS, the proposed system shows an approximately 40% improved performance. This indicates that the proposed methods can be used to enhance various IoT-based services. The remainder of this paper is organized as follows: Section 2 introduces the background. Section 3 present a SRS that uses network coverage information. Section 4 describes the implementation. Section 5 provides the experimental setup and results. In Section 6, related work is discussed. Finally, the concluding remarks and future work are summarized in Section 7.
Sensors 2016, 16, 1154
3 of 20
2. Background 2.1. Sensor Registry Systems A WSN is a physical infrastructure that is required for the Internet of Things (IoT) ecosystem. In a WSN, there exist a sink node and a group of sensors. The sink node is also a sensor node that collects and combines various types of sensed data (e.g., humidity, temperature, sound, pressure, motion, and vibration) from the sensors within the WSN. In this article, these sensed data are called instant data. The sink node regularly sends the instant data to the mobile devices of users who are in the vicinity of the WSN. Finally, applications running on the mobile devices provide the users with intelligent services through the mash up of heterogeneous instant data. To combine various instant data, the metadata of each instant data must be corrected. For example, the new terms are defined to be used by other applications. In addition, redundant metadata are removed and relevant metadata are semantically linked to the existing metadata in the Sensor Registry System. For this process, the metadata of each instance data are first submitted to the centralized Sensor Registry System. Then, a few metadata experts evaluate the submitted metadata, and make corrections, if necessary. In this way, the Sensor Registry System plays an important role in registering and managing the heterogeneous metadata of instant data sent by sensors. A user’s mobile device continues to receive instant data collected by sensors whose purpose is to unceasingly measure a physical quantity for a particular event in real time. In parallel, the mobile device also receives metadata associated with the instant data from the Sensor Registry System. The metadata enables the mobile device to conduct semantically consistent interpretation of the heterogeneous instant data sent by a variety of sensors. In this article, we clearly assume that there are two physically different networks in the proposed scheme. One is a wireless sensor network, in which the mobile devices receive instant data sent by sensors. Through the other network, the mobile devices also receive metadata sent by the Sensor Registry System. Technically, the Sensor Registry System sends the metadata via Internet, and then the mobile device finally receives the metadata sent by a mobile station, which is the end-point of the Internet. In particular, we consider communication under bad conditions, where the mobile devices cannot receive any metadata because of the encountered communication problems. We also assume that the wireless sensor network is working in any case. Consequently, in the proposed system architecture, mobile devices receive instant data from sensors via the wireless sensor network and metadata associated with the instant data from Sensor Registry System via the Internet. The Sensor Registry System has been developed by using the conceptual model based on ISO/IEC 11179. It registers and manages the heterogeneous metadata of instant data. In the real world, when a user is moving to another sensor network in the vicinity of the current sensor network, the Sensor Registry System sends semantically consistent metadata of the instant data to the user’s mobile device. Consequently, although the mobile device is transferred to different wireless sensor networks, it continues to provide service using instant data, overcoming the metadata interoperability problem, which commonly occurs in various sensors around different wireless sensor networks. For example, suppose that there are two sensor networks in Korea and the USA. A mobile device receives temperature information from thermometer sensors in Korea, where the sensors collect the information on the centigrade scale. Meanwhile, if the user travels to the USA, their mobile device will experience difficulty in processing temperature data from thermometer sensors in the USA. This is because all sensors measuring temperatures in the USA output the temperature using the Fahrenheit temperature scale. To address this metadata interoperability issue, a Sensor Registry System can retain semantically consistent metadata, indicating that Celsius is the same as Fahrenheit. If the user’s mobile device is operating in the USA, the Sensor Registry System will send semantically consistent metadata to the mobile device so that it continues to interpret temperature information without any limitation.
Sensors 2016, 16, 1154
4 of 20
2.2. Path Prediction The goal of the existing path prediction method is to predict a next desired segment among multiple candidate segments while a mobile device is moving along a path. For example, suppose there are paths like (a)Ñ(b)Ñ(c)Ñ(d)Ñ(e) and (a)Ñ(b)Ñ(c)Ñ(d)Ñ(f), where (a), (b), (c), (d), (e), and (f) are segments. If the current position of a mobile device is in the segment (d), the path prediction method can predict either (e) or (f) as the next suitable segment. The next position is determined by the greedy approach—e.g., (f) is determined if (f) was more frequently selected than (e) in the previous users’ routes. In the segment (d), the mobile device can prefetch metadata that are necessary for interpreting the instant data that will be sent by the sensors in the segment (f) when it arrives at the (f) segment. In the proposed approach, extending the existing path prediction method, when a mobile device is moving to the segment (f) from the segment (d), it can forecast, using network coverage information, that the network will be not working in the segment (f) and mobile devices will not get any metadata in (f). Then, it can bring the metadata in advance, in order to interpret instance data in (f), using the prefetched metadata. In this work, as the network coverage information, the following information is employed: -
-
OpenSignal data includes a set of latitude, longitude, signal strength, telecommunication service provider(s). If the signal strength is greater than or equal to a certain threshold value (θ), the network in (f) is working in the local area (latitude, longitude). Otherwise, mobile devices cannot receive any metadata in the area. Previous log data in Sensor registry system—e.g., communication problems can be detected if the log data contains the frequent data transmission failure and retrials in the particular area of (latitude, longitude).
3. Network Coverage Information-Based Sensor Registry System for IoT Environment This section introduces an extented SRS, named Network Coverage-based SRS (NC-SRS) that uses open network coverage data. PP-SRS suffers from a problem related to providing a seamless service. Non-service areas are areas where the mobile device using a SRS service experiences poor network conditions and does not receive the sensor information from the SRS. The sensor information is used for analyzing the data transmitted by the sensor device, for example, the identifier of the sensor and the unit of measure. When the sensor information does not received, the user cannot interpret the sensor data. The problem of continuous non-coverage is not be solved by using PP-SRS. Recent network support coverage information of the non-responding regions of a network can be obtained easily. When predicting the user’s path, it is possible to use the coveragence information of a network. Figure 1 illustrates the coverage information of a network provided by the OpenSignal application [6], which shows the signal strength corresponding to the regions on the map. This application shows the signal strength data of the carrier in a region having a predetermined range based on the GPS latitude and longitude information. The network coverage information includes the carrier information in the user’s area, communication bandwidth, signal strength, and upload/download speed. In this paper, to solve the problems related to an unstable network condition of PP-SRS, a method that uses the network coverage data has been proposed. PP-SRS is used for predicting the movement path of the user, when the mobile device has received the sensor information of the next path in advance. However, in a continuous poor communication area, the system does not respond. The mobile device utilizes the network coverage data and can recognize the network status of the user’s next path. The proposed method utilizes the coverage information and receives the sensor information of the poor communication area, in advance. The information of the mobile device’s carrier and communication type is the basic information required for creating the SRS poor communication group.
Sensors 2016, 16, 1154
5 of 20
Sensors 2016, 16, 1154
5 of 20
Sensors 2016, 16, 1154
5 of 20
Figure 1. Example of network coverage data provided by OpenSignal. Figure 1. Example of network coverage data provided by OpenSignal. Figure 1. Example of network coverage data provided by OpenSignal.
Figure 2 shows an overview of the proposed method. Figure 3 shows an example of the receipt Figure 22 shows an of proposed method. Figure an of of the sensor information by the path prediction-based system. The system receives thereceipt sensor Figure shows an overview overview of the the proposed method. Figure 33 shows shows an example example of the the receipt of the sensor information by the path prediction-based system. The system receives the sensor in advance, by before the user’s arrival at a system. position. If system the prediction successful ofinformation, the sensor information the path prediction-based The receivesisthe sensor information, before the user’s arrival at anext position. If the the prediction is successful irrespectiveinin ofadvance, the communication of arrival the user’s deviceisirrespective receives the information, advance, before the state user’s at path, a position. If themobile prediction successful of the communication state of the next path, the user’s mobile device receives the metadata using metadata using the previously received metadata, the sensor data can be interpreted. In the first irrespective of the communication state of the next path, the user’s mobile device receives the the previously metadata, sensor candevice be interpreted. In the first pathIn(1), path (1), using whenreceived moving towardreceived thethe next path data (2), the receives information of the metadata the previously metadata, the sensor data canthe besensor interpreted. thewhen first moving toward the information next toward path (2),of the device sensor information of theinformation next path, i.e., next(1), path, i.e., moving the sensors S4receives –S(2), 6. path when the next path thethe device receives the sensor of the the information of the sensors S4 –S6 . of sensors S4–S6. next path, i.e., information
Figure 2. Network coverage information-based method overview. Figure 2. 2. Network Network coverage coverage information-based information-based method method overview. overview. Figure
Sensors 2016, 16, 1154 Sensors 2016, 16, 1154 Sensors 2016, 16, 1154
6 of 20 6 of 20 6 of 20
Figure 3. 3. Example Example of of sensor sensor information information received received using using path path predict. predict. Figure Figure 3. Example of sensor information received using path predict.
When the communication state of the next path is poor, the mobile device uses the sensor When communication state of next path path is poor, poor, the mobile device device uses uses the the sensor sensor When the the communication of the the next the mobile information received in advancestate and analyzes the sensoris data. However, if the coverage is poor in a information received in advance and analyzes the sensor data. However, if the coverage is poor information received in advance and analyzes the sensor data. However, the coverage is poor inin a continuous path, denial-of-service areas are formed, that is, areas where theif service is disabled, which acontinuous continuous path, denial-of-service areas are formed, that is, areas where the service is disabled, path, denial-of-service areas are formed, that is, areas where the service is disabled, which cannot be considered in the analysis of the sensor data. Sensors S7 to S11 in the disabled service area which cannot be considered the analysis the sensor data. Sensors S the disabled service 11 in cannot considered in the in analysis theof sensor data. Sensors S7 tothe S711 to inSthe disabled service cannot be interpret the received sensorofdata. To solve this problem, proposed method usesarea the area cannot interpret the received sensor data. To solve this problem, the proposed method uses the cannot interpret the received sensor data. To solve this problem, the proposed method uses the coverage information of the network to transfer the sensor information of the denial-of-service area coverage information of the the network network to to transfer the the sensor information information of the denial-of-service area coverage information continuously. Figure 4ofpresents concept transfer diagram forsensor extending PP-SRS. of the denial-of-service area continuously. Figure 4 presents concept diagram for extending continuously. Figure 4 presents concept diagram for extending PP-SRS. PP-SRS.
Figure 4. Concept diagram for extending PP-SRS. Figure 4. Concept diagram for extending PP-SRS. Figure 4. Concept diagram for extending PP-SRS.
Network coverage-based SRS provides users with sensor information on the basis of the Network coverage-based SRS provides users with sensorthe information on must the basis of the coverage information of the network. In the proposed method, user’s device identify, in Network coverage-based SRS provides users with sensor information on device the basis of the coverage coverage information of the network. In the proposed method, the user’s must identify, in advance, the sensors that are in use, to obtain the necessary sensor information in advance. The information the network. the proposed method, the user’s device must identify, in advance, advance, theofsensors that areIninmethod use, to utilizes obtain the in to advance. existing path prediction-based the necessary user’s pathsensor that itinformation has received, predictThe the the sensors that are in use, to obtain the necessary sensor information in advance. The existing path existing path prediction-based method utilizes the user’s path that it has received, to predict information for the next path. The proposed method evaluates the network coverage informationthe in prediction-based method utilizes the user’s path thatevaluates it has received, to predict the information for information for the next path. method network coverage in the next path, depending onThe theproposed circumstances, and sendsthe relatively rich sensorinformation information. the next The proposedon methodcircumstances, evaluates the network coverage information in the next path, the next5path. path, and sends relatively richsystem sensor Figure showsdepending an applicationthe of the conventional path prediction-based toinformation. obtain the Figure 5 shows anoverall application the The conventional path prediction-based system to obtain the information of the sensorofdata. path prediction algorithm is applied to determine the information of the overall sensor data. The path prediction algorithm is applied to determine the
Sensors 2016, 16, 1154
7 of 20
depending on1154 the circumstances, and sends relatively rich sensor information. Figure 5 shows Sensors 2016, 16, 7 ofan 20 application of the conventional path prediction-based system to obtain the information of the overall sensor data. TheAn path prediction algorithm is applied to determine the predicted An additional predicted path. additional process is proposed wherein the network coveragepath. information for the process is proposed wherein the network coverage information for the predicted path is checked. predicted path is checked. The system utilizes the results of the predicted path and then checks the The system utilizes theof results of the predicted path and then checks coverage information of the coverage information the local network of the mobile device. Thethe network coverage information local of the mobile device. The network coverage information in the proposed method usednetwork in the proposed method includes: (1) carrier information, i.e., used SK Telecom, Olleh, or LGT; includes: (1) carrier information, i.e., SK Telecom, Olleh, or LGT; (2) signal strength, i.e., Received (2) signal strength, i.e., Received Signal Strength Indicator (RSSI) or Reference Signal received Poser Signal Strength (RSSI)related or Reference received (RSRP); (3) information related (RSRP); and (3)Indicator information to theSignal network type,Poser i.e., 2G, 3G, and or 4G. By using the basic to the network type, 2G, 3G, or 4G. By using basic information the device, coverage information information and the i.e., coverage information of the the network of the user’s and mobile it is possible to of the network of thethe user’s mobile device, it isofpossible to prepare inFor advance the communication prepare in advance communication status the movement path. example, in the case of an status of the For example, in the casenetwork of an unstable 3Gthe signal, the device information unstable 3Gmovement signal, thepath. information related to the type of mobile is therelated signal to the network of the mobile device signal strength of the 3G network the area of the strength of the type 3G network in the area of is thethe predicted movement route. If it is −80indBm or less, the predicted movement route. If it is ´80 dBm or less, the sensor information is sent in advance before sensor information is sent in advance before the user’s arrival in that area. If the mobile device is the user’s or arrival that area. If the mobilethe device is unstable or hasisa pre-loaded weak signalto strength, sensor unstable has ainweak signal strength, sensor information providethe seamless information is pre-loaded to provide seamless sensor data analysis in difficult environments. sensor data analysis in difficult environments.
Figure 5. 5. Overall Overall procedure procedure for for providing providing sensor sensor information. information. Figure
When a path is fragmented by road intersections, the proposed method utilizes the fragments of When a path is fragmented by road intersections, the proposed method utilizes the fragments the path, i.e., path segments. Figure 6 shows an example of the use of the network coverage when a of the path, i.e., path segments. Figure 6 shows an example of the use of the network coverage path is predicted using the structure of the path segments. Here, pi denotes the user in a continuous when a path is predicted using the structure of the path segments. Here, pi denotes the user in a position, the grayscale region represents the road along which the user is walking, fi denotes a path continuous position, the grayscale region represents the road along which the user is walking, fi segment, nci denotes the network coverage corresponding to the path fragment, the blue color denotes a path segment, nci denotes the network coverage corresponding to the path fragment, the indicates a good network state, and the red color denotes an unstable network state. Users p1, p2, and blue color indicates a good network state, and the red color denotes an unstable network state. Users p3 sequentially move to f0 and f2. Their subsequent future paths to other locations are predicted: {p4 → p1 , p2 , and p3 sequentially move to f 0 and f 2 . Their subsequent future paths to other locations are p5, p4 → p6, p4 → p7}. The existing path prediction-based SRS, after the user navigates to p4, either predicted: {p4 Ñ p5 , p4 Ñ p6 , p4 Ñ p7 }. The existing path prediction-based SRS, after the user navigates predicts a move to any location in {p5, p6, p7} or sends the sensor information for that path. However, to p4 , either predicts a move to any location in {p5 , p6 , p7 } or sends the sensor information for that path. in the case of p4, because the network state is unstable in that area, the mobile device does not receive However, in the case of p4 , because the network state is unstable in that area, the mobile device does the sensor information from the server, and thus, cannot interpret the received sensor data. The not receive the sensor information from the server, and thus, cannot interpret the received sensor data. proposed method checks the network coverage state of the path fragment at the server in advance. If The proposed method checks the network coverage state of the path fragment at the server in advance. the user is expected to move along a path fragment where the network is unstable, the information If the user is expected to move along a path fragment where the network is unstable, the information of the sensor corresponding to {nc3, nc4, nc5} is sent when the user is at position p3. The mobile device, of the sensor corresponding to {nc3 , nc4 , nc5 } is sent when the user is at position p3 . The mobile device, regardless of the status of the network in the p4 area, can interpret the peripheral sensor data. When regardless of the status of the network in the p4 area, can interpret the peripheral sensor data. When the mobile device is moved to a normal network region, it can utilize PP-SRS. the mobile device is moved to a normal network region, it can utilize PP-SRS.
Sensors 2016, 16, 1154
8 of 20
Sensors 2016, 16, 1154
8 of 20
Sensors 2016, 16, 1154
8 of 20
Figure 6. Graphical representation of applying path prediction. Figure 6. Graphical representation of applying path prediction. Figure 6. Graphical representation of applying path prediction.
Figure 7 shows an example of the sensor information received on the basis of the coverage shows an of the sensor basis of and the to coverage Figure 7provided. received on the the problem information A example service reception denialinformation region is formed to solve extend information provided. A service reception denial region is formed to solve the problem and to extend PP-SRS. Theprovided. coverage state depends on the carrier and the type of network, 3G or LTE. By utilizing depends carrier and network, By utilizing PP-SRS. The coverage stateby depends on thethe carrier and the type network, 3G orinLTE. the functionality provided OpenSignal, signal strength of of a mobile device a desired region the functionality provided by OpenSignal, the signal strength of a mobile device in a desired region can be obtained. The system saves the signal intensity corresponding to the type of network of each can be obtained. The system saves the signal intensity corresponding to the type of network of each carrier in the path segment, and by using this information, it determines the area where local services carrier path segment, and byinformation using this information, it determines where local services cannot in bethe received. All the sensor of the next path, which isthe in area an area where the signal cannot be received. All the sensor information of the next path, which is in an area where the information strength is weak and is regarded as a disabled service area, is sent, including that of sensors Ssignal 4–S11. weak and is regarded as aa disabled service is including that strength is mobile disabled service area, is sent, sent, including that of of sensors sensors 11.. 44–S 11 The user’s device may interpret the sensor dataarea, received from the peripheral sensorsSSin the The user’s the peripheral sensors the mobile device may interpret the sensor data received from in reception-disabled region of the service. Thus, it is possible to reduce the loss of raw data. reception-disabled region of the service. Thus, it is possible to reduce reduce the the loss loss of of raw raw data. data.
Figure 7. Example of sensor information received using coverage information. Figure information. Figure 7. 7. Example Example of of sensor sensor information information received received using using coverage coverage information.
Sensors 2016, 16, 1154
9 of 20
Algorithm 1 shows a major portion of the measurement algorithm of a denial-of-service area mentioned in the pseudo-code. Using the algorithm, a set of path segments in a denial-of-service region can be determined. In Algorithm 2, a depth first search (DFS) is used to group the connected path segments. SRS sends the sensor information of all the path fragments in the denial-of-service area on the following path of the mobile device. Algorithm 1. disabled_coverage_measuring (network type, vendor, standard_strength)
1: 2: 3: 4: 5: 6: 7: 8: 9: 10: 11: 12: 13: 14:
Input: network type of user mobile phone, vendor of user mobile phone, standard_strength of disable signal standard Output: set DC[] of disabled segments Segment [] Ð get all segments () for each Segment:s do cp Ð get_center_point (s) sd Ð get_distance (s)/2 ss Ð get_signal_strength (cp, sd, networktype, vendor) sec Ð get_SRS_enable_check (s) if ss < standard_strength or sec = True then DC[] Ð s endif if sec = False then Remove s from DC[] endif endfor return DC[]
Algorithm 2. disabled_coverage_grouping (DC[], G)
1: 2: 3: 4: 5: 6: 7: 8: 9: 10: 11: 12: 13: 14: 15: 16: 17: 18: 19: 20:
Input: set DC[] = {s1, s2, . . . , sm} of disabled segments, a segment graph G Output: set S[] of disabled group Let S[] be a stack Segment[] = DC[] //get all disable segment nÐ0 //group number while Segment[] is not empty S[n].push(Segment[0]) Remove Segment[0] from Segment[] while S[n] is not empty v = S[n].pop() for all edges from v to w in G.adjacentEdges(v) do for each segment:s do if Segment[s] = w then S[n].push(w) Remove Segment[i] from Segment[] endif endfor endfor endwhile nÐn+1 endwhile return S[]
Sensors Sensors 2016, 2016, 16, 16, 1154 1154
10 of of 20 20 10
4. Implementation 4. Implementation To utilize the proposed PP-SRS, an application running on the server and mobile device was To utilize the proposed PP-SRS, an application running on the server and mobile device was implemented. A track and path prediction application that displays the user’s location was implemented. A track and path prediction application that displays the user’s location was developed. developed. Table 1 shows the development environment. Table 1 shows the development environment. Table 1. Development environment. Table 1. Development environment. Feature Details Operating System Windows 7 Professional Feature Details K (x64) Processor Intel(R) Core(TM) i5-3570 3.80 Operating System Windows 7 Professional K GHz (ˆ64) RAM 12 GB Processor Intel(R) Core(TM) i5-3570 3.80 GHz Development Java RAMLanguage 12 GB Mobile Language OS Android OS Development Java OS Version Android OS AndroidMobile Emulator 4.1.2 AndroidWeb Emulator 4.1.2 8.0.8 ServerVersion Apache Tomcat Web Server Apache Tomcat Database MySQL 5.5 8.0.8 Database MySQL 5.5
Figure 8 shows a data model of the network coverage algorithm. The User table is used to identify the 8user. The UserPoint saves the user’s location and uses for tracking purposes. The Figure shows a data modeltable of the network coverage algorithm. TheitUser table is used to identify Intersection and PathSegment tables are used to represent the road. The PathSegmentCoverage table is the user. The UserPoint table saves the user’s location and uses it for tracking purposes. The Intersection used to store the coverage of the networks; this PathSegmentCoverage table, together with the PathSegment and PathSegment tables areinformation used to represent the road. The table is used totable, store stores the carrier type of the mobile devicethis communication and thethe signal strength.table, Next,stores Figure 9 the coverage information of the networks; table, together with PathSegment the shows network data of the path fragments weight dataNext, of CBP. The9 path located carrier type of thecoverage mobile device communication and theand signal strength. Figure showsisnetwork inside anddata nearby Kunsan National and University. The coverage information consists of OpenSignal coverage of the path fragments weight data of CBP. The path is located inside and nearby information. Carrier type LTE composed of SK Telecom, and LGT.information. Carrier typeCarrier 3G is Kunsan National University. Theiscoverage information consistsOlleh, of OpenSignal composed Olleh. Figure 10 showsOlleh, a screenshot captures the isimplementation results of the type LTE is of composed of SK Telecom, and LGT.that Carrier type 3G composed of Olleh. Figure 10 proposed method. Figure 10a shows the intersectionsresults of theof path collectedFigure from the shows a screenshot that captures the implementation thefragments proposed method. 10amobile shows device. The server thatpath receives the location information of thedevice. user’s The mobile device identifiesthe a the intersections of the fragments collected from the mobile server that receives nearby fragment. Figure 10b shows the coverage onfragment. the server, indicating the locationpath information of the user’s mobile device identifiesinformation a nearby path Figure 10b shows denial-of-service areas. The identifies the denial-of-service service regions receives the the coverage information onserver the server, indicating the denial-of-service areas. The and server identifies mobile device information, the carrier and communication type. Continuous denial-of-service the denial-of-service service i.e., regions and receives the mobile device information, i.e., the carrier and areas are grouped using the DFS search algorithm. areas are grouped using the DFS search algorithm. communication type. Continuous denial-of-service
Figure 8. Data model of network coverage-based path prediction. Figure 8. Data model of network coverage-based path prediction.
Sensors 2016, 16, 1154 Sensors 2016, 16, x FOR PEER Sensors 2016, 16, x FOR PEER
11 of 20 11 of 20 11 of 20
Figure 9. Snapshot of implementation using network coverage information. Figure Snapshotof ofimplementation implementationusing using network coverage information. Figure 9. 9. Snapshot network coverage information.
(a) (a)
(b) (b)
Figure 10. Snapshot of implementation: (a) Intersection points and path segments; (b) example of Figure 10. Snapshot of implementation: (a) Intersection points and path segments; (b) example of Figure Snapshot ofsegment. implementation: (a) Intersection points and path segments; (b) example of service10. disabled path service disabled path segment. service disabled path segment.
5. Experimental Results 5.5. Experimental Results Experimental Results This section shows that the proposed NC-SRS method based on Algorithms 1 and 2 described This shows that proposed NC-SRS method based on Algorithms and described in Thissection section shows that the the proposed NC-SRS method based Algorithms 11and 22described in Section 4 is more accurate than the existing PP-SRS method. It ison worth noting that PP-SRS method Section 4 isto accurate than method. worth noting PP-SRS method inisSection 4more is more accurate thanthe theexisting existing PP-SRS PP-SRS method. ItItisisworth noting PP-SRS method likely significantly reduce the accuracy of the task of predicting a path if that thethat network status is isislikely to significantly reduce the accuracy of the task of predicting a path if the network status likely to significantly reduce the accuracy of the task of predicting a path if the network status partly unstable along the path. On the contrary, the proposed NC-SRS is a robust method evenisin is partly along path. On thecontrary, contrary, theproposed proposed NC-SRS a robust method even partly unstable along path. the the is aisgood robust in in manyunstable of the cases inthe which theOn quality of the network is not NC-SRS sufficiently tomethod enable aeven mobile many ofofthe cases the quality qualityofoffrom thenetwork network not sufficiently good to enable a mobile many thecontinuously cases in in which the the isisnot sufficiently good to enable aobtaining mobile device to obtain metadata the Sensor Registry System. Obviously, device to continuously obtain metadata from the Sensor Registry System. Obviously, obtaining device to continuously obtain metadata from the Sensor Registry System. Obviously, obtaining proper proper metadata at a time is very important to the mobile device. While the mobile device is moving proper metadata at a time is very important to the mobile device. While the mobile device is moving metadata at a time is veryit important to the mobile device. While the mobile device sensor is moving along a along a predicted path, is always receiving instant data from sensors via a wireless network. along a predicted it is always receiving instant data from via a wireless sensor network. predicted path, it ispath, always receiving instant data from sensors via wireless sensor network. However, However, unless it has the very metadata corresponding to sensors the ainstance data, it cannot grasp the However, unless it has the very metadata corresponding to the instance it the cannot grasp the meaning thevery instant data using the metadata. proposed method candata, detect of a path unless it hasof the metadata corresponding to The the instance data, it cannot grasp theparts meaning of the meaning of the instant data using the metadata. The proposed method can detect the parts of a path in which the communication problem might occur, in advance. The proposed method works based instant data using the metadata. The proposed method can detect the parts of a path in which the inonwhich theofcommunication problem occur, in advance. The proposed method works based the use open signalmight data and themight mining of the provenance information of thebased sensing communication problem occur, in advance. The proposed method works on registry the use of on the use of open signal data and the mining of the provenance information of the sensing registry system (seedata Algorithm If it is detected that there might be disconnected areas inregistry a predicted path, open signal and the1).mining of the provenance information of the sensing system (see system (see Algorithm 1). If it is detected that there might be disconnected areas in a predicted path, Algorithm 1). If it is detected that there might be disconnected areas in a predicted path, then the
Sensors 2016, 2016, 16, 16, 1154 1154 Sensors
12 of of 20 20 12
way, the mobile device can seamlessly interpret instance data sent by sensors, using the relevant method attempts to obtain the metadata from the Sensor Registry System, in advance. In this way, the metadata sent by Sensor Registry System. mobile device can seamlessly interpret instance data sent by sensors, using the relevant metadata sent To evaluate both PP-SRS and NC-SRS methods, 21 undergraduate students in the Kunsan by Sensor Registry System. National University participated in the experiment. The moving route data of the students were To evaluate both PP-SRS and NC-SRS methods, 21 undergraduate students in the Kunsan National gathered for 15 weeks. The raw data, such as date, time, and GPS co-ordinates, were collected from University participated in the experiment. The moving route data of the students were gathered for the smartphones of the 15 students. It was concluded that each student tended to have 4~5 paths per 15 weeks. The raw data, such as date, time, and GPS co-ordinates, were collected from the smartphones day on an average. To obtain the real paths, the raw data were projected on the campus map. In the of the 15 students. It was concluded that each student tended to have 4~5 paths per day on an data set, the number of total paths is 489. In addition, a path consists of several segments. At a fork average. To obtain the real paths, the raw data were projected on the campus map. In the data set, in the road, there are several segments to move. The number of total path segments is 117. Figures 9 the number of total paths is 489. In addition, a path consists of several segments. At a fork in the and 10 illustrate these details. Figure 11 shows basic statistics, indicating the counts of the road, there are several segments to move. The number of total path segments is 117. Figures 9 and 10 disconnected path segments of the major three public telecommunications business operators in illustrate these details. Figure 11 shows basic statistics, indicating the counts of the disconnected path Korea—SK Telecom, LG Telecom, and KT (Model name: Olleh). For the experiment, the network segments of the major three public telecommunications business operators in Korea—SK Telecom, LG coverage information of the three companies is collected from the OpenSignal website. The network Telecom, and KT (Model name: Olleh). For the experiment, the network coverage information of the types are 3G and 4G (LTE). To determine whether a path segment is disconnected or not, the specific three companies is collected from the OpenSignal website. The network types are 3G and 4G (LTE). signal strength threshold value for each carrier is defined by domain experts. For example, the To determine whether a path segment is disconnected or not, the specific signal strength threshold threshold values are {SK Telecom, LTE, −85.2}, {Olleh, LTE, −83.6}, {LG Telecom, LTE, −83.2}, and value for each carrier is defined by domain experts. For example, the threshold values are {SK Telecom, {Olleh, 3G, −74.6}. Overall, the number of the unavailable path segments is 33 on an average. The rate LTE, ´85.2}, {Olleh, LTE, ´83.6}, {LG Telecom, LTE, ´83.2}, and {Olleh, 3G, ´74.6}. Overall, the number of the unavailable path segments is 100 28% . In addition, the areas of continuous of the unavailable path segments is 33 on an average. The rate of the unavailable path segments is 33 disconnected path segments are defined as the service disabled path segment groups. The number of 117 ˆ 100 “ 28%. In addition, the areas of continuous disconnected path segments are defined as the the groups is three onsegment average.groups. Moreover, group is composed of three or four continuous service disabled path The each number of the groups is three on average. Moreover, path each segments. In the worst case, it has at most six path segments. Figure 11 is a good motivated example group is composed of three or four continuous path segments. In the worst case, it has at most six path of the research problem in this article. In of this real environment, commonlyinappears that segments. Figure 11 is apresented good motivated example the research problemit presented this article. the existing PP-SRS method does not working effectively owing to the existence of several In this real environment, it commonly appears that the existing PP-SRS method does not working disconnected segments the predicted paths. effectively owing to the in existence of several disconnected segments in the predicted paths.
Figure 11. Service Service disabled disabled path path segment segment and group size evaluation result. Figure
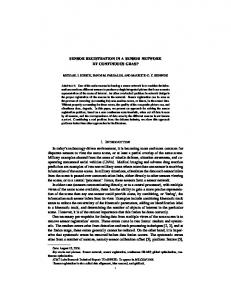
Figure least one one segment segment with Figure 12 12 depicts depicts the the number number of of paths, paths, each each of of which which has has at at least with network network service failure. Interestingly, the different vendors tend to have considerably different numbers service failure. Interestingly, the different vendors tend to have considerably different numbers of of paths. paths. For For example, example, SK SK Telecom Telecom has has about about 43% 43% of of the the total total paths, paths, each each of of which which has has at at least least one one disconnected 209 paths paths contain disconnected path path segments. segments. Specifically, Specifically, 209 contain at at least least one one disconnected disconnected segment segment among among the total 489 paths. Meanwhile, KT and LG Telecom have approximately 38% and 46% the total 489 paths. Meanwhile, KT and LG Telecom have approximately 38% and 46% of of the the total total paths, 3G, the the result result is is poorest—e.g., poorest—e.g., about about 65%. 65%. This paths, respectively. respectively. In In case case of of 3G, This means means that that network network quality much better quality is is different different for for different different companies companies and and the the network network quality quality of of LTE LTE (4G) (4G) is is much better than than that of 3G. that of 3G.
Sensors 2016, 16, 1154 Sensors Sensors 2016, 2016, 16, 16, 1154 1154
13 of 20 13 13 of of 20 20
Figure 12. Total disabled path rate evaluation result. Figure12. 12.Total Totaldisabled disabledpath path length length and and loss loss Figure length and loss rate rateevaluation evaluationresult. result.
Figure Figure 13 13 shows shows aa service service provision provision rate rate of of the the existing existing PP-SRS PP-SRS method method and and the the proposed proposed NCNCFigure 13 shows a service provision rate of the data existing PP-SRS method and the proposed NC-SRS SRS method. From the total of 489 paths, ten-fold set were made first, each of which SRS method. From the total of 489 paths, ten-fold data set were made first, each of which contained contained # method. From the total of 489 paths,The ten-fold data set were made first, eachby of which contained nine # .. To nine To nine training training sets sets and and one one test test set. set. The service service provision provision rate rate is is computed computed by # service # of provided # . To measure training sets and one test set. The service provision rate is computed by # of service requests measure the rate, assume the accuracy is for both and because rate, we we the prediction prediction accuracy is 100% 100% both of of PP-SRS PP-SRS and NC-SRS NC-SRS because themeasure rate, wethe assume theassume prediction accuracy is 100% for both for of PP-SRS and NC-SRS because NC-SRS NC-SRS method only considers whether services are successfully provided or not. SK Telecom is NC-SRS method only considers whether services are successfully provided or not. SK Telecom method only considers whether services are successfully provided or not. SK Telecom is selected is as a selected as a network service for the experiment in Figure 13 because SK Telecom provides the best selected as a network service for the experiment in Figure 13 because SK Telecom provides the best network service for the experiment in Figure 13 because SK Telecom provides the best network service network network service service as as compared compared to to LG LG Telecom Telecom and and KT KT as as shown shown in in Figure Figure 14. 14. NC-SRS NC-SRS discovers discovers the the as unavailable compared tonetwork LG Telecom andareas KT asalong shown inpredicted Figure 14.paths; NC-SRS discovers the unavailable network service the the proposed NC-SRS method will unavailable network service areas along the predicted paths; the proposed NC-SRS method will service areasmetadata along the predicted paths; the proposed NC-SRS method even will obtain the metadata from obtain obtain the the metadata from from the the Sensor Sensor Registry Registry System, System, in in advance. advance. Thus, Thus, even though though aa mobile mobile device device theisSensor Registry System, innetwork advance. Thus, failure, even thoughable a mobile device is moving in the areasent under is moving moving in in the the area area under under network service service failure, itit is is able to to seamlessly seamlessly process process instant instant data data sent network service failure, it is able to seamlessly process instant data System. sent by sensors, using thePP-SRS relevant by sensors, using the relevant metadata sent by the Sensor Registry In contrast, since by sensors, using the relevant metadata sent by the Sensor Registry System. In contrast, since PP-SRS metadata byany theintelligent Sensor Registry In contrast, since PP-SRS does not have any does have process of the parts of itit can no longer does not notsent have any intelligent processSystem. of detecting detecting the disconnected disconnected parts of paths, paths, can nointelligent longer process of detecting the disconnected parts of paths, it can no longer interpret instant data sent by interpret instant data sent by sensors. In Figure 13, PP-SRS shows about 63.34%, while the proposed interpret instant data sent by sensors. In Figure 13, PP-SRS shows about 63.34%, while the proposed method indicates 100% for service provision rate. This experimental result means that the proposed sensors. In Figure 13, PP-SRS shows about 63.34%, while the proposed method indicates 100% method indicates 100% for service provision rate. This experimental result means that the proposedfor NC-SRS method does not have of in service provision rate. This result means that the instant proposed NC-SRS method does where not have NC-SRS method does notexperimental have any any limitation limitation of processing processing instant data data in the the environment environment where there are communication problems. anythere limitation of processingproblems. instant data in the environment where there are communication problems. are communication
Figure Figure 13. 13. Service Service provision provision rate rate of of PP-SRS PP-SRS and and NC-SRS. NC-SRS. Figure 13. Service provision rate of PP-SRS and NC-SRS.
Sensors 2016, 16, 1154 Sensors 2016, 16, 1154
14 of 20 14 of 20
Figure 14. 14. Comparison Comparison of of the the service service provision provision rates ratesof ofeach eachcarrier carrierusing usingPP-SRS PP-SRSand andNC-SRS. NC-SRS. Figure
Figure 14 illustrates the service provision rate of both PP-SRS and NC-SRS for the different Figure 14 illustrates the service provision rate of both PP-SRS and NC-SRS for the different communication companies in Korea. The proposed NC-SRS method shows 100% because a mobile communication companies in Korea. The proposed NC-SRS method shows 100% because a mobile device using NC-SRS has received metadata in advance before it enters unavailable network service device using NC-SRS has received metadata in advance before it enters unavailable network service areas along the predicted path. In this way, the mobile device cannot lose necessary metadata in the areas along the predicted path. In this way, the mobile device cannot lose necessary metadata in the circumstance of unavailable network service. However, the existing PP-SRS method can show very circumstance of unavailable network service. However, the existing PP-SRS method can show very poor rates for different communication vendors. For instance, the service provision rates of PP-SRS poor rates for different communication vendors. For instance, the service provision rates of PP-SRS in in SK Telecom, KT(LTE), LG Telecom, and KT(3G) are 63%, 22%, 45%, and 31%, respectively. SK Telecom, KT(LTE), LG Telecom, and KT(3G) are 63%, 22%, 45%, and 31%, respectively. Expectedly, Expectedly, the patterns of PP-SRS are very similar to the rates of paths with network failure by the the patterns of PP-SRS are very similar to the rates of paths with network failure by the vendors, as vendors, as shown in Figure 13. The average rate of PP-SRS is up to 40%. shown in Figure 13. The average rate of PP-SRS is up to 40%. In summary, there are two major findings of the experiments. First, in actual applications, to In summary, there are two major findings of the experiments. First, in actual applications, to which which the existing path prediction methods are applied, a number of paths turn out to contain the existing path prediction methods are applied, a number of paths turn out to contain considerable considerable segments where a mobile device cannot obtain metadata from a Sensor Registry System, segments where a mobile device cannot obtain metadata from a Sensor Registry System, which which is necessary to interpret the meaning of instant data sent by sensors. These experimental results is necessary to interpret the meaning of instant data sent by sensors. These experimental results strongly support the reason why the proposed NC-SRS method is required in the traditional path strongly support the reason why the proposed NC-SRS method is required in the traditional path prediction problem. prediction problem. Second, the service provision rate of the existing PP-SRS method is up to 40% across the major Second, the service provision rate of the existing PP-SRS method is up to 40% across the major communication vendors in Korea. However, the proposed NC-SRS method is able to seamlessly communication vendors in Korea. However, the proposed NC-SRS method is able to seamlessly process instance data, using metadata in mobile devices. In the area where the network status is process instance data, using metadata in mobile devices. In the area where the network status is unstable and even metadata is not sent to the mobile device, NC-SRS method receives the proper unstable and even metadata is not sent to the mobile device, NC-SRS method receives the proper metadata from the Sensor Registry System in advance, using (1) OpenSignal data and (2) the previous metadata from the Sensor Registry System in advance, using (1) OpenSignal data and (2) the previous log data of the Sensor Registry System. Consequently, without affecting the limitation of physical log data of the Sensor Registry System. Consequently, without affecting the limitation of physical network status, the NC-SRS method can enable mobile devices to cope with the instant data sent by network status, the NC-SRS method can enable mobile devices to cope with the instant data sent by sensors, to eventually provide seamless service to the end-users of mobile devices. sensors, to eventually provide seamless service to the end-users of mobile devices. 6. Related Work 6. Related Work In this section, we discuss SRS and network coverage information that were employed for In this section, we discuss SRS and network coverage information that were employed for understanding SRS and mobile crowdsensing. understanding SRS and mobile crowdsensing. 6.1. Sensor Sensor Registry Registry System System 6.1. The network network conditions conditions of of the the existing existing SRS SRS are are unstable unstable and and thus thus they they do do not not reliably reliably provide provide The sensor data. To solve this problem, enhanced SRS was developed based on path prediction [4]. This sensor data. To solve this problem, enhanced SRS was developed based on path prediction [4]. This path prediction-based SRS can predict the moving path of the user to pre-load the sensor data of their path prediction-based SRS can predict the moving path of the user to pre-load the sensor data of future position into a mobile device. It can also reliably process and interpret sensor data under
Sensors 2016, 16, 1154
15 of 20
their future position into a mobile device. It can also reliably process and interpret sensor data under unstable network conditions. This study applies the weight of the moving path for each time period to improve the path prediction performance. However, the path prediction of SRS under unstable network conditions has certain limitations. SRS predicts the movement path of the user’s mobile device and transmits the relevant sensor information. However, when the predicted travel path is not within the coverage area of the network, a mobile terminal may not be able to receive the sensor information, as in areas not included within the network coverage. The connection between the mobile terminal and sensor registry management system becomes disabled. Thus, the mobile device does not receive the sensor information required to process the received sensor data and the quality of the associated application service is therefore degraded. In the method proposed in [7], the user’s movement route data, distance, and time are collected, and then, the degree of similarity of the path with other frequently used paths is measured using the direction element. The method then selects the highest path similarity. The study focused on the fact that destination prediction is impossible if no past movement route information for the user exists, and therefore, the method is not suitable for short-distance movement path prediction. Using the existing mobile path prediction methods, which focused primarily on the prediction of a personalized travel route, it is impossible to achieve a prediction in the absence of past movement route data. Further, since the object of the prediction is the final destination, the methods are not suitable for short-distance travel path prediction. In particular, a fast response speed to a request in a real-time processing environment is required. Fast movement prediction algorithms for short-range users that can overcome these limitations, such as the Collective Behavior Pattern (CBP) prediction algorithm, have been proposed [8]. CBP uses the greedy strategy concept to provide a high-speed processing performance. For this reason, fragmented paths are managed on the basis of the intersection of the road. A fragmented path is defined as a path fragment set. The path fragment has a direction and a weight. By selecting the path fragment with the highest weight from all the path fragments, the movement route can be predicted. 6.2. Network Coverage Information Network coverage information is mobile cellular network information based on mobile crowdsensing. The mobile crowdsensing approach turns user mobile phones into sensing devices with measurement software running in the background. This approach has the advantage of enabling cost-effective, fine-grained and continual spatiotemporal wireless monitoring [9]. OpenSignal [6] and Mobiperf [10] represent crowdsourced mobile network measurement systems with website and mobile apps. OpenSignal provides the quality of mobile networks such as the available name of the network, the average RSSI in Arbitrary Backbone Unit (ASU) and dBm, the average download speed in kbps and the average ping time in milliseconds. The quality information can predict the user network condition with GPS information, network name, and network type. Urban WiFi characterization [11] presents a mobile crowdsensing approach that leverages commodity smartphones and the natural mobility of people and monitoring through a measurement study in the city of Edinburgh. This method indicates the WiFi source in practice at locations with high AP densities. MCSSENSE [12] describes a full-featured geo-social crowdsensing platform for smart cities. This platform automates the organization of spontaneous collaborations of large groups of people participating in collective actions, such as in the notable case of urban crowdsensing. MCS [13] use the power of citizens for large-scale sensing. MCS goes beyond participatory sensing by having implicit and explicit participation, and the collection of crowdsourced data from both mobile sensing and mobile social network services. CAROMM [14] presents a mobile crowdsensing system and focused on developing an efficient and scalable data collection model that aims to reduce energy and bandwidth consumption related to continuous sensing and uploading in such applications. TRAC [15] have investigated designing incentive mechanisms for stimulating smartphone users to join mobile
Sensors 2016, 16, 1154
16 of 20
crowdsourcing applications with smartphones. TRAC have considered the crucial dimension of location information in the design of incentive mechanism. Kiljander et al. [16] addressed the interoperability problem of IoT devices that tend to create and combine heterogeneous metadata. They proposed a semantic-level interoperability architecture that utilizes IoT and pervasive computing devices. To resolve heterogeneous metadata, IoT devices are expressed as ontology through the semantic web knowledge representation function of the semantic information broker in the approach. Furthermore, FIESTA-IoT [17] extended the basic metadata model of [16] and presented experimental results using the experimentation-as-a-service (EaaS) paradigm. Similar to Kiljander et al.’s approach, IoT devices are represented as a standards-based ontology concept and users can access desired metadata using EaaS application program interface. However, both [16] and [17] do not describe the detailed method of real applications. Unlike NC-SRS in this article, the existing methods do not make seamless service for users that encounter the network connection problem. Table 2 summarizes the comparison of NC-SRS with the existing methods [16,17]. Our work has focused on disabled coverage measuring and grouping mechanism for seamlessly providing services. Table 2. Comparison of NC-SRS with the existing methods [16,17]. Similarities
Differences ¬
¬
NC-SRS vs. Kiljander et al. [16] ®
Both researches assume the same physical environment as heterogeneous IoT environment. Both methods propose the metadata model for managing heterogeneous metadata for IoT devices, using MetaData Registry (MDR) concept. Both methods provide similar metadata model for sensing device, location, actuators, and unit of measure.
®
¯
¬ Kiljander et al. [16] vs. FIESTA-IoT [17]
¬
FIESTA-IoT extends the basic functions of Kiljander et al.’s metadata model.
®
NC-SRS implements the metadata model through Entity Relationship-based model but Kiljander et al. make use of ontology-based model. NC-SRS method is based on ISO/IEC 11179-based registration and management of heterogeneous metadata but Kiljander et al. never consider it. The applications of both methods are different. NC-SRS is working in emergent situations but Kiljander et al. consider smart space applications. The most distinct point of the two methods is: Kiljander et al. focus merely on defining a ontology-based metadata model for managing heterogeneous metadata. However, NC-SRS supports seamless services for users with network connection problem, using network coverage information. Our method is working on top of Kiljander et al.’s method. FIESTA-IoT manages heterogeneous metadata in the same way as Kiljander et al.’s method. Moreover, FIESTA-IoT adds more detailed ontologies and service definitions. Unlike Kiljander et al.’s method, data exchange model is additionally defined using JSON. FIESTA-IoT newly presents experimental results including case study of real applications.
7. Conclusions This paper has proposed an extended SRS capable of providing sensor information stably in areas that are not supported by a network or where the network coverage is weak. Sensor information needs to be received seamlessly, because it is used for interpreting the data received from the various sensors. In other words, the provision of reliable sensor information to the user is essential for providing a stable service. Therefore, a method that predicts the moving path of the user and sends the sensor information to the user’s mobile in advance, using open network coverage information was presented. The open information of the mobile terminal and the user’s network coverage, that is, the local telecommunications company’s information, signal strength, and network type, are checked, and the sensor information is provided in advance. In the proposed method, as compared to the existing path prediction method, the mobile device receives additional sensor information according to the network state. An additional overhead is incurred by including the sensor information for continuous regions. The user’s quality of service is relatively less influenced by the state of the network, and the user’s mobile device is capable of processing continuous sensor data. The operation of users’ mobile devices is stable, because they can process the sensor data, thus, they enabling the provision of a stable
Sensors 2016, 16, 1154
17 of 20
quality of service. In future, the impact of the overhead generated by adding sensor information on performance will be investigated. Acknowledgments: This research was supported by Basic Science Research Program through the National Research Foundation of Korea (NRF) funded by the Ministry of Education (NRF-2014R1A1A2058992). The co-corresponding authors are Doo-Kwon Baik and Dongwon Jeong. Author Contributions: The work presented in this paper is a collaborative development by all of the authors. In particular, Dongwon Jeong and Doo-Kwon Baik have make the specification of the system; Sukhoon Lee have developed the software tool; Hyunjun Jung and Byung-Won On have developed the experiment applications. Writing of the paper was shared between the authors. Conflicts of Interest: The authors declare no conflict of interest.
Appendix A. Statistical Hypothesis Test In this study, it was assumed that the signal strength at a location is not constant. According to the OpenSignal site, the signal strength does not change over time. However, it has been shown empirically that the signal strength at a location constantly changes. A statistical hypothesis test was conducted to verify this. The signal strength of a mobile device using a Samsung Note II and LGT carrier was measured. The changes in signal intensity were measured for 15 days at one location. The hypotheses of this paper are: Null hypothesis (H0): The standard deviation of 15 days is zero. Alternative Hypothesis (H1): The standard deviation of 15 days is not zero. The adopted significance level was 95%. Table A1 shows the results of the one-way analysis of variance. The p-value, which is less than the significance level, is sufficiently weak to support the null hypothesis, or is sufficiently strong to reject the null hypothesis, that is, to adopt the alternative hypothesis. Table A1. One-way variance analysis. Signal Strength Source of Variance
Sum of Squares
Df
Mean Square
F
p Value
Between Group Within Group Total
101,819.299 82,179.436 183,998.735
14 17,952 17,966
7272.807 4.578
1588.736