Simulator for the Analysis of Pedestrian Traffic (ISAPT)system models each .... So, if a pedestrian does not have a ticket they will not be permitted to enter (pass ...
Proceedings of the 2011 Industrial Engineering Research Conference T. Doolen and E. Van Aken, eds.
A Network Framework to Support the Simulation of Indoor Pedestrian Navigation John M. Usher, Ph.D., P.E., Eric Kolstad, and Hohyun Lee Dept. of Industrial and Systems Engineering, Mississippi State University P.O. Box 9542, Miss State, MS 39762 Abstract The Intermodal Simulator for the Analysis of Pedestrian Traffic (ISAPT) is being developed for the purpose of modeling pedestrian traffic within intermodal facilities, such that designers may evaluate the impact of building design on the Level of Service provided. The navigational and decision-making behaviors that influence the pedestrian’s travel rely heavily on the functional attributes defined within the facility model. An associated network delineates the principal path structure between nodes that represent waypoints and locations of user resources such as ticket counters, food service vendors, and restrooms. This paper describes the network framework employed by ISAPT and illustrates the necessity of key features it affords to the simulation. Several examples are given that demonstrate various applications of the capabilities provided by the framework in the context of intermodal facilities. Keywords: pedestrian traffic simulation; micro-simulation; behavioral modeling
1. Introduction In the process of facility engineering and construction, designers must evaluate overall building design considerations in the context of their effective impact on Level of Service and other factors . The Intermodal Simulator for the Analysis of Pedestrian Traffic (ISAPT)system models each pedestrian’s behavior individually and the collective behavior of the crowd emerges from the interactions between them. A probabilistic approach is employed to simulate pedestrian navigation, taking into account factors considered by humans as they move about their environment. In addition to general navigation functions, a simulated pedestrian must also be able to execute their agenda and perform real-time decision-making based on the environmental conditions they may encounter. The navigational and decision-making behaviors that influence the pedestrian’s travel rely heavily on the functional attributes defined within the facility model. An associated network delineates the principal path structure between nodes that represent waypoints and locations of user resources such as ticket counters, food service vendors, and restrooms. This paper describes the network framework employed by ISAPT and illustrates the necessity of key features it affords to the simulation. Several examples are given that demonstrate various applications of the capabilities provided by the framework in the context of intermodal facilities.
2. Background Popular schemes for simulating pedestrian crowds include cellular automata, social forces and rule-based systems – each of which has certain tradeoffs [1]. The first of these relies on a grid cell-based division of space for pedestrian travel, occupancy and consideration of movement alternatives [2]. Using a force strategy attempts to distribute motion via physically motivating forces such as forward movement, steering and avoidance of obstacles. Rule-based systems enact logical choices when a certain series of conditions or overall criteria have been met. System models are somewhat divided as to whether choices are examined in terms of a continuous space of motion alternatives (as with social forces systems modeled as repulsive forces [3, 4]) or these are focused on several discrete combinations of base navigation factors during a given time step – for example, discrete spatial regions in cellular automata [2, 5] or representative combinations of direction and speed [6, 7]. When simulated movement choices are not viable or have already resulted in an undesirable state, however, it is up to the individual system to allow for
Usher, Kolstad, & Lee braking force, stop-and-wait conditions, and other actions to enable individual pedestrians (and the system overall) to re-adjust, for example, after one or more collisions have been encountered.
3. System Description The ISAPT simulation system is designed to be able to simulate pedestrian traffic within varied environments including intermodal facilities (e.g., airports, train stations, etc.). Based on overall travel patterns configured for the facility, the system generates a dynamic pedestrian population representing those persons involved in arriving, departing, and connecting transit points. The system also includes simulation of non-travelers in the form of persons that enter the facility for the purpose of picking-up or dropping-off travelers. ISAPT is implemented as a 3D OpenGL-based application written in the C++ programming language with an objective of supporting crossplatform use. The system simulates the behavior of each individual pedestrian, employing probabilistic navigation at the local level and route based planning at the strategic level. Each pedestrian moves in continuous 3D space, planning their trip inside the facility determined by an agenda defining a list of activities they are to complete during their visit. An example activity set would include check-in at the ticket counter, checking of bags, passing through security, obtaining food, a visit to the restroom, and waiting in the gate area prior to the boarding call. Agendas are defined for each individual within the facility, with the system simulating and collecting data on the traffic flow and resource utilizations that arise as the result of the pedestrians performing their required activities. The reader is referred to associated publications for further discussion [8, 9].
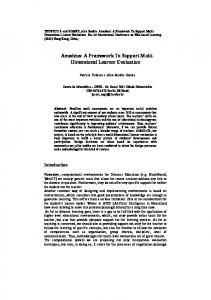
Figure 1: Simulated pedestrians arriving at queue, in front of ticket counters
4. System Network Within the simulated facility model, each pedestrian is able to move freely within structured areas such as corridors or any more generally navigable space. However, their overall journey is also guided by a set of inter-connected nodes that collectively define a navigation network. This network represents the central paths and key locations within the facility structure, enabling route-based travel planning. In order to be able to reproduce the types of behavior typically observed in real-world facilities, it is necessary that the nodes comprising the network possess some level of functionality. While many nodes serve as simple constructs (e.g. as a series of interim locales, branching decision points, resource objects, or statistics collection regions), a given node may perform multiple functions – it is the node’s attributes that determine its influence on system behavior. For conceptual and routeplanning purposes, however, it is useful to describe nodes in terms of their primary function. In general, the interconnected nodes of a network act as a foundation for navigation decisions, where certain linked nodes will have additional function. Not all nodes associated with the system are necessarily linked within the travel network for a given pedestrian or route, and nodes may overlap or surround certain regions of space. The sections that follow describe the node-related features defined within ISAPT that enable it to represent varied pedestrian travel influences within a facility.
Usher, Kolstad, & Lee
5. Basic Node Types As indicated earlier, a pedestrian’s trip within a facility is determined by their current agenda, which results in a list of activities they intend to complete during their visit to the facility. Each activity has one or more corresponding resource locations where it may be performed (e.g. ticket counters, food vendors, boarding gates, retail stores, restrooms, etc.). These resources are represented by resource nodes that act as primary objects on the underlying network used as waypoints along potential routes planned by pedestrians. A more extensive set of intermediary nodes connects the space between resource nodes, acting as a navigation framework that provides a structural description of the building’s thoroughfares to enable pedestrian route-based navigation. Consider the simple layout shown in Figure 2 defining the location of several resources (ticket counter locations C1-C4). If a pedestrian were approaching at the lower left with intent to visit the ticket counter area, they would typically be observed to follow an indirect path (such as the thin dashed line) that is somewhat impeded due to obstacles along the way. Without more detailed connectivity information, their navigation decisions might result in a planned travel path (shown as the thick dashed line) that does not realistically represent typical behavior for an actual pedestrian. Intermediate navigation nodes are thus defined within the network as needed to increase the spatial resolution of successive waypoints located between resource locations. Figure 2 shows several dotted-outline nodes added to the graph for secondary navigation detail.
Figure 2: Airport ticket counter area with primary (solid-circle) and intermediary (dashed-circle) nodes.
6. Pedestrian Navigation When a pedestrian enters the system, an initial route from their origin to final destination (e.g., the boarding gate for their departing flight) is planned, defining the specific nodes they intend to visit from start to finish. As can be seen in Figure 2, it is possible that multiple connecting links will be associated with a given node. We refer to these nodes as decision nodes, which trigger pedestrian decision logic in association with path-based routing through that node. A decision node is thus an intermediate navigation node with two or more alternatives that may be considered for outbound traffic. The routing logic will determine which path is best utilized at the point when such a node is approached. This becomes necessary in such situations where: • • •
Pedestrians have the choice of branching routes through (sometimes crowded) areas, A pedestrian approaches an area with multiple queue lines for a resource (i.e. alternative vendors in a food court), and Exit paths lead to variously distanced resources with different priorities.
Usher, Kolstad, & Lee
In the first situation, the pedestrian will evaluate the congestion and approximate travel time for each region ahead and make the optimal path decision. In the second situation, they will estimate the waiting time for the available queues and select one they believe will provide the best service. Similarly, the choice amongst multiple paths and available resources will be based on priority and time required to obtain them. Estimates made by the pedestrians in each of these cases may take into account region-based data maintained by associated data collection nodes (discussed below).
7. Node Attributes The attributes of a node define its features, parameter values, behavioral effect, and limitations for a given region. To enable navigational or other decision-making use, node attributes can also be marked to indicate a connection with a larger structure. The most basic attributes of a node are its name, location, and connectivity. The name of a node provides a unique identifier used for general reference, while its location provides a reference to the 3D geometry representing the facility, with connectivity describing its relation to other nodes in the navigation graph via incoming and outgoing links. While a node’s general function is to support path-based routing and navigation behavior, more specialized attributes are available to help represent varied service-related resources found within intermodal centers. These act together to simulate larger system processes involved with services such as ticket counters, security gates, food courts, restrooms and so on. Functional node attributes consist of: • • • • • • •
Active region extent (rectangular or radial dimensions) Navigable zones for nodes and pathways Conditional entry for capacity limit and locales Extended conditional entry requirements Resource type notation (used primarily in decision logic) Behavioral influence factors Data collection variables with associated region
These attributes allow ISAPT to: • • • • • • • •
Enforce occupancy requirements to facilitate arrival/departure and parking locations (for seating, etc.) Influence navigational decisions within node regions and connected routes Enable pedestrians to obtain resource benefits according to a user-specified service time distribution Modify decision factor influence and/or behavior within proximity to a node Provide the planning module with current data updates for dynamic route planning and resource use Gather region-based statistics: throughput, occupancy, time in area, density, etc. Represent the dynamic input sources for arriving populations Modify the navigation network to include additional structures e.g. for temporary use in dynamic queue formation
An overview of the use of these attributes and their influence on pedestrian behavior and general system operation is discussed below. Active region and Navigable zones: Each node in the system occupies a certain space, which pedestrians must cross into for purposes of navigation and/or resource use. With an active route plan in mind, pedestrians will utilize the node network to proceed from one waypoint to another, their local movements guided primarily by collision avoidance as they progress towards their next objective. Although such a “straight line” path through a set of conceptual waypoints can give a rough travel time estimate, in reality it would be used more for guidance. A simple behavior encouraging travel closely conforming to the path network is not sufficient, as this would result in unnatural behavior and traffic congestion along the route, with further convergence towards waypoints (intermediate nodes) that represent the navigational targets, as shown in Figure 3a.
Usher, Kolstad, & Lee
Figure 3a: Pedestrians following in proximity to network structure (tendency to converge at nodes)
Figure 3b: Network structure with navigational extent region hints added for nodes and connecting paths.
To overcome this problem, the system permits the user to define preferred navigation extents along paths and vicinity of node regions. A given route may be considered to have a collective region of space encompassing its nodes and pathways that represents an area of more likely travel under certain constraints. Pedestrians will generally attempt to stay within a reasonable proximity of the path segments between and regions surrounding waypoints. Figure 3b’s dashed navigation zones (above) can be interpreted as regions of relatively preferred movement. When a pedestrian moves within navigable range of an upcoming target node (i.e. within its surrounding area), they are seen as having effectively reached that node for navigation purposes en-route. At this point, the next node on the pedestrian’s path becomes its target and travel can continue towards the next node on the current route, or to the node’s physical region if it is an intended resource. The result is a more natural representation of traffic through the facility (Figure 3b, above) as pedestrians are encouraged to go with the overall flow and direction of the network structure, and may take shortcuts past recognized waypoints. The factors that encourage this behavior are adjustable for individual nodes and connections (e.g. for a single-occupancy resource vs. a wide-open area, or a corridor junction with a diverse range of traffic relative to a queue line) and can act to narrow a pedestrian’s focus when approaching resources. Conditional entry: These properties permit the user to allow entry based on capacity (when not otherwise constrained by available space), region conditions and pedestrian attribute requirements. The limits imposed affect the accessible regions within a defined area. A pedestrian’s attributes may thus affect available resources and navigation decisions. An example would be that only those passenger’s in possession of a ticket are allowed to proceed through security. So, if a pedestrian does not have a ticket they will not be permitted to enter (pass through) an area. It is also possible to require that node attributes match a certain value or range to be valid, and for overlapping regions to impose combined limits. Node regions may also require that pedestrians wait before entering if an intended resource is not yet available (e.g., to maintain open space in front of ticket counters). Resource type: In instances where a pedestrian must make decisions based on information that is not represented fully by path-based route and node details. To enable the decision logic to ascertain the function of a larger structure is, or mark parts of it that are relevant for a particular use, a resource type can be assigned. For example, marking a node as the entrance to a queue could indicate its connection with upcoming servers and provide important detail when a pedestrian wants to choose which to enter based on observed statistics. Behavioral influence (region of effect): This attribute acts to modify pedestrian behavior by adjusting the relative influence of certain navigational factors, decision-making factors, and/or by altering the logic utilized. Factors such as desired personal space and obstacle avoidance for example would vary within the confines of a queue line or crowded subway car compared with travel in open corridors. A region with a distracting element (i.e., window display, food vendor, etc.) might influence passing pedestrians by causing them to slow their preferred speed and/or adjust navigation behavior. In an area with limited space, a turn-taking behavior could be enforced to prevent a traffic jam.
Usher, Kolstad, & Lee Data collection: This attribute specifies that a node actively record data, based on pedestrians that pass within its node boundaries. The node may either be linked within the navigation network or exist as a stand-alone node defining a region such as a corridor identified for traffic analysis. The model configuration setup can request nodeand region-based statistics, such as number of pedestrians present, time of occupancy, and overall throughput to be maintained by the node to monitor current activity and for summary at the end of the simulation. Some of this data is also available for pedestrian decision-making, e.g. in the form of an observed queue line length and estimated wait time. Any pedestrian estimates, however, will be subject to variability in the form of added noise representing a degree of uncertainty. A representative list of the statistics logged for each pedestrian is given in Table 1. Table 1. Pedestrian information collected by a data collection node. • Total time in system (birth to death) • Actual distance traveled overall • List of visited nodes (travel history) • Travel time between nodes • Pedestrian’s wait time in queue(s) • Service times for each resource • Levels of needs attributes (e.g., hunger, thirst, etc.) at entrance and exit • Frame-wise location and decision-factor output for analysis • Custom measures of influence and performance in relation to certain nodes • Pedestrian speed overall and on each segment of the route traveled As the practical influence and effects of a node are defined by the active attributes and features it has been given, individual nodes may combine several conceptual “attributes”, i.e. a node acting as a server may enforce a regionbased entry requirement, collect statistics and enact usual route-based decision via several exit links. This permits a broad and flexible range of operation be implemented for any particular node within the system model. While the node at the beginning of a queue, for example, would often be set to enact a single-pedestrian capacity and encourage directed movement ahead along the path, the notion that it is an “entrance to a queue” does not impose particular limits on other behaviors, and may simply provide additional assessment information for higher-level route decision logic.
8. Implementation Examples This section illustrates the use of the network framework to simulate some of the common features within an intermodal facility. 8.1 Ticket Counter A simple ticket counter, as seen in Figure 2, can be constructed as follows. An initial node at the entrance of a queue (marked as a “queue entry” node, with a capacity of 1) could be associated with a region-based statistics node for collecting data on line length and estimated wait time. That would be connected with a sequence of nodes within several line barriers, an exit node attached to one or more ticket resource server nodes (with respective capacities, service time distributions, resource types, etc), and finally linked to another navigation node for departure. A node region space in front of the counter might likewise enact a waiting behavior if occupied or no ticketing resources were available. 8.2 Security Gate The security gate area in Figure 4 includes a main entry node connected to several queue lines, each with a current occupancy and capacity limit, with connected nodes leading up to the entrance nodes(s) proper, which connect to a set of intermediary and exit nodes. The security area’s overall region will not permit entry without a valid ticket and boarding pass. The three nodes at the entrances to the queues (Q1-Q3) have a similar requirement, and also provide detail on their current and maximum capacity for decision-making purposes. Q3 might have an added conditional entry requirement, e.g. for flight crew status or passengers needing assistance in processing.
Usher, Kolstad, & Lee
Figure 4: Network structure with navigational extent region hints added for nodes and connecting paths 8.3 Food Court A food court might be comprised of multiple queue lines attached to food and drink resources, which have exits going back to the larger court area. This area in turn may have seating resources with several available positions (that pedestrians occupy for a time, as required to eat) and perhaps a capacity-limited node surrounding the court that enforces a region-based occupancy overall. 8.4 Restroom Resources as such restrooms would simply require a node associated with the entrance having an occupancy limit, potentially with a separate exit node to encourage flow of traffic. This entrance node would similarly be tagged such that pedestrians entering do not appear visibly but instead “park” outside of the active simulation.
9. Navigational Decision-Making Provided a navigation network of nodes with such attributes, the following traversal criteria (relative to current node status) are now possible for consideration by the pedestrian to decide upon their present course of action: • • • • • • •
When the proximate node is a point with multiple decision choices, what are the currently navigable nodes connected to resources of interest? If the next planned node acts as a server, is its region clear and available for use? When an upcoming node is a queue entry node, which point is its matched queue exit node (ticketing area)? When the next node is a queue entrance, how many people in the queue (i.e. to estimate wait time)? Which related resource nodes should be obtained [in sequence] to properly satisfy a resource need (e.g., selection of ticketing Kiosks, Counters, Kiosk-to-Counter-to-TSA, Counter-to-TSA, etc.) When a pedestrian has completed use of a server node, what is the exit node link and behavior (e.g. leaving the ticketing area)? The next single-linked point may be the exit point; otherwise it would need to be flagged Is it viable to traverse a node region when it is conditional use zone (permitting occupancy under certain conditions, such as capacity limits) or may have a region of effect (whereby certain travel factors are affected)?
Given these capabilities, the ISAPT system is able to support the simulation of a wide variety of services offered within intermodal facilities along with the pedestrian traffic that results.
Usher, Kolstad, & Lee
10. Summary ISAPT provides the means to simulate intelligent, agent-based behavior model via individuals’ reactions to their environment, based on observed real-world behavior. Data obtained in both experimental trials and on-site study of real-world facilities have been incorporated in the modeling process – including route-based decision logic. The location and availability of resources in a structured node network that are central to how pedestrians interact with the larger system, in obtaining their planned objectives and choosing a preferred course of action from moment to moment. The flexible array of node-based attributes in the ISAPT system is designed to enable a broad range of possible resource configurations and behaviors, without imposing notable limits on design. Apt resources matching real-world structures and facility-specific data may be constructed with a model-appropriate set of attributes. We are presently involved in site studies and modeling of several transportation facilities and experimental scenarios, focused on inter-modal facilities and pedestrian traffic through common areas. The network-based attributes that have been discussed here are subject to further expansion, as it becomes apparent that additional functionality is useful towards certain modeling tasks and with varied facility types. Current and future applications will utilize these to define their own unique system of interconnected resource nodes to model additional facilities.
Acknowledgements This project is sponsored by the U.S. Department of Transportation (Grant No. DTOS59-06-G-00041).
References 1. 2.
3. 4. 5. 6. 7. 8. 9.
Pelechano, N., Allbeck, J.M. and Badler, N.I., 2007, “Controlling Individual Agents in High-Density Crowded Environments,” Eurographics/ ACM SIGGRAPH Symposium on Computer Animation. Kirchner, A., Namazi, A., Nishinari, K. and Schadschneider, A., 2003, “Role of Conflicts in the Floor Field Cellular Automaton Model for Pedestrian Dynamics. 2nd International Conference on Pedestrians and Evacuation Dynamics, 51-62. Helbing, D., Farkas, I., and Vicsek, T., 2000, “Simulating Dynamical Features of Escape Panic,” Nature. 407:487-490. Williams, S, and Huang, D., 2006, “A Group Force Mobility Model” The 9th Communications and Networking Simulation Symposium. Blue, V.J., and Adler, J.L., 2001, “Cellular automata microsimulation for modeling bidirectional pedestrian walkways,” Trans. Res. Part B: Methodological, 35(3), 293-312. Bierlaire, M., Antonini, G. and Weber, M. 2003, “Behavioral dynamics for pedestrians,” In Moving through nets: the physical and social dimensions of travel, Elsevier. Antonini, G., Bierlaire, M., and Weber, M., 2006, "Discrete choice models of pedestrian walking behavior". Transportation Research Part B: Methodological, 40(8):667-687. Usher, J.M., and Strawderman, L., "Simulating Operational Behaviors of Pedestrian Navigation," Computers and Industrial Engineering, 59, 2010, 736-747. Usher, J.M., Kolstad, E., and Liu, X., “Simulation of Pedestrian Behavior in Intermodal Facilities,” Int. J. of Agent Technologies and Systems, 2(3), July-Sept 2010, 66-82.