Haar wavelets are used to denoise data represented by vectors of match scores, and standardized statis- tical moments (skewness and kurtosis) are maximized ...
A New Adaptive Combination Approach to Score Level Fusion for Face and Iris Biometrics Combining Wavelets and Statistical Moments Nicolas Morizet1 and J´erˆome Gilles2 1
´ Department of Electronics, Institut Sup´erieur d’Electronique de Paris (I.S.E.P.) Department of Space Observation Intelligence (SOI) and UAV, French MoD
2
Abstract. In this paper, we present a new combination technique to fuse scores deriving from face and iris biometric matchers. Based on a precise statistical analysis of bootstrapped match scores deriving from similarity matrices, we show the utility of wavelet denoising on normalized scores. Then, we use an adaptive fusion rule based on the maximization of a cost function combining user-specific weights, a separation distance and statistical moments. Experiments are conducted on FERET and CASIA databases and results show that our proposed method outperforms by 70% some of the best current combination approaches in terms of Equal Error Rates (EER), and reaches a Genuine Accept Rate (GAR) equals to 100% at a False Accept Rate (FAR) of 7 × 10⁻⁴ %.
1
Introduction
In multi-biometric systems, the key issue is the fusion method. Among the different levels of fusion [1], score level fusion has been very studied; most probably because fusing scores at this stage allows a parallel development of each unibiometric system and offers a good tradeoff between richness of information and ease of implementation. At that level, Many fusion techniques have been proposed so far: these methods include classification approaches such as neural networks, k-nearest neighbor, classification tree, SVM and simple combination approaches such as min rule, max rule and sum rule [2]. The purpose of this paper is to contribute a new adaptive combination approach to score level fusion, introducing a new method called Wavelet Score Denoising (WSD). Haar wavelets are used to denoise data represented by vectors of match scores, and standardized statistical moments (skewness and kurtosis) are maximized to increase the separation between genuine and impostor scores, thus improving the global performance of the multimodal biometric system. The remainder of this paper is organized as follows: first, in section 2, we will discuss about the use of chimeric users in multibiometrics. In section 3, the construction of face and iris similarity matrices will be introduced. Statistical analyses of score distributions will be discussed in section 4. Wavelet score denoising theory will be explained in section 5 and the proposed adaptive fusion rule will be detailed in section 6. Then, some experiments and results will be described in sections 7. Finally, a conclusion will be drawn and future work will be presented. G. Bebis et al. (Eds.): ISVC 2008, Part II, LNCS 5359, pp. 661–671, 2008. c Springer-Verlag Berlin Heidelberg 2008 �
662
2
N. Morizet and J. Gilles
On the Use of Chimeric Users in Multibiometrics
The first problem we are facing when working on multi-biometrics is the lack of real-user databases. As far our knowledge is concerned, except the very recent MBGC Database [3], there are no free available multimodal real-user database combining face and iris modalities. However, there exist two well established datasets for face and iris images (cf. section 3), thus implying the combination of biometric modalities from different databases, which result in the creation of chimeric users (i.e. virtual subjects created with biometric traits of different users) [4], [5]. Such an arbitrary assignment is a commonly used practice in the multimodal literature, and was questioned during the 2003 Workshop on Multimodal User Authentication (MMUA) [6]. At least two arguments (first one is technical, the second one is ethical) may justify the use of chimeric users; modality independence assumption: two or more biometric traits of a single person are often assumed independent of each other (a demonstration using face and speech classifiers can be found in [7]). Moreover, it seems practically impossible to find a face image based on an iris texture, thus there is probably very little correlation between face and iris modalities (e.g. identical twins have four different irises). Privacy issue: participants in the multimodal biometric experiments are often not ready to let institutes keep record of too much of their personal information at the same place. Besides, it has been shown [8] that a fusion operator derived from a chimericuser database does not improve nor degrade the generalization performance (on real users) with respect to training it on real users. The advantage, however, is that much more training data can be artificially generated thus in this way it can overcome the lack of training data. More recently, experiments and results deriving from [9] show that, in most cases, the usage of virtual persons leads to lower accuracy than the usage of real users in terms of EER, and the creation of virtual multimodal databases by usage of well known single and/or multimodal data for biometric evaluations is encouraged.
3
Face and Iris Similarity Matrices
A common way to work at the score level is the use of similarity matrices which contain scores deriving from biometric matchers [10]. The Face Similarity Matrix (FSM) has been generated from the FERET Face Database [11], using the FERET Training Set, the FERET FA Gallery Set and the FERET FB Probe Set. Face preprocessing has been performed according to the CSU System v5.0 [12]. To generate match-scores, the Log-Gabor PCA (LGPCA) face recognition algorithm [13] has been implemented and the Mahalanobis Cosine (MahCosine) similarity measure [14] has been computed for each probe-gallery pair. Finally, The FSM is of size of (1193 × 1193). The Iris Similarity Matrix (ISM) has been generated from the CASIA Iris Image Database v3.0 (CASIA-IrisV3-Interval Set) [15]. Iris signatures are (512 × 1) vectors whose coefficients are −1, 0 or 1, deriving from a 3-level wavelet packets
A New Adaptive Combination Approach to Score Level Fusion
663
analysis on unwrapped iris images [16]. We could have generated 338 different classes, five iris signatures per class: three for the target set (leading to 1014 target signatures) and two for the query set (leading to 676 query signatures). In order to correct eye rotation effect (from −15o to +15o ), 31 circular shifts → − (one shift per angle unit) are performed on each query iris signature Q before computing a combined cosine similarity measure (1): � − � → − → → − − → 1 � Q Pi · T Pi , (1) Sccos ( Q , T ) = → − → − 2 � Q Pi � × � T Pi � i={2,10}
→ − → − where Q Pi and T Pi denote the query and target iris signatures of the ith wavelet packet Pi , respectively, and �.� is the Euclidean (L2 -) norm. Eye rotation effect is corrected by keeping the highest similarity measure among all the circular shifts as the match score. This leads to an iris similarity matrix of size of (676 × 1014). We randomly kept one row out of two (random query subject) and one column out of three (random target match) to obtain a final ISM of size of (338 × 338).
4
Statistical Analyses of Score Distributions
Prior to wavelet denoising, the objective of this preliminary step is to consistently model impostor score distributions for both modalities. We wish to demonstrate that, under a specific normalization condition, impostor scores can be assimilated to Gaussian white noise. Assume we have a (n × n) similarity matrix, there are n × (n − 1) impostor scores and n genuine scores. Since estimates of the score distributions may be erroneous if n is too small, we used the standard bootstrap resampling technique [17] in order to have better statistical estimations. This bootstrap method allows the construction of a number of resamples of the observed dataset (and of equal size to the observed dataset), each of which is obtained by random sampling with replacement from the original dataset. A common problem is the number of bootstrap repetitions, denoted as B, to be employed. To determine a suitable value of B, we have followed the three-step method described in [18]. We specify a bound on the relevant percentage deviation, denoted pdb, and we require that the actual percentage deviation be less than this bound with a specified probability, 1 − τ , close to one. This three-step method takes pdb and τ as given and specifies a data-dependent method of determining a value of B, denoted B*, such that the desired level of accuracy is obtained. For instance, when (pdb, τ ) = (10, 0.05), the three-step method yields a value of B* such that the relevant percentage deviation is less than 10% with approximate probability 95%. For each original similarity matrix (FSM and ISM), a training matrix whose size is 40% of the size of the original similarity matrix is randomly extracted. Then, impostor scores are bootstrapped with the specific parameters (pdb, τ ) = (2, 0.01). Impostor score distribution is computed and fit(x−μ)2
ted with a Gaussian curve (y(x) = σ √1 2π e− 2σ2 ), using a linear least-squares fitting procedure. Finally, to quantify the quality of the fit, the linear Pearson’s
664
N. Morizet and J. Gilles
(1.a)
(1.b)
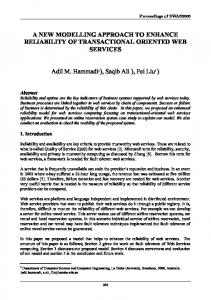
Fig. 1. Distributions of bootstrapped face impostor scores (1.a) and iris impostor scores (1.b) deriving from random training similarity matrices. The solid curve fitting in the histograms is a Gaussian distribution. Table 1. Statistical Analyses for Face and Iris Scores
Original Size Random Training Matrix Size Bootstrap Repetitions (B* ) Impostor Bootstrapped Scores Gaussian Fit Parameters (μ, σ) Linear Pearson’s Correlation Coefficient (R) Estimates of location and scale parameters after Z-Score normalization (μ, σ)
Face Iris FSM: (1193 × 1193) ISM: (338 × 338) (477 × 477) (135 × 135) 121 751 27, 473, 292 13, 585, 590 (−0.005, 0.054) (0.685, 0.018) 0.998 0.996 (−0.012, 0.976)
(0.038, 0.920)
correlation coefficient [19], denoted as R (R ∈ [0, 1], R = 1 corresponds to a perfect fit) is computed. The figure 1 depicts the score distributions for face and iris modalities and Tab. 1 summarizes the results of the different steps for face and iris modalities. Impostor score distributions (several million scores) from Fig. 1 are very close to Gaussian distributions, which is confirmed by the values of R in Tab. 1 (even if we can notice that Fig. 1.a depicts a slightly right-skewed distribution). A Z-Score normalization (which transform scores so as to have a zero mean and a standard deviation of one) can thus be performed since it is optimal for Gaussian data [20]. Moreover, according to [21], a random process εt can be considered as Gaussian white noise if ∀t �= τ, E[εt ετ ] = 0 (i.e. Autocorrelation is zero everywhere except at the origin) and εt ∼ N (0, 1) (normal distribution). Whereas the former condition is validated by observing Fig. 2, the latter is also validated thanks to the Z-Score normalization. In practice, the score normalization step must be performed on the whole similarity matrix (taking into account genuine scores) and not only on impostor scores. However, this leads to minor changes in estimates of location and scale parameters for both distributions (cf. last row
A New Adaptive Combination Approach to Score Level Fusion
(2.a)
665
(2.b)
Fig. 2. Autocorrelations of face (2.a) and iris (2.b) impostor scores. 106 random samples have been extracted from previous distributions where the Z-Score normalization has been performed. In insets, ∀t �= τ, E[εt ετ ] ≈ 0.3% of the maximum amplitude.
of Tab. 5). Finally, to a first approximation, we have demonstrated that Z-Score normalized impostor scores for both modalities can be assimilated to Gaussian white noise, which is a necessary condition for wavelet denoising.
5 5.1
Wavelet Score Denoising (WSD) Wavelet Denoising Theory
Donoho and Johnstone [22] proposed a method for reconstructing an unknown iid
function f on [0, 1] from noisy data: di = f (ti )+σzi , i = 0, ..., n−1, ti = i/n, zi ∼ N (0, 1), where N (0, 1) is a Gaussian white noise, σ the noise level. In our case, a row vector of scores f can be seen as a realization of a random process involving the calculation of similarity scores between biometric signatures, where the noisy data are represented by impostor scores. The reconstruction fˆn∗ is defined in the wavelet domain by translating � all the empirical wavelet coefficients of d towards 0 by an amount of T = σ 2log(n), called universal threshold of Donoho, where σ and n are the noise level and the noise samples length, respectively. Practically, we need to efficiently estimate the noise level σ. A common method is the use of the median absolute deviation (MAD) [23], but when the score distribution is not perfectly Gaussian, median and MAD are poor estimates of the location and scale parameters [20]. Thus, better estimates may be obtained using the usual arithmetic standard deviation. Finally, wavelet denoising can be performed using “soft-thresholding” of “hard-thresholding” methods [24]. 5.2
Wavelet Score Denoising Framework
The idea behind using wavelet denoising theory on match scores is to improve the global GAR and EER of the multimodal biometric system by keeping
666
N. Morizet and J. Gilles
genuine scores as high as possible and decrease impostor scores as much as possible. Since we have demonstrated that impostor scores can be assimilated to Gaussian white noise, we are now able to use wavelet denoising theory on the vectors of scores. Some interesting conclusions are drawn � in [25]: we can modify the universal threshold of Donoho into this one: T = κσ log(n), where κ is a tuning coefficient and universal threshold performed with the “hardthresholding” method leads to better denoising results. Besides, the universal threshold can be improved for various purposes and lower thresholds are better if one wants to measure performance by mean-squared error [26]. Our framework is as follows: a 1D-multilevel wavelet decomposition (2 levels, “haar” wavelet) is performed on row vectors of scores and, at each scale, the noise level of scores is estimated using the usual arithmetic standard deviation and � the lower modified universal threshold T = κσ log(n) is computed, tuning κ to 0.92. Finally, the hard-thresholding method is applied and wavelet coefficients are then transformed back in the “score domain”. We can appreciate the consequence of the wavelet hard-thresholding in Fig. (3) which clearly show that the amplitude of the user’s genuine score remains high whereas the amplitudes of the impostor scores decrease. This last result may be seen as a efficient preprocessing for row vectors of scores and contribute to improve the global performance of the multimodal biometric system, even before applying the fusion rule.
(3.a)
(3.b)
(3.c)
(3.d)
Fig. 3. Illustration of the WSD method performed on vectors of face and iris scores for a given user. Original face (3.a) and iris (3.c) scores, denoised face (3.b) and iris (3.d) scores.
A New Adaptive Combination Approach to Score Level Fusion
6
667
User-Specific Weighted Sum Rule Using Statistical Tradeoff
In order to improve simple combination rules and the user-specific weighted sum rule [27], we present here a new adaptive user-specific fusion rule using statistical tradeoff. In a biometric system, the smaller the overlap between impostor and genuine scores (Fig. 4.a), the better the recognition rate. Thus, if we want to improve the global recognition rate of a biometric system, we can increase, for each user, the separation between impostor and genuine score distributions. Therefore, for each user, we maximize a cost function combining three parameters: a separation distance, skewness and kurtosis [28] of impostor score distributions. 6.1
The Separation Distance (Δ)
This first parameter is simply the distance between the impostor score distribution and the user’s genuine score (Fig. 4.b). Maximizing this separation distance contributes to minimize the overlap area previously introduced. 6.2
Skewness: The Third Standardized Moment (γ1 )
Skewness is a measure of the asymmetry of the probability distribution of a realvalued random variable X, having a mean μ and a standard deviation σ (2). γ1 = Skew(X) =
E[(X − μ)3 ] , σ3
(2)
If the left tail (tail at small end of the distribution) is more pronounced that the right tail (tail at the large end of the distribution), the function is said to have negative skewness. If the reverse is true, it has positive skewness. If the two are equal, it has zero skewness (Fig. 5.a). According to Fig. 4.a, we want the skewness of the impostors distribution to be the most positive. This may be performed by maximizing γ1 .
(4.a)
(4.b)
Fig. 4. Illustrations of FRR and FAR in a biometric system (4.a) and separation distance for a given user (4.b)
668
N. Morizet and J. Gilles
(5.a)
(5.b)
Fig. 5. Illustrations of skewness (5.a) and kurtosis (5.b)
6.3
Kurtosis: The Fourth Standardized Moment (γ2 )
Kurtosis is a measure of the peakedness of the probability distribution of a realvalued random variable X, having a mean μ and a standard deviation σ (3). E[(X − μ)4 ] , (3) σ4 A high kurtosis distribution has a sharper “peak” and flatter “tails”, while a low kurtosis distribution has a more rounded peak with wider “shoulders” (Fig. 5.b). According to Fig. 4.a, we want the kurtosis of the impostors distribution to be the most positive (leptokurtic). This can be done by maximizing γ2 . γ2 = Kurt(X) =
6.4
Proposed Fusion Rule
Let Sf ace,i and Siris,i be the ith wavelet denoised row vectors of face and iris similarity matrices, respectively. Let w1,i and w2,i be the weights of face and iris modalities, respectively, for the ith user. We vary w1,i and w2,i over the range 1 and with the constraint w1,i + w2,i = 1. [0, 1], with a sampling rate of 100 th For the i user and for each pair of weights (w1,i , w2,i ): 1. We compute the fused score (4): Sf used,i = w1,i × Sf ace,i + w2,i × Siris,i ,
(4)
Since we work with similarity scores, the genuine score is assumed to be equal to max(Sf used,i ), the remaining scores being the impostor scores. 2. Then, we compute the separation distance between the genuine score and the highest impostor score (5): Δi = max(Sf used,i ) − max(impostor scoresi ) ,
(5)
3. We also estimate γ1 (2) and γ2 (3) of the impostor scores distribution. Then, we find the index ki ∈ [0, 1], defining the best pair of weights W1,i and W2,i (6) such as: ki = arg max (Δi ∗ γ1 ∗ γ2 ) , The i
th
(6)
final fused score is expressed as follows (7): Sf inal
f used,i
= W1,i × Sf ace,i + W2,i × Siris,i .
(7)
A New Adaptive Combination Approach to Score Level Fusion
7
669
Experiments and Results
We followed the testing framework described in [29], allowing the conduction of normalization and fusion technique evaluations. Since the FSM is bigger than the single ISM, three different (338 × 338) submatrices deriving from the FSM have been extracted to consistently fuse scores. For each FSM submatrix and for each user (i.e. each row), we applied the WSD method described in subsection 5.2 and performed the fusion rule detailed in section 6. Mean EER (along with standard errors) of different normalization methods and fusion rules have been computed for the final fused similarity matrices (Tab. 2) and ROC curves have been drawn (Fig. 6) to compare the performance of our fusion technique to the current best combination approches [27] for the sum rule. The figure 6 expresses the GAR with respect to the FAR, i.e. the true recognition rate for different security levels (the smaller the FAR, the higher the security level). Our technique needs the Z-Score normalization to work since it is the only method for assimilating impostor scores to a normal distribution, which is a necessary Table 2. Mean EER (%)(Standard errors) Normalization Fusion Rule Method Min Max Sum Proposed MinMax 3.005 (0.0005) 0.284 (0.0006) 0.040 (0.0002) N/A Z-Score 1.439 (0.0039) 0.225 (0.0016) 0.033 (0.0002) 0.010 (0.0001) QLQ 3.026 (0.0013) 0.286 (0.0006) 0.040 (0.0002) N/A
Genuine Accept Rate [GAR]
1
0.995
0.99
0.985 Z−Score+Proposed Z−Score+Σ QLQ+Σ MinMax+Σ
0.98
0.975
−4
−3
−2
10 10 10 False Accept Rate [FAR] (%)
−1
10
Fig. 6. ROC curves. Our method (upper curve) has the best GAR at high levels of security, compared to one of the best current combination approaches. The proposed method is the only one to reach 100% recognition rate at F AR = 7 × 10⁻⁴ %.
670
N. Morizet and J. Gilles
condition to wavelet denoising theory. The other score normalization methods are not able to transform scores into a normal distribution. The proposed method has the smallest standard error and outperforms by 70% the “Z-Score / Sum Rule” and by 75% the “QLQ / Sum Rule”, which are considered to be one of the best current combination approaches to score level fusion [27].
8
Conclusion and Future Work
First, statistical analyses have been conducted on bootstrapped scores deriving from FERET and CASIA similarity matrices. Then, we demonstrated that, for both modalities, Z-Score normalized impostor scores can be assimilated to Gaussian white noise and, thus, can be denoised using wavelets. We proposed a new adaptive combination technique that maximizes the separation between impostors and genuines, using statistical moments. This technique is user-specific and takes into account the shapes of score distributions to improve the global recognition rate of the multi-biometric system. The proposed method appears as a flourishing candidate over actual combination approaches, as underlined by the promising results. Directions for future work include studying the performance gain due to each variable Δ, γ1 , γ2 , and testing our method on the MBGC realuser database for comparisons purposes with virtual users to see the impact on performances in terms of GAR and EER.
Acknowledgements Portions of the research in this paper use the FERET database of facial images collected under the FERET program, sponsored by the DOD Counterdrug Technology Development Program Office; and the CASIA-IrisV3 collected by the Chinese Academy of Sciences Institute of Automation (CASIA). The authors are grateful for helpful comments from T. Ea, B. Giraud and for invaluable theoretical advices in several work sessions from Y. Meyer.
References 1. Nandakumar, K.: Integration of multiple cues in biometric systems. PhD thesis (2005) 2. Ma, Y., Cukic, B., Singh, H.: A classification approach to multi-biometric score fusion. In: AVBPA, pp. 484–493 (2005) 3. N.I.S.T., U.N.D.: Multiple biometric grand challenge (mbgc) database (2008), http://face.nist.gov/mbgc 4. Dorizzi, B., Garcia-Salicetti, S., Allano, L.: Multimodality in biosecure: Evaluation on real vs. virtual subjects. In: ICASSP, p. V (2006) 5. Garcia-Salicetti, S., Anouar, M.M., Allano, L., Dorizzi, B.: A generic protocol for multibiometric systems evaluation on virtual and real subjects. In: AVBPA, pp. 494–502 (2005) 6. Dugelay, J.L., Junqua, J.C., Rose, K., Turk, M.: Workshop on multimodal user authentication. In: MMUA, Santa Barbara, CA, USA (2003)
A New Adaptive Combination Approach to Score Level Fusion
671
7. Kittler, J., Hatef, M., Duin, R., Matas, J.: On combining classifiers. IEEE Transactions on Pattern Analysis and Machine Intelligence 20, 226–239 (1998) 8. Poh, N., Bengio, S.: Using chimeric users to construct fusion classifiers in biometric authentication tasks: An investigation. Technical report (2005) 9. Scheidat, T., Vielhauer, C.: Analyzing a multimodal biometric system using real and virtual users. In: Security, Steganography, and Watermarking of Multimedia Contents IX. Proceedings of the SPIE 2007, vol. 6505 (2007) 10. Morizet, N., Amara, A.: Wavelet domain match score level fusion for multimodal biometrics. In: Proceedings of International Conference on COGnitive systems with Interactive Sensors (COGIS). Stanford University, Palo Alto (2007) 11. Phillips, P.J., Moon, H., Rizvi, S.A., Rauss, P.J.: The feret evaluation methodology for face-recognition algorithms. IEEE TPAMI 22, 1090–1104 (2000) 12. Bolme, D.S., Beveridge, J.R., Teixeira, M., Draper, B.A.: The csu face identification evaluation system: Its purpose, features, and structure. In: ICVS, pp. 304–313 (2003) 13. Perlibakas, V.: Face recognition using principal component analysis and log-gabor filters (unpublished manuscript, 2006) 14. Beveridge, J.R., Bolme, D.S., Teixeira, M., Draper, B.A.: The csu face identification evaluation system user’s guide: Version 5.0. Technical report, Colorado State University (2003) 15. CASIA: Casia-irisv3 database (2005), http://www.cbsr.ia.ac.cn/IrisDatabase.htm 16. Rydgren, E., Ea, T., Amiel, F., F., Rossant, A.A., Amara, A.: Iris features extraction using wavelet packets. ICIP 2, 861–864 (2000) 17. Zoubir, A.M., Iskander, D.R.: Bootstrap methods and applications, a tutorial for the signal processing practitioner. IEEE Signal Processing Magazine 24, 10–19 (2007) 18. Andrews, D.W.K., Buchinsky, M.: A three-step method for choosing the number of bootstrap repetitions. Econometrica 68, 23–52 (2000) 19. Edwards, A.L.: 4, The Correlation Coefficient. In: An Introduction to Linear Regression and Correlation, pp. 33–46. W. H. Freeman and Co. Ltd., New York (1976) 20. Jain, A.K., Nandakumar, K., Ross, A.: Score normalization in multimodal biometric systems. Pattern Recognition 38, 2270–2285 (2005) 21. Hamilton, J.D.: Time Series Analysis. Princeton University Press, Princeton (1994) 22. Donoho, D.L., Johnstone, I.M.: Ideal spatial adaptation by wavelet shrinkage. Biometrika 81, 425–455 (1994) 23. Sachs, L.: Applied Statistics: A Handbook of Techniques, p. 253. Springer, Heidelberg (1984) 24. Merry, R.J.E.: Wavelet theory and applications - a literature study. Technical report, Eindhoven University of Technology (2005) 25. Gilles, J.: D´ecomposition et d´etection de structures g´eom´etriques en imagerie. PhD ´ thesis, Ecole Normale Sup´erieure de Cachan (2006) 26. Coifman, R.R., Donoho, D.L.: Translation-invariant de-noising. Technical report, Stanford University (1995) 27. Ross, A.A., Nandakumar, K., Jain, A.K.: Handbook of Multibiometrics. Springer, New York (2006) 28. Press, W.H., Flannery, B.P., Teukolsky, S.A., Vetterling, W.: 14.1, Moments of a Distribution: Mean, Variance, Skewness, and So Forth. In: Numerical Recipes in FORTRAN: The Art of Scientific Computing, 2nd edn., pp. 604–609. Cambridge University Press, Cambridge (1992) 29. Snelick, R., Indovina, M., Yen, J., Mink, A.: Multimodal biometrics: issues in design and testing. In: ICMI, pp. 68–72 (2003)