1 OCTOBER 2006
DIAO ET AL.
4819
A New Blocking Index and Its Application: Blocking Action in the Northern Hemisphere YINA DIAO State Key Laboratory of Estuary and Coastal Research, East China Normal University, Shanghai, and Physical Oceanography Laboratory, College of Physical and Environmental Oceanography, Ocean University of China, Qingdao, China
JIANPING LI LASG, Institute of Atmospheric Physics, Chinese Academy of Science, Beijing, China
DEHAI LUO Physical Oceanography Laboratory, College of Physical and Environmental Oceanography, Ocean University of China, Qingdao, China (Manuscript received 24 April 2005, in final form 10 January 2006) ABSTRACT In this paper, a new two-dimensional blocking index is proposed by defining a difference between the daily 500-hPa geopotenial heights at the reference latitude and its north side. The reference latitude is determined by a composite latitude-dependent 500-hPa geopotenial height of blocking events in different seasons and sectors. The new index can take account of the duration, intensity, propagation, and spatial structure of a blocking event. Using this index, the characteristics (frequency, duration, intensity, and preferred occurrence region) of the blocking action in the North Hemisphere (NH) are investigated using a 42-yr sample of blocking events from the NCEP–NCAR reanalyses. It is found that blocking events in the NH are more frequent in the Atlantic–Europe sector than in the Pacific sector in winter and spring and autumn, but more persistent in the Atlantic–Europe sector than in the Pacific sector for all seasons. Blocking events in the Pacific sector tend to have larger amplitudes than the Atlantic counterparts. In addition, it is shown that in the NH independently occurring blocking events are most frequent, but simultaneously occurring blockings are rather rare, indicating that the blocking events in the NH should be a local phenomenon. On the other hand, a comparison with the existing indices [e.g., Tibaldi and Molteni (TM) index] indicates that in summer and autumn the new index shows similar longitudinal dependency of NH blocking events as does the TM index, but it shows two distinct action centers of blocking events in the Atlantic sector in winter and spring (in which the most frequent one is situated more westward) and an eastward blocking action center in the Pacific sector in spring and autumn, compared to the TM index. In addition, it is found that the new blocking index proposed here shows relatively low blocking frequency for all seasons compared to the TM index, especially in the Atlantic sector in spring and in the Pacific sector in winter and spring, which seems to be in agreement with the result obtained by Pelly and Hoskins using the PV– index.
The persistency of blocking events interrupts the midlatitude westerlies, steers the track of midlatitude cyclones (deviating from its prevailing west–east direc-
tion), and results in anomalous weather (Berggren et al. 1949). To understand the behavior of blocking events, a technique is needed to identify blocking events. Rex (1950a) presented a widely used criterion of blocking cases from subjective map analysis. He defined blockings events in the 500-hPa geopotential field to satisfy the following conditions:
Corresponding author address: Prof. Dehai Luo, Physical Oceanography Laboratory, College of Physical and Environmental Oceanography, Ocean University of China, Qingdao 266003, China. E-mail:
[email protected]
(i) The basic westerly current must split into two branches. (ii) Each branch current must transport an appreciable mass.
1. Introduction
© 2006 American Meteorological Society
JCLI3886
4820
JOURNAL OF CLIMATE
(iii) The double-jet system must extend over at least 45° of longitude. (iv) A sharp transition in the westerlies from a zonaltype flow upstream to a meridional type downstream must be observed across the current split. (v) The pattern must persist with recognizable continuity for at least 10 days. Afterward, objective indices are developed based upon this blocking definition, with some derived from the concept of a zonal index (Lejenäs and Økland 1983; Tibaldi and Molteni 1990, hereafter TM90; Tibaldi et al. 1994; Anderson 1993; Lupo and Smith 1995, hereafter LS95; Wiedenmann et al. 2002) identifying blocking as those with negative zonal wind near 50°N or a 500hPa geopotential height maximum around 60°N; some based on a pointwise definition identifying blocking as a persistent large positive height anomaly (Dole and Gordon 1983; Shukla and Mo 1983; Knox and Hay 1985); and, also, some defined solely by eddy fields finding out the blocking candidate points within a region bounded by a southerly/northerly wind upstream/ downstream with given strength (Kaas and Branstator 1993; Cash and Lee 2000). Recently, a potential vorticity–potential temperature (PV–) index was developed by Pelly and Hoskins (2003) to identify blocking events, using a meridional difference on a PV surface. Based on the subjective and objective definitions of blocking, the climatology of blocking events has been widely studied from many aspects. The occurrence region of blocking events is a commonly discussed topic. Rex (1950b) found two major regions of blocking occurrence: the northeastern Atlantic and northeastern Pacific sectors, which are also confirmed by subsequent studies (e.g., Dole and Gordon 1983; Knox and Hay 1985; Lejenäs and Økland 1983; Tibaldi et al. 1994; LS95). Other regions, such as the Ural Mountains (near 60°E) and northeastern Canada (75°W), where blocking events occur relatively frequently, are also found (Dole and Gordon 1983; Knox and Hay 1985; Tibaldi et al. 1994). The occurrence of blocking events is also found to exhibit seasonal variability (Knox and Hay 1985), with frequencies of blockings highest in spring, especially over eastern Canada and the North Atlantic, but lowest in autumn. Tibaldi et al. (1994) found that the blockings exhibit a pronounced maximum over Europe around 10°–20°E in spring, but a maximum over the northeastern Pacific in winter. Lupo and Smith (1995) and Wiedenmann et al. (2002) found that blocking anticyclones are more intense and persistent during the cold season than their summer counterparts. Lupo (1997) also suggested that blocking is a local phenomenon by examining the dynamic connection between two
VOLUME 19
simultaneously occurring blocking cases in the Northern Hemisphere (NH). Recently, the interannual and interdecadal variabilities of blocking events and their relationship to the North Atlantic Oscillation (NAO) and El Niño–Southern Oscillation (ENSO) are also discussed (Shabbar et al. 2001; Wiedenmann et al. 2002). Although many blocking indices have been proposed to identify the duration, intensity, and occurrence location of blocking events (Lejenäs and Økland 1983; Dole and Gordon 1983; TM90; Pelly and Hoskins 2003), the most serious point of previous indices is that they cannot take account of the propagation and spatial structure of blocking events, thereby resulting in inconsistent conclusions for different indices. Moreover, some previous blocking indices identify teleconnection patterns, open ridges, or standing wave fluctuations as blocking events (Dole and Gordon 1983), but an examination of the full field shows nothing that a synoptician would label as a block (Cash and Lee 2000). Thus, improving the identification of blocking activity may be a useful task. In the present paper we will propose a new blocking index to identify the activity of blocking events in the NH and to track the temporal and spatial evolution of each blocking event during its life cycle. The key point of this index is to consider the “southernmost” latitude of blocking events as the reference latitude, which is different from the blocking indices of Lejenäs and Økland (1983, hereafter LO83) and TM90, who considered two or three prescribed latitudes as the central latitudes for computing the blocking index. In our new index, the given latitude used to compute the blocking index is considered to be continuous once the southernmost latitude of blocking is determined. The advantage of such a method is to be able to describe the two-dimensional evolution of blocking events compared to existing indices. This paper is organized as follows: In section 2, the data used for our study are introduced. In section 3, a new index of blocking is proposed to identify blocking activity and to track the evolution of a blocking event. Section 4 presents a procedure for identifying blocking events using the proposed new index. The action centers (the frequency and occurrence region) of blocking events in the NH are presented in section 5 based upon a 42-yr sample. A comparison with existing indices (e.g., the TM90 index) is presented in section 6. The intensity and duration of NH blocking events are shown in section 7 using the new blocking index. Conclusions and discussions end in section 8.
2. Data The dataset used in this study is the National Centers for Environmental Prediction–National Center for At-
1 OCTOBER 2006
4821
DIAO ET AL.
mospheric Research (NCEP–NCAR) gridded reanalyses. The 1200 UTC NCEP–NCAR reanalyses used here for the calculations are the 500-hPa gridded (2.5° ⫻ 2.5°) heights from December 1958 to December 2000. Four seasons of each year are defined as winter, from December to February; spring, from March to May; summer, from June to August; and autumn, from September to November. We present a 42-yr climatology study of the blocking action in the NH for each season using the new blocking index proposed in the next section, which enables us to automatically detect the frequency, preferred occurrence region, duration, and intensity of blocking events in the NH.
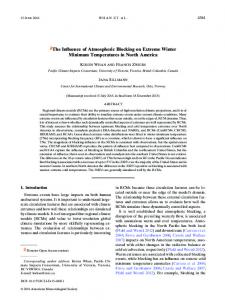
3. Method and definition of a new blocking index Figure 1 shows the 500-hPa geopotential height fields at the early and mature stages of a blocking event from 28 January to 9 February 1975 that occurred in the North Atlantic sector. It can be seen that a zonal westerly flow occupies most of the North Atlantic at the early stage (28 January) (Fig. 1a), but the large-scale westerly flow is strongly blocked over the North Atlantic at the mature stage (3 February 1975) (Fig. 1b). The climatological mean and instantaneous 500-hPa geopotential heights along 0° for the two stages are shown in Fig. 2. In the climatological mean the geopotential height decreases from lower latitude to higher latitude for the two stages of a blocking event. The instantaneous geopotential height in the early stage seems to exhibit a negative anomaly in the higher latitude and a positive anomaly in the lower latitude compared to the climatological mean height, but it exhibits a reversal at the mature stage of blocking (Fig. 2), which is also noted by Pelly and Hoskins (2003). To see if the result in Fig. 2b is tenable for other blocking events, a composite of blocking events is constructed for which details will be presented in the next section. A composite field of blocking events in the North Atlantic sector also shows a feature similar to that shown in Fig. 2b. The indices used widely in identifying blocking events are the LO83 and TM90 indices. The LO83 index is defined as the difference between the 500-mb geopotential heights at 40° and 60°N, but the TM90 index is a modification of this index, which is defined based upon two values of geopotential height gradient evaluated at each longitude (TM90; Tibaldi et al. 1994), GHGS ⫽
Z共0兲 ⫺ Z共s兲 , 0 ⫺ S
GHGN ⫽
Z共n兲 ⫺ Z共0兲 , n ⫺ 0
FIG. 1. Daily 500-hPa geopotential height fields on 28 Jan and 3 Feb 1975.
where n ⫽ 80°N ⫹ ⌬, o ⫽ 60°N ⫹ ⌬, s ⫽ 40°N ⫹ ⌬, and ⌬ ⫽ ⫺4°, 0°, or 4°. A given longitude is defined as “blocked” at a specific instant in time if the following conditions are satisfied for at least one of the three values of ⌬: GHGS ⬎ 0,
GHGN ⬍ ⫺10 m共deg lat兲⫺1.
4822
JOURNAL OF CLIMATE
FIG. 2. Geopotential height at 500-hPa with the latitude along longitude 0° on 28 Jan and 3 Feb 1975, in which the solid and dashed curves represent a 42-yr climatological mean and daily heights, respectively.
Although the LO83 and TM90 indices are able to identify blocking events, they cannot exactly describe the latitudinal distribution of the geopotential height in the blocking region (Fig. 2b) and cannot efficiently reflect the temporal and spatial evolution of a blocking process because only two or three latitudes are used to calculate the blocking indices. Thus, it is necessary to develop a new blocking index to identify the activity of blocking events. As shown in Fig. 2b, the blocking flow can be re-
VOLUME 19
flected by a difference between the geopotential heights in the higher latitude and appropriate lower latitude. One must first choose the appropriate low latitude as the reference latitude to calculate the height difference before a new blocking index is established. For an Omega-type block there should be a maximum of geopotential height in the blocking region, and correspondingly a minimum of the geopotential height exists at the south side of the block. This condition seems to be more easily satisfied for a dipole block because a cut-off low always exists at the south side of a closed high. The reference latitude is defined by the latitude where there is a minimum of the geopotential height at the south side of the high pressure center in the blocking region, as shown in Fig. 2b. Consequently, for a given longitude if the reference (southernmost) latitude of the blocking flow is determined, then the blocking pattern can be reflected by a region of the negative value of the height difference between the higher latitude and the reference latitude. However, it cannot account for open ridges because no closed high pressure exists. Of course, open ridges should be excluded as blocking events according to the definition of blockings. On the other hand, it must be pointed out that in our new blocking index the large-scale cut-off low can be probably thought of being a blocking event if it persists for 5 days or more. The reference latitudes, which are different for different seasons and geographic locations of blocking, can, to some extent, be determined by a composite of the 500-hPa geopotential height field of blocking events in different seasons and sectors. This composite shows the likely reference latitude of blocking events for different seasons and sectors in the NH. Thus, it is necessary to artificially separate the NH into several regions where blocking events are most active. The number of blocking events in each sector used for a composite is shown in Table 1, which is subjectively selected from the 42-yr dataset according to the criteria for blocking presented by Rex (1950a) and LO83, but with a persistence time of at least 5 days. At every day of each blocking event, the difference between the maximum and minimum geopotential heights along the latitude within the blocking region is first calculated at each longitude, and then the longitude where there is a maximum height difference is recorded. In this case, one can obtain the latitude-dependent geopoential height distribution and the reference latitudes through a composite of the geopotential heights of all blocking cases at the recorded longitude. The composite procedures are described as follows: For every blocking case we record the longitude R at every day according to
1 OCTOBER 2006
4823
DIAO ET AL.
TABLE 1. Number of blocking cases used for the block composite in different regions for each of the four seasons. Region Season
Atlantic (50°W–45°E)
Ural Mountains (50°–90°E)
Winter Spring Summer Autumn
118 104 64 75
30 25
R ⫽ h⫽max关hd 共兲兴, ∈ 共w, e兲, hd共兲 ⫽ hmax共兲 ⫺ hmin共兲,
共1a兲
hmax共兲 ⫽ max关h共, 兲兴,
共1c兲
hmin共兲 ⫽
共1d兲
min
关h共, 兲兴,
0ⱕⱕmax
where denotes the longitude, b is the latitude within the blocking region, max is the latitude where the geopotential height of the blocking flow has a maximum for each longitude, R is the recorded longitude, and w and e denote the longitudes at the west and east edges of the blocking area, respectively. In this case we define the composite height at the recorded longitude for the total blocking days of all blocking events in each of four the seasons as n
nc共k兲
兺 兺 关h共 , 兲兴 R
H共兲 ⫽
k⫽1 i⫽1 n
兺 nc共k兲
i
,
共2兲
k⫽1
where h(R, ) is the 500-hPa geopotential height at the recorded longitude R on each day, i varies from 1 to nc(k) in which nc(k) is the day number (duration) of the kth blocking case, and n denotes the total number of the blocking events. Here H() is the composite of the geopotential height at the recorded longitude. Figure 3 shows the composite results of H() for each of the four seasons. It is evident that H() for a com-
BIj共, , t兲 ⫽
再
h共, rj, t兲 ⫺ h共, , t兲, 0,
otherwise,
BI共, , t兲 ⫽ min 关BIj共, , t兲兴, j⫽1,2,3
Pacific (150°E–110°W)
37
共1b兲
∈b
East Asia–Okhotsk (90°–150°E)
共3b兲
where t denotes day, 90°N ⱖ ⱖ rj, 360° ⱖ ⱖ 0°, h(, , t) is the 500-hPa geopotential height at each day dependent on both longitude and latitude , and rj is
68 60 60 30
posite blocking for each season exhibits a maximum and a minimum of the geopotential height in the higher and lower latitudes, respectively. In other words, the anomaly of the blocking flow exhibits a dipole structure. In addition, we can see that in winter, spring, and autumn the Atlantic–European sector blocking events are shifted slightly more northward than the Pacific counterparts, which is also noted by Pelly and Hoskins (2003), who found that the Euro–Atlantic blockings tend to occur in higher latitudes than their Pacific counterparts. However, the NH blocking events in summer seem to be located in a higher-latitude band than in other seasons. Thus, the latitudes chosen as the reference latitude of blockings should depend upon the season and location of blocking events. In addition, Fig. 3 shows the most likely reference latitude for blocking events in the NH in winter, spring, autumn, and summer. It is obvious that the likely reference latitudes are dependent upon the season and geographic location of blocking events. Through calculating the difference between the 500-hPa geopotential heights in the higher latitude and the reference latitude, one can judge whether there is a high pressure system and a high-over-low (dipole) system to the north of the reference latitude. The subtropic high systems in the NH can be generally excluded because the likely reference latitude of blocking events in summer is located in the higher latitudes (poleward of 40°N) than in other seasons, as shown in Fig. 3. Following the above idea, we define a new blocking index at every day of a blocking event as if h共, , t兲 ⬎ h共, rj, t兲 and ⬎ rj
共3a兲
the chosen reference latitudes ranging from j ⫽ 1 to 3 at a given longitude. The choice of rj allows us to pick out an optimal BI for a given longitude because the reference latitudes for different blocking events could be slightly different. The value of BI at every day can be found once the
4824
JOURNAL OF CLIMATE
VOLUME 19
FIG. 3. Composite height as a function of latitude along the longitude where the maximum height difference exists for all the selected blocking days in (a) winter, (b) spring, (c) summer, and (d) autumn.
reference latitudes are determined. Three reference latitudes of blocking events in the NH at given season and geographic location are chosen near the latitude at which the composite latitude-dependent 500-mb geopotential height has a minimum (not so evident in winter, but the reference latitudes can be chosen in a similar manner) according to Fig. 3 and are shown in Table 2. Although the reference latitudes are dependent on the season and geographic location of blocking events, they are unlikely to depend upon the number of composite blockings for a given season and geographic location, as indicated in Fig. 4. This allows us to compute the instantaneous BI of each blocking event for a given
season and geographic location. Thus, the composite reference latitudes of blocking events, as described in Table 3, could provide a possibility of how we choose the reference latitudes of blocking events used for calculating the blocking index. It is noted that the BI can reflect the spatial evolution of blocking events because it is a two-dimensional index, as we will see later. Figure 5 shows the evolution of BI during the life cycle of a blocking event that occurred over the North Atlantic from 21 December 1992 to 8 January 1993. It is found that the region of negative BI (shaded area) can reflect the evolution of a blocking event (from 22
TABLE 2. Reference latitudes (°N) of blocking events in the NH in different seasons and sectors.
Atlantic, Europe, and Ural Mountains East Asia, Okhotsk Sea, and Pacific
Winter, spring, autumn
Summer
35°, 37.5°, 40° 32.5°, 35°, 37.5°
40°, 42.5°, 45°
1 OCTOBER 2006
4825
DIAO ET AL.
FIG. 4. Composite latitude-dependent height of blocking events in the Atlantic and Pacific sectors for different number of blocking cases.
December 1992 to 7 January 1993), which covers the most of the blocking area, especially in the mature phase. In this case, the blocking region can be crudely defined by the area of negative BI. If the negative BI area comprises two or three isolated areas, the blocking region is defined by the total area covering these isolated BI areas. Furthermore, the area and magnitude of the negative BI can more or less characterize the intensity of a blocking event. However, it must be pointed out that the index could represent Omega-type blocking (28 December 1992 in Fig. 5), but only the portion of the closed low to the south flank of the high pressure in the blocking region if a block exhibits a dipole structure (not shown). On the other hand, this index is able to efficiently identify the duration, movement, and location of a blocking event (see Fig. 5). To investigate the action centers of blocking events in the NH, one must at first present the definition of the duration and intensity of blocking events according to the new blocking index proposed here.
4. Identification procedure of blocking events by local persistent negative value of BI a. Temporal tracking procedure of a blocking event and its duration Since blocking flow can be reflected by the area of the negative BI, a blocking event can be detected by
tracking the negative BI area. However, for some blocking cases the obtained negative BI area within the blocking region is found to consist of two or three isolated negative BI areas, as shown in Fig. 5 (⬃22–24 December 1992 or ⬃7–19 January 1993). To conveniently track the blocking event the strongest (the minimum BI or the maximum |BI|) of the negative BI areas is chosen as a target. The amplitude of the negative BI for each isolated area within the blocking region is defined as M⬘i 共t兲 ⫽ max ⱍBI共, , t兲ⱍ, i ⫽ 1, 2, . . . , n, ,∈⍀i
where n is the number of the isolated negative BI areas within the blocking region and ⍀i is the area of each isolated area. The instantaneous amplitude, M⬘(t), of a blocking event is defined as the strongest one of M⬘i (t), that is, M⬘共t兲 ⫽ max 关M⬘i 共t兲兴.
共5兲
i⫽1,2,...,n
The procedures of identifying a blocking event are as follows: 1) The day when the area of the negative BI begins to appear and the instantaneous amplitude M⬘(t) is ⲏ50 gpm or more is defined as the onset day of a blocking event. 2) If the area of the negative BI on one day and its counterpart on the next overlap or if they are sepa-
TABLE 3. Key locations used for the composite of blocking events for four seasons. Winter Spring Summer Autumn
42.5°N, 5°W 42.5°N, 20°W 45°N, 15°W 42.5°N, 5°W
50°N, 60°E 52.5°N, 30°E 51.5°N, 30°E 50°N, 60°E
共4兲
45°N, 45°N, 50°N, 45°N,
155°W 115°W 60°E 120°W
55°N, 135°E
52.5°N, 130°W
4826
JOURNAL OF CLIMATE
VOLUME 19
FIG. 5. Evolution of the 500-hPa height field for a blocking event over the North Atlantic during the period from 21 Dec 1992 to 8 Jan 1993 and its corresponding area identified by the negative BI (shaded region).
1 OCTOBER 2006
DIAO ET AL.
rated but the relative distance is less than 10° longitude, we can consider the two days to be successive. For this case, the relative distance is defined as t⫹1 t⫹1 t t ⫹ xR ⫹ xR D ⫽ |共xL 兲Ⲑ2 ⫺ 共xL 兲Ⲑ2|,
共6兲
where xtL and xtR are the longitudes at the left and right edges of a area of the negative BI on day t, respectively. 3) The day when the amplitude M⬘(t) is smaller than 50 gpm is defined as the termination day of a blocking event. 4) The number of days of a persistent negative BI process between the onset and termination of an event is defined as the duration of this process. If the duration is equal to 5 days or longer this process is considered as a blocking event. The tracking of blocking events is also mentioned by the previous studies (Kaas and Branstator 1993; Sinclair 1996; Schwierz et al. 2004). Sinclair (1996) used a tracking scheme similar to the cyclone-tracking method to identify blocking events, but in Kaas and Branstator (1993) the blocking duration can be tracked according to a three-dimensional (longitude–latitude–time) cluster. More recently, Schwierz et al. (2004) identified the temporal coherence by requiring a specified percentage spatial overlap of the enclosed contours engulfing the negative value of the vertically averaged potential vorticity anomaly. For our tracking method, the temporal coherence is identified by requiring the overlap of negative BI areas or the movement distance to be less than 10° longitude per day.
b. Intensity of a blocking event As before, we have defined an instantaneous amplitude (M⬘) of a blocking event, but the intensity of a blocking event during its life cycle can be defined as M ⫽ max关M⬘共t兲兴, t∈T
共7兲
where T denotes the duration of a blocking event. It should be pointed out that the blocking intensity defined by (7) is different from that defined by existing indices (Dole and Gordon 1983; LS95). In particular, in the study of LS95 the blocking intensity was calculated by normalizing the value of the central height in the blocking region using the height of a subjectively determined contour line that represents the blocking flow. This index reflects the intensity of a blocking event compared to the background flow, rather than compared to the mean state, because the background flows are different for different blocking cases. To some extent, the LS95 index may be more objective and con-
4827
venient in describing the intensity of a blocking event, but it seems to be a subjective index although Wiedenmann et al. (2002) modified it. This problem can be probably avoided by the definition of a blocking intensity index (M) in (7). In the next section, we will use the proposed new blocking index to find the action centers of blocking events in the NH.
5. Action centers of blocking events in the Northern Hemisphere a. Occurrence location and frequency of blocking events To ascertain the preferred occurrence region and frequency of blocking events in the NH, we summed all negative BI events persisting 5 days or more on each grid point for every season during a 42-yr period (referred to as “gridpoint method” hereafter). However, this method cannot exactly reflect some blocking events that have the lifetimes of 5 days or more, but are not of such long persistence times for their negative BI values at a given grid point because of the movement of blocking events. To capture this point, in this section we also add up all negative BI areas of blocking events using the temporal tracking procedure proposed in the above section (referred to as the “tracking method” hereafter). However, the tracking method is likely to cause a discontinuous boundary between the prescribed blocking sectors because the temporal tracking is only performed in each blocking sector. Figure 6 shows the geographic distribution (blocking days) of negative BI events lasting 5 days or more in the NH for a 42-yr period using the above two methods. It is found in Fig. 6 that the results obtained using the two methods are basically similar. In winter blocking events occur frequently in three regions: the Atlantic–European sector (30°W⬃30°E) with a center of about 700 blocking days; the Ural Mountains region with a center of 300 blocking days; and a broad region of the North Pacific from 130°E to 120°W with two centers corresponding to 250 and 200 blocking days, respectively. In spring in the Atlantic–European sector there are two separated blocking occurrence regions: the eastern Atlantic (30°W⬃0°) with a center of 750 blocking days, and the European continent centered at 30°E with a center of 650 blocking days; and some cases are also observed in the eastern Pacific. But, in summer the blocking activity exhibits an enhancement trend in the North Pacific sector. In this season blocking events are active in five regions: the eastern Atlantic (30°W⬃0°), the European Continent around 30°E, east of the Ural Mountains (60°⬃80°E), eastern Asia–Okhotsk Sea (100°E⬃180°), and the Eastern Pacific; but in autumn
4828
JOURNAL OF CLIMATE
VOLUME 19
FIG. 6. Geographic distribution of the total number of days of negative BI events that last for 5 days or longer for each season of the 42 years in NH (a) winter, (b) spring, (c) summer, and (d) autumn. The colored areas represent the total days of negative BI events using the gridpoint method and the solid curves denote the case using the tracking method. The contour interval (CI) is 50.
blocking events are only active in the eastern Pacific sector (110°⬃150°W), the Atlantic–European sector (30°W⬃30°E), and Ural Mountains region. It should be pointed out that in the studies of Dole and Gordon (1983), Shukla and Mo (1983), and Blackmon et al. (1986), the occurrence of winter blocking events in the North Atlantic sector ranges from 45°W to 0° with a peak near 30°W and in the Pacific sector from 170°E to 135°W with a peak around 150°W. The study
of Sausen et al. (1995) shows a winter blocking area that covers nearly the whole Atlantic and a blocking area in the Pacific similar to the results of Dole and Gordon (1983), Shukla and Mo (1983), and Blackmon et al. (1986). But, our results further show that the winter blocking events in the North Atlantic are active within a region from about 30°W to 30°E, with a peak near 10°W, similar to the result of Kaas and Branstator (1993) who found two blocking areas in winter: the
1 OCTOBER 2006
DIAO ET AL.
North Atlantic and North Europe. The occurrence of Pacific sector blocking events in our study are found to be in two relatively separated regions: one is from the northeastern Pacific to the northwest coast of the North American continent, and the other is in the central Pacific, which is also similar to the result of Kaas and Branstator (1993). In autumn our result is consistent with the result of Shukla and Mo (1983), but in the summer and spring seasons there is a large discrepancy between both. In particular, previous indices cannot better detect the summertime blocking activity over a region from the east of Lake Baikal to the Okhotsk Sea (Dole and Gordon 1983; Shukla and Mo 1983; Kaas and Branstator 1993; Sausen et al. 1995), but our new index seems to be able to identify this action center. On the other hand, Dole and Gordon (1983) found that persistent positive anomalies (blocking events) are about equally frequent in the two ocean basins. However, as found in Fig. 6 in this paper, blocking events in winter are more frequent in the North Atlantic than in the North Pacific, which is in agreement with the finding of Wiedenmann et al. (2002) and Pelly and Hoskins (2003). In conclusion, the new blocking index proposed here appears to be able to provide an alternative account of the geographic region of blocking action centers in the NH.
b. Choice of key locations and a composite of blocking events It can be found from Fig. 6 that there are several centers of blocking action in the NH. These action centers are considered to be “key locations” of blocking action in constructing a composite of blocking events. In our composite analysis, a persistent event in which the value of BI in the selected key location is consecutively negative for 5 days or more is considered as a blocking candidate, the time average over the duration of each candidate is considered as the mean field of each case, and then a composite map can be obtained by an averaging of the mean fields of all cases. As shown in Fig. 6, winter blocking events are found to occur frequently in three areas. Thus, the three locations of persistent negative BI events are considered as the three key locations of the composite of blocking events. A composite of persistent negative BI events is made when they only occur in a single sector. In this case, the composite map of persistent negative BI events in each sector can be obtained according to the key locations found from Fig. 6. The key locations used for the composite of blocking events for the four seasons are shown in Table 3. Similarly, a composite of blocking events occurring simultaneously over two of
4829
the three sectors shown in Table 3 is also performed for different seasons. Figures 7a–c show the composite patterns of persistent negative BI events for 42 years in three key locations noted in Fig. 6. It is found that blocking events can occur independently in the North Atlantic, North Pacific, and Ural Mountains. These results are consistent with the finding by Shukla and Mo (1983). In the geopotential height field, the large-scale trough in East Asia is weaker when the blockings occur over the North Atlantic and the Ural Mountains, but is stronger when the Pacific blocking only occurs. A composite of persistent negative BI events is also made when they occur simultaneously in the Atlantic and Pacific sector of selected three key locations in winter. For this case, three composite maps can be obtained. However, further calculations indicate that simultaneously occurring blocking events are in the North Atlantic and North Pacific sectors, but not in the Ural Mountains and the North Atlantic or North Pacific, as shown in Fig. 7d. To ascertain the occurrence probability of blocking events for the four cases noted in Fig. 7, the percentage frequency of blocking occurrence is calculated using the percentage of blocking days to total number of days in winter, which is shown in Fig. 8. It is found that the most frequently occurring blocking is in the northeastern Atlantic, but the frequency of simultaneously occurring blocking in the North Atlantic and Pacific sectors is lowest. Nakamura et al. (1997) found that in winter most of blocking events in the North Pacific and Atlantic sectors can arise from the eddy forcing from the synoptic-scale eddies downstream of the storm tracks in the two ocean regions. More recently, Luo (2005a) suggested that the interaction between planetary-scale wave and traveling synoptic-scale disturbances can lead to the establishment of blocking events if the eddy forcing can match the spatial structure of the planetary-scale wave prior to block onset. In this case, only when the planetary- and synoptic-scale waves in the North Atlantic sector coincide with those in the North Pacific sector can eddy-driven blocking events occur simultaneously in the two regions. The presence of a simultaneous blocking event was also shown by Lupo (1997) to be the result of the coincidental interplay between large- and synoptic-scale forcing, and the associated wave–wave interactions, independently occurring in two different parts of the globe. More recently, Duane and Tribbia (2004) theoretically found a weak relationship between blocking events in the Atlantic and Pacific sectors and suggested that the frequency of simultaneous occurrence of blocking events in the two regions is rather low. This is a cause of why the probability of observed simultaneously occurring
4830
JOURNAL OF CLIMATE
VOLUME 19
FIG. 7. Composite patterns of single persistent negative BI events for the 42 years corresponding to the three key locations shown in Table 3: (a) (42.5°N, 5°W), (b) (50°N, 60°E), and (c) (45°N, 155°W), and (d) simultaneously occurring events over (42.5°N, 5°W) and (45°N, 155°W) in winter (CI ⫽ 80 gpm).
blocking events in winter is lowest in the North Atlantic and Pacific sectors. Figure 9 shows the composite maps of persistent negative BI events in the summer season. It is found that in summer blocking events that are spatially isolated in the NH can occur in the North Atlantic, North Pacific, European continent, Ural Mountains, and Okhotsk Sea, but blocking events can occur simultaneously in the Ural Mountains and Okhotsk Sea, the North Atlantic and Okhotsk Sea, and the European Continent and Okhotsk Sea. The percentage frequency of the corresponding blocking occurrence is shown in Fig. 10 by calculating the percentage of the blocking days to the total days in summer. It is interesting to note that, although blocking events occurring over Europe
and the North Atlantic are most frequent, the blocking frequency over the Okhotsk Sea is relatively high in the summer season. In addition, it can be seen that in the summer season the frequency of simultaneously occurring blocking events in Europe and the Okhotsk Sea is highest, but lowest in the Ural Mountains and the Okhotsk Sea. An analogous composite of persistent negative BI events in spring and autumn shows a typical pattern of independently occurring blocking events for each key location (not shown). In the two seasons blocking events can simultaneously occur in the North Atlantic and Pacific, but their frequencies are also the lowest compared to independently occurring events. It must be pointed out that the possibility of simul-
1 OCTOBER 2006
DIAO ET AL.
FIG. 8. Percentage of days of independent and simultaneous blocking events persisting 5 days or longer as shown in Fig. 7 to the total days of the winter for 42 years in which “a,” “b,” “c,” and “d” correspond to the locations in Figs. 7.
taneously occurring blockings in the NH is lowest for all four seasons. In other words, isolated blocks seem to be dominant in all four seasons. This shows that blocking events should be a local phenomenon rather than globally occurring, as demonstrated by Lejenäs and Økland (1983), Lupo (1997), and Fournier (2000), and Wiedenman et al. (2002) using different analysis techniques.
6. A comparison with the TM90 index Although the TM90 index is now widely used, the index does not take account of the spatial structure and propagation of blocking events because it is onedimensional. Thus, to evaluate the relevance of the new index proposed here to blocking events, it is necessary to perform a comparison with the TM90 index although our index is two-dimensional. Figure 11 shows the percentage of blocking days to total days of each season over the 42 years as a function of the longitude by using the TM90 index and choosing the maximum of blocking days at each longitude in Fig. 6 (solid curves with the tracking method) for each season. It is found that in summer and autumn the longitudinal frequency distribution of blocking events, calculated using the new blocking index, exhibits a pattern similar to that using the TM90 index. However, there are some major differences between the blocking frequencies in other seasons using the two indices. Our new index shows a relatively low frequency of blocking events in all seasons compared to the TM90 index. In
4831
particular, this difference is considerable in the Pacific sector in winter and spring and in the Atlantic sector in spring. A comparison with the TM90 index also shows that in winter and spring the action centers of blocking events are situated slightly westward in the Atlantic sector and more eastward in the Pacific sector compared to the TM90 index. In addition, an important point is noted that the action centers of blocking events in spring are remarkably different for the two indices. In spring the TM90 index shows two blocking centers in the Pacific sector and one blocking center in the Atlantic sector, but our new index shows two blocking centers in the Atlantic sector and one blocking center situated in the east side of the Pacific sector. As noted above, in winter and spring the difference between the Pacific blocking frequencies using the TM90 index and our new index is considerable. In an annual mean, the Pacific blocking frequency is still rather low compared to the TM90 index, and the blocking frequency peak is in the eastern Pacific (not shown). Pelly and Hoskins (2003) also noted this point and ascribed it to the use of a fixed blocking latitude in the TM90 index. The relatively high Pacific blocking frequency identified by the TM90 index is shown by Pelly and Hoskins (2003) to be due to the fact that many events in the sector of the strongest mean westerly jet and upstream of the maximum in the storm track in the Pacific region that would not be described as blocked by a synoptician are identified as blocking events with the TM90 index. Instead, they correspond to low pressure minima on the northern flank of the Pacific jet. Thus, the higher blocking frequency identified by the TM90 index over the western Pacific is spurious, and the main Pacific blocking region is actually located over the eastern Pacific basin as suggested by Rex (1950b). The present study using the proposed new blocking index seems to support this conclusion. The columns in Fig. 11 are the blocking days in winter counted subjectively in the two regions, 12.5°W⬃17.5°W and 177.5°E⬃177.5°W, according to the Rex (1950a) blocking definition, but with a persistence of more than 5 days. It is evident that the blocking frequencies obtained using our new index seem to be closer to the blocking frequencies counted subjectively. This indicates from another aspect that the new index is suitable for the identification of blocking events. In the next section, we will present some results about the intensity and duration of blocking events in the NH using our new index.
7. Intensity and duration of blockings In this section, blocking events in the Atlantic– European and Pacific sectors are considered as samples
4832
JOURNAL OF CLIMATE
VOLUME 19
1 OCTOBER 2006
4833
DIAO ET AL.
FIG. 10. Percentage of days of the independent and simultaneous blocking events persisting for 5 days or longer as shown in Fig. 9 to the total number of summer days of the 42 years in summer, in which “a,” “b,” “c,” “d,” “e,” “f,” and “g” correspond in turn to Figs. 9a, 9b, 9c, 9d, 9e, 9f, and 9g.
for discussing the intensity and duration of blocking events using our new blocking index. Figure 12a shows the number of blocking events versus their amplitude intensity (M ) in the Atlantic– European sector. It is found that the blocking amplitudes (M ) for most of blocking events are between 200 and 400 gpm in winter, 150 and 350 gpm in spring, 100 and 300 gpm in summer, but between 150 and 300 gpm in autumn. Thus, it is evident that blocking events are stronger in the winter and spring than in summer and autumn seasons, consistent with the result of Lupo and Smith (1995) and Wiedenmann et al. (2002). In particular, blocking events tend to have rather large amplitudes in winter, which is in agreement with the results of Dole and Gordon (1983) and Shukla and Mo (1983). In other words, the occurrence probability of large-amplitude blocking events is high in the winter season. This may be because synoptic-scale eddies and planetary waves are more active and stronger in winter compared to other seasons (Colucci 1985). Under such conditions blocking events are easily excited through the forcing of upstream synoptic-scale eddies (Luo 2005a). We can also see that in winter blocking events tend to
have larger amplitudes in the North Pacific than in the Atlantic–European sector (Fig. 12b), which is also evident in other seasons. Figure 13a shows the blocking number–duration relationship in the Atlantic–European sector during the 42 years. A pronounced feature is noted that in the winter and spring seasons blocking events seem to be relatively long lived, but relatively short lived in the summer and autumn seasons, thereby indicating that blocking events are more persistent in winter and spring. In addition, we also find that blocking events are more long lived (persistent) in the North Atlantic than in the North Pacific for all four seasons (Fig. 13b), which agrees with the finding of Wiedenmann et al. (2002) who noted that the most persistent blocking events are in the Atlantic sector, especially in the winter. One possible reason for this is that the synopticscale eddies are more intense in the Atlantic than in the Pacific sector, but another is that the zonal mean westerly wind and associated basic-state baroclinicity are stronger in the Pacific than in the Atlantic sector (Luo et al. 2001; Luo and Wan 2005). As demonstrated theoretically by Luo (2005b), in a baroclinic environment a large-amplitude eddy-driven blocking event can form rapidly, but can also breakdown rapidly when the baroclinicity of the zonal basic flow is enough strong. This is a reason why the Pacific blocking events tend to have large amplitudes in winter, but the Atlantic blocking events are more persistent in winter. To explore the dependence of the blocking amplitude on the durations of blocking events, the mean amplitude (A) of negative BI events is defined by n
兺 M 共k兲 i
A共k兲 ⫽
i⫽1
n共k兲
,
共8兲
where Mi(k) represents the intensity of each negative BI event with a lifetime of k days, and n(k) is the number of negative BI events that persist for k days. It must be pointed out that the negative BI events can correspond to blocking events if k is equal to or greater than 5. The 42-yr mean amplitudes, A(k), of negative BI events and the corresponding mean absolute deviation as a function of the duration in the Atlantic–European and Pacific sectors are shown in Fig. 14 for each one of
← FIG. 9. Composite patterns of single persistent negative BI events for the 42 years corresponding to the three key locations shown in Table 3: (a) 45°N, 15°W; (b) 51.5°N, 30°E; (c) 50°N, 60°E; (d) 55°N, 135°E; and (e) 52.5°N, 130°W and the simultaneous occurrence over (f) 45°N, 15°W and 55°N, 135°E and (g) 51.5°N, 30°E and 55°N, 135°E in summer (CI ⫽ 40 gpm).
4834
JOURNAL OF CLIMATE
VOLUME 19
FIG. 11. Percentage of blocking days to the total days of each season in the 42 years as a function of longitude for four seasons: (a) winter, (b) spring, (c) summer, and (d) autumn, in which the dotted curve is calculated using the TM index and the others are calculated using the new blocking index. The solid curve represents the frequency of negative BI events persisting for 5 days or longer, but the dashed curve corresponds to the frequency of negative BI events persisting for 1 day or longer. The columns are the blocking days of blocking events lasting for 5 days or longer counted subjectively according to the Rex blocking definition.
the four seasons. It is found that the mean amplitude of negative BI events that persist for less than 5 days is between about 50 and 150 gpm, except for the winter Pacific cases that have larger amplitudes. Generally speaking, in the winter and spring seasons the amplitude of the negative BI events increases rapidly with duration when the duration of the events is shorter than 5 days. But, when it exceeds this time interval, the mean amplitude will have a weak upward trend with duration. In other words, long-lived blockings correspond, in general, to large amplitude events. A comparison between Figs. 14a and 14b shows that blocking events (negative BI events lasting 5 days or more) in the Pacific sector can have large amplitudes, but are relatively short lived compared to in the Atlantic–European sector. Thus, relatively strong blocking events should occur in the Pacific sector, but more persistent blocking events are found in the Atlantic– European sector. The block intensity index, proposed by Wiedenmann et al. (2002, their Table 5), seems to be
unable to identify such a behavior because the difference between block intensities in the Atlantic and Pacific sectors, obtained using their block intensity index, is not so evident. However, our new blocking index can better identify the difference between the block intensity and duration in the Atlantic and Pacific sectors. Even so, in winter and spring relatively strong (large amplitude) blocking events are still found to occur in the Atlantic–European region.
8. Conclusion and discussions In this paper, we have constructed a new index to describe the duration, intensity, and preferred occurrence regions of blocking events in the NH using a 42-yr database. Blocking events can be identified by tracking the negative value area of this index that reflects the spatial coherence and propagation of a blocking flow. In addition, a comparison with previous studies is also made.
→ FIG. 12. Number of blocking events as a function of blocking intensity (M) between the two bounding values for two regions: (a) the Atlantic sector and (b) the Pacific sector, in which the dashed curve denotes a Gaussian-type distribution centered at M ⫽ 225 gpm with unit variance.
1 OCTOBER 2006
DIAO ET AL.
4835
4836
JOURNAL OF CLIMATE
FIG. 13. Number of blocking events as a function of persistent days over two regions: (a) the Atlantic sector and (b) the Pacific sector.
VOLUME 19
1 OCTOBER 2006
DIAO ET AL.
FIG. 14. The 42-yr seasonal mean intensity at a given duration for all events that persist over (a) the Atlantic sector and (b) the Pacific sector: the solid circle denotes the mean intensity for each given duration, the dashed lines represent the mean intensity plus/minus a mean absolute deviation of the intensity for each given duration, respectively, and the thick solid line is the fourth-order polynomial curve fitting to the mean intensity.
4837
4838
JOURNAL OF CLIMATE
In our new index, the southernmost reference latitude used to calculate the blocking index is determined from a composite of blocking events in different regions for seasons, which is almost insensitive to the number of blocking events in a given sector and season. In this paper, negative BI events with persistence of 5 days or longer are defined as blocking events. Using this new index we can find that in the NH blocking events are more frequent in the Atlantic–European sector than in the Pacific sector in winter, spring, and autumn, but more persistent in the Atlantic–European sector than in the Pacific sector for all seasons. In addition, blocking events in the Pacific sector are found to have larger amplitudes than their Atlantic counterparts. This result seems to agree with the characteristics of blocking events in the NH obtained by Wiedenmann et al. (2002) by extending the blocking intensity index proposed in LS95, who noted that the Pacific blockings are of large amplitudes, but short lived compared to those in the Atlantic sector. It is further inferred from the observational and theoretical studies by Luo and Wan (2005) and Luo (2005b) that stronger, but relatively shortlived, blocking events in the North Pacific are likely to be related to excessively strong basic-state baroclinicity there. On the other hand, it can be found from a comparison with the other indices (especially the TM90 index) that in summer and autumn there is a good correspondence between the obtained longitudinal blocking frequencies using our new index and the TM90 index, but in other seasons the longitudinal frequencies of NH blocking events obtained using our new index are different from those with the TM90 index, especially in the Pacific sector, but are likely to bear a resemblance to those found by Pelly and Hoskins (2003) using the PV– index. In addition, it is found that in our new index the action centers of blocking events in winter, spring, and autumn are situated slightly westward in the Atlantic sector and more eastward in the Pacific sector compared to the TM90 index. In particular, in spring our new index shows two distinct blocking centers in the Atlantic–European sector, but the most frequent one is situated more westward in this sector. The composite analysis according to the new index shows that for all four seasons independently occurring blocking events are most frequent, but simultaneously occurring blocking events are least frequent. This indicates that most of blocking events in NH are isolated spatially, which agree with the finding of Lejenäs and Økland (1983), Lupo (1997), and Fournier (2000). In total, the new index proposed in this paper seems to be able to provide more information about many aspects of blocking action in the NH compared to the
VOLUME 19
previous indexes (Lejenäs and Økland 1983; Dole and Gordon 1983; Tibaldi and Molteni 1990; LS95; Pelly and Hoskins 2003). However, it is possible that our new blocking index has a deficiency that identifies cut-off lows that last for 5 days or longer as blocking events. In addition, interannual and decadal variabilities of blocking events in the NH are not examined using our new blocking index in the present paper. Also, the impact of the NAO and ENSO on blocking action in the NH is not discussed. These problems will be reported in another paper. Acknowledgments. The authors acknowledge the support from the National Outstanding Youth Natural Science Foundation of China under Grants 40325015 and 40325016 and LASG foundation. Three anonymous reviewers are highly appreciated for their useful suggestions and comments for improving this paper. REFERENCES Anderson, J. L., 1993: The climatology of blocking in a numerical forecast model. J. Climate, 6, 1041–1056. Berggren, R., B. Bolin, and C. G. Rossby, 1949: An aerological study of zonal motion, its perturbations and break-down. Tellus, 1, 14–37. Blackmon, M. L., S. L. Mullen, and G. T. Bates, 1986: The climatology of blocking events in a perpetual January simulation of a spectral general-circulation model. J. Atmos. Sci., 43, 1379– 1405. Cash, B. A., and S. Lee, 2000: Dynamical processes of block evolution. J. Atmos. Sci., 57, 3202–3218. Colucci, S. J., 1985: Explosive cyclogenesis and large-scale circulation changes: Implications for atmospheric blocking. J. Atmos. Sci., 42, 2701–2717. Dole, R. M., and N. D. Gordon, 1983: Persistent anomalies of the extratropical northern hemisphere wintertime circulation: Geographical distribution and regional persistence characteristics. Mon. Wea. Rev., 111, 1567–1586. Duane, G., and J. J. Tribbia, 2004: Weak Atlantic–Pacific teleconnections as synchronized chaos. J. Atmos. Sci., 61, 2149–2168. Fournier, A., 2000: Introduction to orthonormal wavelet analysis with shift invariance: Application to observed atmospheric blocking spatial structure. J. Atmos. Sci., 57, 3856–3880. Kaas, E., and G. Branstator, 1993: The relationship between a zonal index and blocking activity. J. Atmos. Sci., 50, 3061– 3077. Knox, J. L., and J. E. Hay, 1985: Blocking signatures in the northern hemisphere: Frequency distribution and interpretation. J. Climatol., 5, 1–16. Lejenäs, H., and H. Økland, 1983: Characteristics of northern hemisphere blocking as determined from a long time series of observational data. Tellus, 35A, 350–362. Luo, D., 2005a: A barotropic envelope Rossby soliton model for block–eddy interaction. Part I: Effect of topography. J. Atmos. Sci., 62, 5–21. ——, 2005b: Interaction between envelope soliton vortex pair
1 OCTOBER 2006
DIAO ET AL.
blocks and synoptic-scale eddies in an inhomogeneous baroclinicity environment. Quart. J. Roy. Meteor. Soc., 131, 125– 154. ——, and H. Wan, 2005: Decadal variability of wintertime North Atlantic and Pacific blockings: A possible cause. Geophys. Res. Lett., 32, L23810, doi:10.1029/2005GL024329. ——, F. Huang, and Y. Diao, 2001: Interaction between antecedent planetary-scale envelope soliton blocking anticyclone and synoptic-scale eddies: Observations and theory. J. Geophys. Res., 106, 31 795–31 816. Lupo, A. R., 1997: A diagnosis of two blocking events that occurred simultaneously over the midlatitude Northern Hemisphere. Mon. Wea. Rev., 125, 1801–1823. ——, and P. J. Smith, 1995: Climatological features of blocking anticyclones in the northern hemisphere. Tellus, 47A, 439– 456. Nakamura, H., M. Nakamura, and J. L. Anderson, 1997: The role of high- and low-frequency dynamics in blocking formation. Mon. Wea. Rev., 125, 2074–2093. Pelly, J. L., and B. J. Hoskins, 2003: A new perspective on blocking. J. Atmos. Sci., 60, 743–755. Rex, D. F., 1950a: Blocking action in the middle troposphere and its effects upon regional climate. I: An aerological study of blocking action. Tellus, 2, 196–211. ——, 1950b: Blocking action in the middle troposphere and its
4839
effects upon regional climate. II: The climatology of blocking action. Tellus, 2, 275–301. Sausen, R., W. Wong, and F. Sielmann, 1995: Analysis of blocking action events from observations and ECHAM model simulation. Tellus, 47A, 421–438. Schwierz, C., M. Croci-Maspoli, and H. C. Davies, 2004: Perspicacious indicators of atmospheric blocking. Geophys. Res. Lett., 31, L06125, doi:10.1029/2003GL019341. Shabbar, A., J. Huang, and K. Higuchi, 2001: The relationship between the wintertime North Atlantic Oscillation and blocking episodes in the North Atlantic. Int. J. Climatol., 21, 355–369. Shukla, J., and K. C. Mo, 1983: Seasonal and geographical variation of blocking. Mon. Wea. Rev., 111, 388–402. Sinclair, M. R., 1996: A climatology of anticyclones and blocking for the Southern Hemisphere. Mon. Wea. Rev., 124, 245–264. Tibaldi, S., and F. Molteni, 1990: On the operational predictability of blocking. Tellus, 42A, 343–365. ——, E. Tosi, A. Navarra, and L. Peduli, 1994: Northern and Southern Hemisphere seasonal variability of blocking frequency and predictability. Mon. Wea. Rev., 122, 1973–2003. Wiedenmann, J. M., A. R. Lupo, I. I. Mokhov, and E. Tikhonova, 2002: The climatology of blocking anticyclones for the Northern and Southern Hemispheres: Block intensity as a diagnostic. J. Climate, 15, 3459–3473.