A New Web Usage Mining and Visualization Tool Nicolas Labroche Universit´e Pierre et Marie Curie-Paris6, UMR7606, Paris, F-75005 France
[email protected] Marie-Jeanne Lesot Universit´e Pierre et Marie Curie-Paris6, UMR7606, Paris, F-75005 France
[email protected] Lionel Yaffi Intelligent Learning Objects
[email protected]
Abstract This paper introduces a new tool for web usage mining and visualization that relies on the bio-mimetic relational clustering algorithm Leader Ant and the definition of prototypes based on typicality computation to produce an efficient visualization of the activity of users on a website. The tool is evaluated on a real web log file from the French museum of Bourges website and shows that it can easily produce meaningful visualizations of typical user navigation.
1. Introduction Studying web usage is a task of major importance: the availability of numerous and huge log files requires the development of tools to enable a user to better apprehend the content of user sessions, interpret them and extract information from them. The objective of this interpretation of user activity is for instance to improve the hypertext structure [19] or to address a personalization task [24]. In this paper we propose a new modular framework for analyzing and visualizing user activity. The proposed tool belongs to the framework of methods based on a graphical representation of the user activity [18, 12, 9, 30]: user sessions can be associated to paths, so-called “web-paths” [26], in a directed graph, where the web pages are the nodes of the graph and the hyperlinks the edges between the nodes. Now this graph has a very high number of edges and nodes, and the problem of visualizing web user sessions is closely related to the more general problem of large graphs representation [8]. Two main approaches are combined to
address the problem, as detailed in Section 2: the first one directly aims at improving the representation capabilities, while the second one aims at selecting the most significant information to be displayed, through filtering and clustering methods. As many existing tools [9, 30], the tool proposed in this paper combines these two approaches. Its particularity is that it focuses on the user sessions themselves, and not on the underlying web pages: in order to select the information to be displayed, we perform a clustering step, but we apply it to the user sessions, considering them as a whole and without decomposing them and looking at “sub-sessions”. Instead of clustering the graph nodes (although this could also be performed and combined to the proposed approach), our tool determines subgroups of users who have similar behaviors that may be redundant and are not worth being displayed individually: this step summarizes the navigation information. Moreover, in order to further decrease the quantity of information to be represented, we propose to determine a significant representative for each subgroup of data: we use the typicality and prototype framework to provide a summarization of the previous clusters. Then in the last step, the proposed visualization tool can be applied, focusing on the most relevant user sessions determined through these data mining steps. Apart from this data mining component, our tool comprises, in a modular framework, several components that make it possible to perform a whole web usage mining process and it implements functionalities that cover a wide specter ranging from log data recording to visualization. The sections hereafter briefly describe each of these functionalities and the way they interact to form a visualization tool for web usage mining.
More precisely the paper is organized as follows: Section 2 describes works related to the proposed tool. Section 3 describes the data collection module that makes it possible to record the activity of web users with a greater accuracy than simple web server log files. Section 4 describes the data mining methods that are applied to summarize the data and Section 5 presents the visualization components. Lastly Section 6 illustrates the results that can be obtained with the proposed tool on real log data.
2. Related works The general problem of large graph representation is usually addressed through the combination of two main approaches: the first one directly aims at improving the representation capabilities, while the second one aims at selecting the most significant information to be displayed, through filtering and clustering methods. More precisely, the first approach aims at developing specific methods for the representation itself: [22] describes the use of hyperbolic spaces to increase the quantity of information that can be represented on the screen as compared to the traditional Euclidean space. The disk tree representation [2] takes into account the content, the topology and the usages of the website to help understanding the relationships between the production of information in the website and its consumption by the web users (notion of ”ecology”). Moreover the authors propose the notion of ”disk tube” that allows to visualize several disk trees on a time line to evaluate the dynamic of the data accesses over time. In [21], among other strategies to facilitate the visualization of directed graphs, the authors propose to use an interactive binding of information to visual properties such as colors or shapes, and the use of a hierarchical representation (tree) that is more understandable than graphs and can be zoomed semantically (e.g. a node representing a set of pages from the same directory can be expanded upon request). [4] also recommends the introduction of interactivity in the visualization tool by using for instance fisheyes effects, zooming (geometrically or semantically), or color codes. In [8] the authors recall the main properties the graph layouts should verify to ensure a good visualization. On the other hand, these representation techniques are combined with filtering and clustering methods, to reduce and select the information to be displayed: the tool described in [26] allows an expert to apply several distinct filters to reveal hidden navigation patterns. Such filters for instance apply to users, periods of time, websites or subdirectories. [8] clusters the nodes and edges of large graphs so as to obtain smaller graphs that are within the limitations of the existing graph layouts. Likewise in [21] the authors cluster pages, e.g. pages from the same directory or pages that share similar properties such as author or theme (con-
tent clustering), or links of the graph (structure clustering); they also apply filtering to links and/or nodes in the graph. Such methods are combined in tools such as Webquilt [9] that describes a complete framework aiming at logging, analyzing and visualizing the web user sessions. The objective of this tool is to conduct remote usability tests on many users and to facilitate the analysis of the results by drawing some sessions and the optimal path. In this case, only few sessions are represented to ensure the representability of the associated graph. Likewise [30] propose the ”Visual Web Mining” as the application of visualization methods on results of web mining such as sequence mining and tree mining: for instance user sessions are decomposed to identify common subsequences between user sessions. The web usage mining tool presented in this paper follows the same line. Its specificity is threefold: first it focuses on the user sessions themselves and not on the underlying web pages. This implies that instead of clustering the graph nodes, our tool applies to the navigation information contained in the user sessions. Second the proposed tool relies on a bio-mimetic clustering algorithm that exhibits interesting properties in the context of web usage mining. Third, the proposed tool uses the typicality framework to build significant representatives of each cluster, in order to improve the result interpretability.
3. Data Collection Component The proposed tool is essentially made of three modules that we describe successively in the following sections. The first one concerns the data collection, i.e. the record of web users activity and their representation that will be used for the subsequent steps, data mining and visualization. There exist many works on these subjects, in the following subsections we describe the methods applied in the presented tool.
3.1
Recording Web Users Interactions
The first functionality of our tool allows to record the activity of web users with a greater accuracy than simple web server log files. Indeed, it is useful to overcome the inherent limits of these web server log files that are often noisy because of proxy web servers (several users have the same IP number) and (local or distant) caching systems (some client requests are not sent to the web server). Our system acts as a very simple intermediate proxy server and can be included in a small script in the host web server. This proxy only modifies the html documents as they are requested by the clients and introduces dynamically a javascript program that will identify the user with a unique ID and then capture all its activity, at a lower level than traditional web log files:
it records events such as mouse clicks, scroll, mouse over, and document load events among others. Each time the user realizes an action, the javascript program generates a log entry corresponding to that action and sends it to a JAVA program (hosted either on the studied web server or in another server).
3.2
Web User Sessions
4.1. Similarity Measure Many similarity measures can be considered, depending on the features built in the data collection component. In this paper, we use a measure that does not take into account user events such as mouse clicks, but that considers sessions as sets of accessed urls: two sessions are compared based on the similarity between the urls visited in each of them, without taking into account the order in which they were accessed. The similarity between urls depends on the path of the urls rather than their content as in [23]: it is computed as a weighted sum over the similar token in each url’s path, with a bigger weight to the first tokens of each url. Denoting Surl (u1 , u2 ) the similarity between urls u1 and u2 , we then define the similarity measure between two sessions s1 and s2 as X X S(s1 , s2 ) = Surl (u1 , u2 ) (1)
The second step of the data collection component takes as input either a web server log file or the log generated by the previous recording module, and reconstructs the user sessions. The logs can be filtered by IP number, directory (to focus the study on a part of the initial website), date or MIME type of the request (to reduce the number of requests by discarding e.g. pictures or scripts). After this preliminary filtering, we define a web user by a triple (IP number, ID -if known-, user agent) to limit the problem of multiple users sharing the same IP number due to the proxy servers. Then, the requests are sorted by user and by date. The user sessions are finally reconstructed according to the following criteria: if there is an idle time longer than 30 minutes between two consecutive requests from a user, then it is considered that the user finished its current session and begins a new one. Otherwise, if the idle time is less than 30 minutes, our heuristic considers the referrer of the request (the page where the user comes from): if it is defined and equals the last visited url, the session is continued, else the referrer is searched in the history of that user to decide if a new session should be created for that user. In the case where the referrer is undefined, our method uses the structure of the website to decide whether the new requested page is reachable from one of the page in the history of the user. Besides, the session construction heuristic also uses the structure of the website to complete the paths of the user to limit the problem of document caching.
and then use a classic normalization to ensure its values are in the interval [0,1], by dividing the obtained value by the square root of the self-similarities S(s1 , s1 ) and S(s2 , s2 ). This similarity measure compares web sessions taking into account the number of times each url is accessed and also the similarity between the visited pages based on their paths. Thus, it carries more information than simple web session representations used in former works (number of hits by page, transactions vectors). Furthermore, it can be easily improved by modifying the similarity measures between urls Surl (e.g. by considering the content of the web pages or a semantic description from a domain ontology). This measure has shown to be more efficient, in terms of cluster compactness and computation time, than a modified string edit distance applied to sessions considered as sequences of web pages [14]. It is to be underlined that the modular framework of the proposed tool makes it very easy to modify the applied measure, and to test other ones.
4. Data Mining Components
4.2. Clustering
The proposed tool implements data mining methods so as to produce more focused and understandable views of the website’s graph by only considering the meaningful and typical user activity. As a result, we also expect our tool to be able to deal with large websites that contain several thousands documents, since the clusters gather similar browsing profiles that only access a portion of the web pages of the original website. We first describe the similarity measure used to compare user sessions and then detail the clustering algorithm and the method for building typicality-based prototypes.
∀u1 ∈s1 ∀u2 ∈s2
4.2.1
Objective
Many works have been conducted in the last ten years to extract, analyze, model or predict the user information needs on a web site. To achieve this goal, several approaches have been proposed in the literature as recalled in [20]. Some systems rely on association rules or sequential patterns extraction like WebMiner [3], WebWUM [29] or WebTool [18]. Some other works [15, 1, 7, 5] apply clustering algorithms to discover homogeneous groups of (web) sessions. The underlying idea of these methods is that the algorithm should group in the same cluster sessions that correspond to
users who navigate similarly, i.e. who have the same motivation and interests. The objective can be either to discover users who accessed the same resources on the website or to find clusters of web pages that co-occur frequently in the same sessions. This kind of approach allows to define in a second step a profile of typical website access from each discovered cluster and can highlight information that is not directly accessible in the data. The extracted profiles can then be used for web pages recommendation purposes, dynamic website organization or website browsing behavior analysis and visualization. In our tool we propose to use the relational ant-based clustering algorithm [14] summarized in Table 1 and detailed in the following, that exhibits some interesting properties in the context of web usage mining: it automatically learns the appropriate number of clusters and can deal with any web session representation, including structured representations. Indeed, it only depends on a similarity measure that outputs a real value between 0 and 1 and does not make the assumption that the data are vectors. Moreover its complexity is O(kn) where k is the number of clusters and n the number of objects. It is thus fast enough to handle large data sets; it has already been proved [14] to be efficient in producing meaningful session clusters when compared to stateof-the-art clustering algorithms like the Fuzzy-C-Medoids (LFCMdd described in [12]). 4.2.2
The Leader Ant Algorithm
The Leader Ant clustering algorithm (LA) [14, 13] belongs to the framework of bio-mimetic algorithms, it is inspired by the chemical recognition system of ants: each object of the data set is associated to the genome of an artificial ant and each cluster is modeled as an ant nest. Although LA reproduces some of the main principles of the chemical recognition system of ants, its underlying model has been adapted to match more specifically the objectives of the clustering problem and for performance purposes. In LA, an artificial ant is described by three parameters: (1) its genome that describes its associated object from the data set, (2) a label reflecting its nest membership, and (3) a template value, identical for all ants, learned in the initialization step. The template is defined as the mean similarity observed between randomly chosen ants. LA, which is summarized in Table 1, is a one-pass relational agglomerative algorithm that iteratively selects at random a new ant a (that has not been already assigned to a nest), and determines its label by simulating random meetings with ants from each existing nest. During these meetings, the ant a determines the odor (or nest membership) that best fits its genome; to that aim it estimates the similarity of its genome with those of ants from the evaluated nests. It then joins the nest with most similar ants or build
Table 1. Description of the Leader Ant Clustering Algorithm L EADER A NT A LGORITHM Input: A data set with n objects Output: A partition of the n objects (1) (2) (3) (4) (5) (6) (7) (8) (9)
Initialization of Artificial Ants Assignment of one object to each ant Template computation Iterative Building of Nests Selection of an artificial ant Random meetings with ants from each nest Estimation of similarity with each nest Assignment to a nest or building a new nest Deletion of Smallest Nests (optional)
its own new nest if the observed similarity values are under the template threshold value. When all ants are assigned to a nest, the smallest nests can optionally be deleted and their ants reassigned to the most similar clusters. Mode details can be found in [13]. The LA clustering algorithm is similar to k-means-like algorithms but it replaces the centroid computation by random meetings between ants. This allows LA to be efficient on large data sets by avoiding the mean or medoid computation: as already mentioned it runs in linear time with the number of objects and the number of clusters. Furthermore this allows LA to handle non numerical data sets as well.
4.3. Prototype Construction The previous clustering step provides a decomposition of the data into homogeneous and distinct subgroups, thereby highlighting the data structure and summarizing the whole data. In order to further decrease the quantity of information to be represented, we propose to define significant representatives for each cluster, that highlight their characteristics and provide an additional summarization step. 4.3.1
Principle
There exist many ways to summarize data sets or to build representatives for data categories, such as the average, or the median, or weighted equivalents thereof (as used for instance in the fuzzy c-means, the possibilistic c-means or the fuzzy c-medoids, see e.g. [10]). In this paper, we consider another definition, the typicality-based prototype [27, 17]. Its main difference with the previous classic representatives comes from its dependence to all categories:
whereas the mean or the median only depend on the category to be represented, the typicality-based prototype also takes into account the other groups. Indeed, its aim is to provide a more complete characterization of the category, underlining the common points of the category members, as the classic representatives, but also highlighting their distinctive components as compared to the other categories. Thus the prototype emphasizes the specificity of the cluster, which makes it more representative than other summarization choices (see [16, 17] for a more complete comparison). These principles are in agreement with cognitive studies about category representatives [28]: it was shown that all members of a group are not equivalent; some are more representative, or more typical than others, the group representative being the most typical member (or an aggregation of the most typical members). These studies proved that the typicality of a group member depends on two complementary components: its resemblance to the other group members (the so-called internal resemblance), but also on its difference to the members of the other groups (the so-called external dissimilarity). In other words, the prototype must share common features with the other group members but also possess discriminative features that prevent confusion with other groups 4.3.2
Formalization
The formalization of the previous principles relies on the definition of prototypes based on the computation of typicality degrees for all data points. The prototype construction method consists in three steps: Computation of internal resemblance and external dissimilarity Denoting s a data point (a user session) and C the cluster it belongs to, the internal resemblance R(s, C) is defined as the average resemblance of the considered point to the other cluster members, the external dissimilarity D(s, C) as the average dissimilarity to points in other categories. More formally, denoting S the similarity measure defined in Eq. (1), and δ the induced dissimilarity, defined as δ(s1 , s2 ) = 1 − S(s1 , s2 ), one has R(s, C)
= avg(S(s, s2 ), s2 ∈ C)
(2)
D(s, C)
= avg(δ(s, s2 ), s2 6∈ C)
(3)
Computation of the typicality degree The typicality degree then measures the extent to which a data point is typical of the cluster it belongs to. As presented in the previous subsection, it is an aggregation of internal resemblance and external dissimilarity: T (x, C) = ϕ(R(x, C), D(x, C))
(4)
where ϕ denotes the aggregation operator that expresses how T (x, C) depends on R(x, C) and D(x, C): a conjunctive operator e.g. requires that a point have both high internal resemblance and external dissimilarity to be considered as typical. In this paper, we use the MICA operator [11] that is a conjunctive, disjunctive or trade-off operator, depending on the values to be aggregated. It offers a reinforcement property: if both R and D are high, they reinforce each other to give an even higher typicality, if both are low, they penalize each other to give an even smaller value. Determination of the prototype Lastly the prototype itself can be deduced from the typicality degrees: it can be defined as the aggregation of the most typical members of each group [16], or simply as the most typical member of each group. In this paper we apply the latter choice.
5. Visualization Components The third main module of the proposed tool is the visualization component. It uses the Jung API [25] to produce the graphs of the users activity, nodes corresponding to web pages and edges to hyperlinks followed by users. As pointed out in previous works (see Section 1), some important criteria have to be taken into account to guarantee the understandability of the output graph: (1) the number of nodes and edges should be limited, (2) the number of crossings between edges should be minimized, (3) the graph should use distinct colors and/or shapes to convey more information than the structural information and (4) the tool should be interactive and should let a user customize the view that is proposed by default to conduct her analysis. Our tool relies on the clustering and computation of prototypes to summarize the web user activity and thus to limit the size of the graphs. Following the approach proposed by [6], we also propose to decrease optionally the number of nodes and edges by generalizing the urls at a given level, i.e. to cut the website structure tree at a given depth. For example, the url “/a/b/c/d/e.html” can be generalized at level 3 in “/a/b/c” or in “/” at level 0. In order to convey as much information as possible, our tool uses distinct colors, transparency and shapes for the nodes and edges depending on the frequency of users visits. Each color is associated to a range of values: green (from 0 to 20%), blue (from 20 to 60%) and red (from 60 to 100%). Two types of information are represented on the graph with the color and size of the nodes and edges: the mean access frequency from the parent nodes and the percentage of users following a link at least once in their session. We use 2 special nodes in our graph: the black circle is a virtual starting point for each session and the red square is a virtual node that corresponds to the end of the sessions.
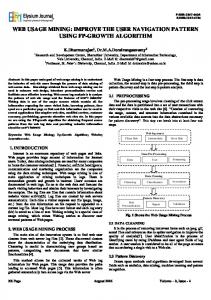
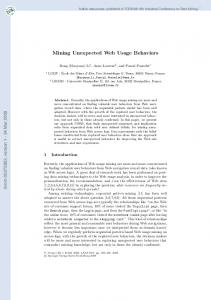
This allows to visualize the behaviors of users who quit the website. The interface is mainly decomposed in 3 parts, as illustrated on Fig. 1: a list of the clusters on the top left, the list of sessions from the selected clusters on the bottom left, and the graph rendering. For the time being, the tool allows to visualize the set of all clusters or a selection of some clusters, selected through the list in the top left part of the interface (see e.g. Fig.1a).
6. Results This section describes the experiments that have been conducted and the results obtained on the website of the museum of Bourges to show the potential of this new tool.
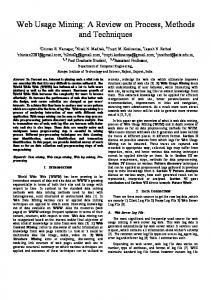
Figure 1 presents the results for each of the 3 main discovered clusters. The top graph of Fig. 1 represents the paths of the users who accessed the English content (directory ”anglais”). The typical path is marked with light blue color around the nodes of the path and consists in a user who visited the English content without visiting the French index and then left the website. The middle graph represents users interested in the actuality section of the website: they access it either directly, or after consulting the site root. The typical path corresponds to user who directly enter the site using the actuality page. Finally, the bottom graph of Fig. 1 represents users who equally navigate to the index of the website (”/”) or the html content (”html”). Consistently the typical path is an access to the site root followed by an access to the html content.
6.1. Data Set
7. Conclusions and Perspectives
The museum of Bourges is a relatively small website for which 9913 requests were recorded on 164 distinct web pages, representing 1512 web sessions. Although it is a museum that deals with all aspects of nature and living systems, its website is specialized in the study and protection of bats. Thus, the index of the website mainly deals with this subject. The other particularity of the website is that its html content files are mainly located in the same directory, which may not facilitate the discrimination process of our similarity measure between sessions that relies on the path of accessed web pages.
This paper introduces a new tool for web usage mining and visualization that relies on the bio-mimetic relational clustering algorithm Leader Ant and the definition of prototypes based on typicality computation to produce an efficient visualization of the activity of users on a website. The problem of the representation of web users is not trivial since the graph corresponding to the user activity becomes more and more complicated as the size of the website and the number of users increase. The proposed tool allows to visualize and manipulate the discovered clusters by choosing those to represent in the graph, and makes it possible for a webmaster to locate easily the parts of the website that different groups of users visit. It is also possible to study the reason why a group of users leaves the website, which can be useful in the context of a commercial website. The experiments on the museum of Bourges show that this first implementation of the tool is promising and illustrate its capacity to treat real web users log. This tool has been developed as a modular framework in which several components interact. The advantage of this architecture is that it simplifies the evolution of the tool as each component can be improved by later developments independently from the others. Many functions could be added to improve this tool:
6.2. First Results The analysis of the museum of Bourges website with the Leader Ant clustering algorithm and the similarity measure introduced in Section 4 reveals 5 clusters from which 3 main profiles could be identified, as illustrated on Fig. 1 and detailed in the following: users browsing exclusively the English content of the website, users interested in the actuality section and finally users directly accessing the website through its index page or its content. For the purpose of the experiments, a generalization of the urls at level 1 has been applied to further reduce the number of urls to be represented after clustering. The mean computation time (including the computation of the similarities between urls and the clustering of the sessions) is about 1.57 ± 0.17 seconds (over 10 consecutive runs). The quality of the output partition has been computed as the ratio between the intra-cluster distance (the sum of the distances between sessions in the same cluster) and the inter-clusters distance (the sum of the distances between sessions in the different clusters). The mean quality value is 0.31 ± 0.01 with very compact clusters (dintra = 0.19 ± 0.01) and relatively separated clusters (dinter = 0.63 ± 0.04).
• introducing new similarity measures between sessions based on the content of the accessed web pages; • modifying the representation of the graph by generating small pictures of the web pages instead of the textual nodes; • allowing semantic or structural zooming (possibly via a fish-eye effect) in the nodes of the graph to let the user expand the portion of the website that is more interesting to her;
Figure 1. Snapshots of the results obtained with the museum of Bourges data: (Top) Users interested in the English content. (Middle) Users interested in the actuality section of the website. (Bottom) Users who equally access the website by its index page or by its content.
• integrating a robust 3d visualization that can take advantage of the graphic card rendering functionalities and that lets the user decide the point of view that best suits her analysis.
References [1] R. Baraglia and P. Palmerini. Suggest: A web usage mining system. In Proc. of IEEE Int. Conf. on Information Technology: Coding and Computing, 2002. [2] E. Chi, J. Pitkow, J. Mackinlay, P. Pirolli, R. Gossweiler, and S. K. Card. Visualizing the evolution of web ecologies. In Proc. of the Conf. on Human Factors in Computing Systems, CHI’98, 1998. [3] R. Cooley, B. Mobasher, and J. Srivastava. Data preparation for mining world wide web browsing patterns. Knowledge and Information Systems, 1(1):5–32, 1999. [4] H. Eelco and H. Weinreich. Interactive web usage mining with the navigation visualizer. In Proc. of the Conf. on Human Factors in Computing Systems, CHI’05, Extended Abstracts, pages 1451–1454, 2005. [5] Y. Fu, K. Sandhu, and M. Shih. Clustering of web users based on access patterns. In Springer, editor, Proc. of the 1999 KDD Workshop on Web Mining, 1999. [6] Y. Fu, K. Sandhu, and M. Shih. A generalization-based approach to clustering of web usage sessions. In Masand and Spiliopoulou, editors, Web Usage Analysis and User Profiling, volume 1836 of LNCS, pages 21–38. Springer, 2000. [7] J. Heer and E. Chi. Identification of web user traffic composition using multi-modal clustering and information scent. In Proc. of the Workshop on Web Mining, SIAM Conference on Data Mining, pages 51–58, 2001. [8] I. Herman, G. Melanc¸on, and M. S. Marshall. Graph visualization and navigation in information visualization: A survey. IEEE Trans. on Visualization and Computer Graphics, 6(1):24–43, 2000. [9] J. I. Hong, J. Heer, S. Waterson, and J. A. Landay. Webquilt: a framework for capturing and visualizing the web experience. In World Wide Web, pages 717–724, 2001. [10] F. H¨oppner, F. Klawonn, R. Kruse, and T. Runkler. Fuzzy Cluster Analysis, Methods for classification, data analysis and image recognition. Wiley, 2000. [11] A. Kelman and R. Yager. On the application of a class of MICA operators. Int. Journal of Uncertainty, Fuzzyness and Knowledge-Based Systems, 7:113–126, 1995. [12] R. Krishnapuram, A. Joshi, O. Nasraoui, and L. Yi. Lowcomplexity fuzzy relational clustering algorithms for web mining. IEEE-FS, 9:595–607, 2001. [13] N. Labroche. Fast ant-inspired clustering algorithm for web usage mining. In Proc. of the Information Processing and Management of Uncertainty Conference, IPMU’06, pages 2668–2675, 2006. [14] N. Labroche. Learning web users profiles with relational clustering algorithms. In Workshop on Intelligent Techniques for Web Personalization AAAI Conference, 2007. [15] N. Labroche, N. Monmarch´e, and G. Venturini. Antclust: Ant clustering and web usage mining. In Proc. of the Genetic and Evolutionary Computation Conference, Gecco’03, 2003.
[16] M.-J. Lesot, L. Mouillet, and B. Bouchon-Meunier. Fuzzy prototypes based on typicality degrees. In B. Reusch, editor, Proc. of the 8th Fuzzy Days 2004, Advances in Soft Computing, pages 125–138. Springer, 2005. [17] M.-J. Lesot, M. Rifqi, and B. Bouchon-Meunier. Fuzzy prototypes: From a cognitive view to a machine learning principle. In H. Bustince, F. Herrera, and J. Montero, editors, Fuzzy Sets and Their Extensions: Representation, Aggregation and Models. Springer, 2007. [18] F. Masseglia, P. Poncelet, and R. Cicchetti. Webtool: An integrated framework for data mining. In Database and Expert Systems Applications, pages 892–901, 1999. [19] F. Masseglia, P. Poncelet, and M. Teisseire. Using data mining techniques on web access logs to dynamically improve hypertext structure. ACM SigWeb Letters, 8(3):1–19, 1999. [20] B. Mobasher. Data mining for personalization. In P. Brusilovsky, A. Kobsa, and W. Nejdl, editors, The Adaptive Web: Methods and Strategies of Web Personalization, volume 4321 of LNCS. Springer, 2006. [21] S. Mukherjea and J. Foley. Visualizing the worl-wide web with the navigational view builder. Technical report, Graphics, Visualization and Usability Center, College of Computing, Georgia Institute of Technology, 1995. [22] T. Munzner and P. Burchard. Visualizing the structure of the World Wide Web in 3D hyperbolic space. In Proc. of the VRML 1995 Symposium, pages 33–38. ACM Press, 1995. [23] O. Nasraoui, A. Joshi, and R. Krishnapuram. Relational clustering based on a new robust estimator with application to web mining. In Proc. of Int. Conf. North American Fuzzy Info. Proc. Society, NAFIPS’99, 1999. [24] O. Nasraoui, R. Krishnapuram, A. Joshi, and T. Kamdar. Automatic web user profiling and personalization using robust fuzzy relational clustering. In J. Kacprzyk, editor, ECommerce and Intelligent Methods. Springer, 2002. [25] J. O’Madadhain, D. fisher, P. Smyth, S. White, and Y. Boey. Analysis and visualization of network data using jung. In Available online at http://jung.sourceforge.net/doc/index.html, 2005. [26] J. Pitkow and K. Bharat. Webviz: A tool for world wide web access log analysis. In Proc. of the First Int. World-Wide Web Conference, pages 271–277, 1994. [27] M. Rifqi. Constructing prototypes from large databases. In Proc. of IPMU’96, 1996. [28] E. Rosch. Principles of categorization. In E. Rosch and B. Lloyd, editors, Cognition and categorization, pages 27– 48. Lawrence Erlbaum associates, 1978. [29] M. Spiliopoulou and L. Faulstich. Wum: a web utilization miner. In Workshop on the Web and Data Bases, WebDB’98, pages 109–115, 1998. [30] A. Youssefi, D. Duke, and M. J. Zaki. Visual web mining. In ACM, editor, Poster Proc. of WWW’04 Conference, 2004.