IEEE TRANSACTIONS ON MEDICAL IMAGING, VOL. 34, NO. 1, JANUARY 2015
179
A Novel Multiple-Instance Learning-Based Approach to Computer-Aided Detection of Tuberculosis on Chest X-Rays Jaime Melendez*, Bram van Ginneken, Pragnya Maduskar, Rick H. H. M. Philipsen, Klaus Reither, Marianne Breuninger, Ifedayo M. O. Adetifa, Rahmatulai Maane, Helen Ayles, and Clara I. Sánchez
Abstract—To reach performance levels comparable to human experts, computer-aided detection (CAD) systems are typically optimized following a supervised learning approach that relies on large training databases comprising manually annotated lesions. However, manually outlining those lesions constitutes a difficult and time-consuming process that renders detailedly annotated data difficult to obtain. In this paper, we investigate an alternative approach, namely multiple-instance learning (MIL), that does not require detailed information for optimization. We have applied MIL to a CAD system for tuberculosis detection. Only the case condition (normal or abnormal) was required during training. Based upon the well-known miSVM technique, we propose an improved algorithm that overcomes miSVM’s drawbacks related to positive instance underestimation and costly iteration. To show the advantages of our MIL-based approach as compared with a traditional supervised one, experiments with three X-ray databases were conducted. The area under the receiver operating characteristic curve was utilized as a performance measure. With the first database, for which training lesion annotations were available, our MIL-based method was comparable to the supervised system ( versus ). When evaluating the remaining databases, given their large difference with the previous image set, the most appealing strategy was to retrain the CAD systems. However, since only the case condition was available, only the MIL-based system could be retrained. This scenario, which is common in real-world applications, demonstrates the better adaptation capabilities of the proposed approach. After retraining, our MIL-based system significantly outperformed the supervised one ( versus and versus , and , respectively). Manuscript received July 01, 2014; revised August 04, 2014; accepted August 15, 2014. Date of publication August 22, 2014; date of current version December 24, 2014. Asterisk indicates corresponding author. *J. Melendez is with the Department of Radiology and Nuclear Medicine, Radboud University Medical Center, 6525 GA Nijmegen, The Netherlands (e-mail:
[email protected]). B. van Ginneken, P. Maduskar, R. H. H. M. Philipsen, and C. I. Sánchez are with the Department of Radiology and Nuclear Medicine, Radboud University Medical Center, 6525 GA Nijmegen, The Netherlands. K. Reither is with the Swiss Tropical and Public Health Institute, 4051 Basel, Switzerland, and also with the Ifakara Health Institute, Bagamoyo, United Republic of Tanzania. M. Breuninger is with the Swiss Tropical and Public Health Institute, 4051 Basel, Switzerland, and also with the Albert-Ludwigs-University, 79085 Freiburg, Germany. I. M. O. Adetifa and R. Maane are with the Medical Research Council Unit, 81657 Gambia. H. Ayles is with the Zambia AIDS-Related Tuberculosis Project (ZAMBART), University of Zambia School of Medicine, 260 211 Lusaka, Zambia, and also with the Department of Infectious and Tropical Diseases, London School of Hygiene and Tropical Medicine, WC1E 7HT London, U.K. Color versions of one or more of the figures in this paper are available online at http://ieeexplore.ieee.org. Digital Object Identifier 10.1109/TMI.2014.2350539
Index Terms—Chest radiography, computer-aided detection (CAD), multiple-instance learning (MIL), tuberculosis.
I. INTRODUCTION
D
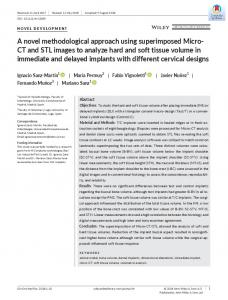
ESPITE the advances in medicine and the development of nonexpensive and effective treatments, tuberculosis (TB) is still one of the greatest killers worldwide. It is estimated that in 2012, 8.6 million new TB cases occurred, and 1.3 million people died from this disease [1]. TB is highly contagious, and the inhalation of a few bacteria (Mycobacteria tuberculosis) is enough for a person to become infected. For this reason, early detection and diagnosis are crucial to stop its dissemination. Although several tests for TB diagnosis, either latent (e.g., Mantoux test or interferon-gamma release assay) or active (e.g., sputum culture or Xpert MTB/RIF), exist, their application is usually hampered by the medium to long time required to process a sample, their complexity or their relative high cost, if we take into account that the regions with the highest TB burden in the world are among those with the lowest economic resources. Within this context, chest radiography is the subject of renewed interest as a complementary tool in TB diagnostic algorithms, as it can be much cheaper and faster, and can enable identification of TB suspects with the highest risk of disease. Unfortunately, assessing chest radiographs (CXRs) requires specialized personnel that are not always available, which is a major obstacle toward their use, especially in the aforementioned resource-constrained regions. Considering these circumstances, computer-aided detection (CAD) systems can prove valuable, as they can produce the desired assessment with limited or no human intervention at all (e.g., [2]–[4]). Typically, for TB detection, a posterior-anterior CXR is used as the input, and the computer searches the depicted lung region for any abnormalities that could be present. As a result, an overall score indicating the likelihood that radiological abnormalities suggestive of the illness are found is obtained. In addition, the detected abnormalities may also be prompted. Such information can be of great utility to evaluate the initial extent of the disease or its progress or remission in a follow-up examination. As an example, Fig. 1 shows a CXR of a TB suspect (left) and the output yielded by the CAD system utilized in [2] (right), which consists of both an image score and a heat map showing the abnormal regions (in warm colors).
0278-0062 © 2014 IEEE. Personal use is permitted, but republication/redistribution requires IEEE permission. See http://www.ieee.org/publications_standards/publications/rights/index.html for more information.
180
Fig. 1. A CXR corresponding to an ill subject (left) and the output yielded by the CAD system utilized in [2] (right). Regions with a high abnormality score are shown in warm colors.
Given that an image score above 50 in the [0 100] range indicates abnormality, with the assigned score of 85, this particular subject is though to be affected by TB. Besides the authors’ related work (e.g., [2], [4], [5]), which is partially described in Section II-A, only a few CAD systems dealing with the problem of full-fledged TB detection on CXRs have been reported. For instance, Noor et al. [6] analyzed CXRs with the Daubechies wavelet and processed the resulting features with a modified principal component analysis algorithm and discriminant functions. Rijal et al. [7] proposed a method based on phase congruency to measure the transition between pixels representing normal and infected tissue. The average, variance, coefficient of variation and maximum were used as features. Tan et al. [8] calculated statistical moments of the gray-scale values of the segmented lung fields, which were then classified by means of adaboost using C4.5 stumps as weak learners. More recently, Jaeger et al. [3] evaluated two sets of features consisting of shape, edge and texture histograms, as well as statistical moments. The distance to the hyperplane determined by a linear SVM was used as a confidence measure. In addition to these methods, other approaches addressed only specific TB manifestations such as cavities [9], military pattern [10], etc. Further references can be found in [11]. Considering the current developments, the performance of CAD for TB detection is usually comparable to that of field officers but still lacks behind that of specialists (see, e.g., [2], [3] and [2, Table 4]). In order to achieve the best performance in real scenarios (e.g., [4] and [5, Ch. 7]), CAD systems are commonly trained on large CXR databases containing both positive and negative examples of TB. Since not all the lung pixels on abnormal images are necessarily abnormal, accurate annotations outlining the affected areas are often required, so the pattern recognition algorithms embedded in those systems can correctly learn to discriminate between normal and abnormal parenchyma. In machine learning terminology, this strategy is known as the supervised approach and is arguably the most powerful in terms of classification accuracy, as it utilizes detailed information regarding the condition of the training cases. However, the usual way to obtain such a level of detail is to have human readers manually annotating the affected areas, which has several disadvantages. First, manually annotating a large X-ray data set is a tedious and time-consuming task. Second, in cases such as TB,
IEEE TRANSACTIONS ON MEDICAL IMAGING, VOL. 34, NO. 1, JANUARY 2015
the diffuse aspect of the lesions of interest makes them difficult to be accurately outlined [7]. Third, the availability of qualified readers may not be guaranteed; therefore, the provided training information may not always reach the expected levels of detail. Fourth, if a database is annotated by different readers, substantial differences or even disagreement (inter-observer variability) are very likely [12]–[14]. Fifth, there is always the chance of erroneous annotation due to misinterpretation [11], [12], [15]. Finally, if new training data becomes available, the annotation process must be carried out again for those data to become usable. Clearly, the traditional supervised approach, although highly accurate, has several limitations that undermine CAD development and deployment. In this paper, we investigate an alternative machine learning approach, known as multiple-instance learning (MIL) [16], that does not require labeling of each feature sample during training but only a global class label characterizing a group of samples. Considering our TB detection problem, this means that just the condition at the image level would suffice for a CAD system to be trained, which is extremely advantageous, as that kind of labeling is much easier to obtain than lesion outlines. We start with the heuristic described in [17] to solve the maximum pattern margin support vector machine (miSVM) formulation as our baseline method. Then, we propose a novel algorithm, specifically designed for our CAD application, that aims at addressing issues related to underestimation of the positive instances and costly iteration. The key of the proposed algorithm is to use probability estimates instead of the sign of the decision function to guide the MIL process. With appropriate parameter tuning, this approach allows us to completely avoid the original miSVM iteration. In addition, we deal with the label uncertainty resulting from instance reclassification, which may, otherwise, lead to decreased sensitivity. To show the advantages of the proposed method, we compare the performance of our MIL-based CAD system with the one yielded by its supervised counterpart in detecting textural abnormalities related to TB. Moreover, we evaluate both systems on several image databases that differ both in characteristics and labeling detail (i.e., with lesion annotations or image labels only). The objective is to emulate a typical scenario found in CAD, where a given system optimized for operation under some initial setup (e.g., trained with a group of images acquired by a particular device) has to maintain its original (good) performance under varying conditions. Depending on how large the differences are, probably the best alternative would be to retrain and optimize the system taking into account the new data. While this would be possible, or at least much easier, for the MIL-based system, the lack of lesion outlines would render retraining of the supervised system inapplicable unless lesion annotation is carried out. Although MIL has been an active research topic in the machine learning community during the past decades, it has been only sparingly applied to medical image analysis and CAD (see, e.g., [18]–[23]). In fact, to the best of our knowledge, our work is the first attempt to develop a CAD system by explicitly exploiting the low requirements of MIL in terms of annotation detail that proves successful by showing highly competitive results with respect to a supervised approach. Furthermore, we
MELENDEZ et al.: CAD OF TUBERCULOSIS ON CHEST X-RAYS
believe that this is the first time that a MIL-based CAD system is shown to supersede its supervised counterpart given an adverse scenario with changing operating conditions and lack of lesion-level information, which highlights the great potential of the proposed method for deployment in real-world applications. The work presented in this paper builds upon the preliminary results reported in [24]. The key contributions with respect to [24] are: • The main goal of [24] was to investigate if MIL could be a competitive alternative to supervised classification for CAD applications, whereas in the current paper we show that a MIL-based approach is not only competitive but even more advantageous considering adverse scenarios where complete reoptimization of a CAD system is required, and only limited training information is available. • To prove our previous point, the evaluation conducted in this study involves much richer data. • In order to accomplish the more challenging goal pursued in this study, a more capable MIL algorithm is proposed. As shown through experimentation, addressing the limitations of the previous algorithm is crucial to deal with different operating conditions. • The baseline system utilized in [24] included a sophisticated preprocessing stage (see [24, ref. 1]) that homogenized the input data and, thus, contributed to the success of the evaluated methods. In the current study, such a preprocessing stage is not included, as the aim is to improve the pattern recognition component independently of any external factor. As shown by our experimental results, the proposed MIL method is successful despite that omission. The remaining of the paper is organized as follows. Section II elaborates on both the supervised CAD system and the MILbased CAD approach evaluated in this study. Section III describes the new MIL method proposed for our CAD application and provides details about its main components. Section IV shows our experimental results, which are then discussed in Section V. The last section concludes the paper. II. SUPERVISED VERSUS MIL-BASED CAD FOR TB DETECTION A. Supervised CAD System The defining characteristic of a supervised approach is the use of labeled data during training; thus, each provided example consists of an input (typically a feature vector) and a desired output. The supervised CAD system evaluated in this study adheres to this strategy. It has been developed by the Diagnostic Image Analysis Group, Nijmegen, The Netherlands. Since the system addresses the TB detection problem by means of supervised pixel classification, feature vectors are associated with image pixels, and the labels of those vectors are determined according to the available lesion annotations. Then, once trained, the system is expected to infer the correct labels of unknown data. Two main stages, namely texture feature extraction and pixel classification, are involved in the whole process. They are explained in detail below. During texture feature extraction, features based on the first four moments of the intensity distributions resulting after ap-
181
plying a multiscale local jet of second order [25] on a subsampled version of the input image (1024 pixels wide) are obtained. These moments are computed inside the lung fields on a grid with a spacing of 8 pixels considering circular patches with a radius of 32 pixels [26]. Several spatial features, such as the normalized horizontal and vertical positions, and the distances to the lung wall and the center of gravity of both lungs, complement the lung parenchyma characterization. In the next stage, classification of each of the previously obtained feature vectors is carried out by a k-nearest neighbors (k-NN) classifier. The k-NN classifier is trained by following the supervised setting explained before. One particularity, however, is that the feature vectors corresponding to normal pixels in abnormal images are not taken into account. The reason is that, due to the diffuse and sometimes subtle nature of the lesions associated with TB, it is not possible to guarantee that the normal regions from abnormal images are indeed completely normal. After texture classification, a heat map indicating the abnormality of each pixel belonging to lung parenchyma is produced. To aggregate the classifier output into a single image score, the 95th percentile from the cumulative distribution of patch scores is computed [27]. Since the MIL approaches evaluated in this study are based on SVMs (see the next sections), and SVMs lead to a better performance than k-NN for supervised classification (see Section IV-E), besides the k-NN classifier mentioned above, we experiment with an SVM provided with a Gaussian kernel as the main pattern recognition component of the supervised CAD system. In this way, we can compare our MIL-based approach with the best supervised alternative available. B. MIL-Based CAD System The alternative MIL-based CAD system investigated in this study comprises the same stages as the supervised one but replaces the supervised classifier with a MIL-based technique. MIL is a generalization of supervised classification that associates training class labels with sets of patterns (referred to as bags) instead of individual patterns (referred to as instances) [16], [28]. Although every instance may possess a true class label, it is assumed that this label can only be indirectly accessed through its corresponding bag label. By definition, a bag receives a particular class label if at least one of its instances possesses that label. In the case of binary classification, this means that a bag is labeled positive if at least one of its instances is positive. As a result, the utilized classifier has to learn how to deal with the ambiguity of not knowing which of the instances are positive and which are negative. This added requirement with respect to supervised classification makes MIL more challenging but, at the same time, more interesting. If instead of regarding the lack of knowledge about the labels of the individual patterns as a limitation we think of it as a simplification, the advantage of MIL considering CAD applications becomes evident: detailed lesion annotations are no longer required for training, as the case- or image-level condition provides all the necessary information. For our TB detection problem, in particular, labeling a CXR as abnormal is clearly much easier than accurately outlining its abnormal regions. Moreover, moving from the previous supervised approach to a MIL-based one is
182
IEEE TRANSACTIONS ON MEDICAL IMAGING, VOL. 34, NO. 1, JANUARY 2015
straightforward, as the CXRs naturally become the bags and, consequently, the texture feature vectors associated with lung parenchyma become the instances. miSVM Formulation: Taking into account the above MIL setting, we have explored the miSVM formulation proposed in [17] as our baseline method. It bears the crucial advantage of allowing instance-level scores to be recovered after classification, which in turn let us to compose heat maps showing the affected lung regions as with any supervised approach. This feature is not offered by other MIL methods such as citation k-NN [29], diverse density SVM (DD-SVM) [30], generalized expectation-maximization diverse density (GEM-DD) [31] or multiple-instance learning with instance selection (MILIS) [32] that only yield bag-level scores and, thus, limit the amount of information that could be output. Another interesting property of miSVM is that it attempts to select all the true-positive instances in the positive bags during training and not just a single or a few representatives as related methods such as maximum bag margin SVM (MISVM) [17], expectation-maximization diverse density (EM-DD) [33], random walk SVM (RW-SVM) [34] or multiple-instance learning via disambiguation (MILD) [35] do. By selecting the most positive instances, it is likely that these methods will only learn from samples corresponding to the obvious lesions, while disregarding the samples corresponding to the more subtle ones. As a consequence, they may lead to decreased sensitivity. On the other hand, the drawback of miSVM is that it could allow some false-positive instances to be selected as well. However, as long as the true-positive instances dominate the positive set in the training data, the instance-based SVM used by the algorithm will be able to deal with the resulting ambiguity. Besides the alternatives discussed above, other label imputation methods such as multiple-instance learning via embedded instance selection (MILES) [36] attempt to identify the positive instances in the negative bags in addition to the positive instances in the positive bags. However, such an approach is not necessary in our case, as all the instances from normal images are believed to be normal. Therefore, if we were to modify their labels during training, the system’s specificity might be compromised. Given the instance labels , , , with being the number of training instances , and the bag labels , , , with being the number of training bags , , the miSVM formulation can be written as
Fig. 2. Heuristic for miSVM optimization proposed in [17].
standard soft-margin SVM [37]. The modified set of constraints with respect to the latter aims at enforcing the MIL problem definition. In this way, the soft-margin criterion is maximized jointly over possible label assignments and hyperplanes under the condition that at least one instance from every positive bag is in the positive halfspace, while all patterns belonging to the negative bags are in the negative halfspace. Since the miSVM formulation leads to a challenging computational problem, the solution is obtained by the optimization heuristic shown in Fig. 2. III. PROPOSED MIL METHOD Despite the advantageous features discussed in the previous section, we have observed several issues with the miSVM heuristic shown in Fig. 2 that lead to low performance given our CAD application. Those issues are as follows. 1) Underestimation of the number of positive instances in the positive bags1 2) Slow configuration-dependent convergence. 3) Label uncertainty due to instance reclassification. Therefore, in order to tackle these problems, we propose the alternative algorithm for miSVM optimization shown in Fig. 3. One major difference with respect to the original miSVM heuristic is that we use probability estimates, , instead of the SVM’s decision values, , when deciding what instances should be relabeled. In this way, problem 1 is addressed, as there is now more control over the positive instances to be kept. Furthermore, by properly tuning the probability threshold, , the iterative procedure can be eliminated, which leads to a single-iteration version of the proposed algorithm and, thus, solves problem 2. Finally, by discarding the instances that change their label after reclassification, the uncertainty mentioned in problem 3 is avoided. In the following sections, we elaborate about the key components that make up the proposed method. A. Adding Probability Estimates
(1) where and are the weight vector and the offset of the SVM, respectively, is the penalization parameter for the misclassified instances, and are slack variables as known from the
One major drawback of the original miSVM heuristic is that, given our training data, it tended to underestimate the number 1Although this issue is specifically referred to as underestimation of the number of positive instances in the positive bags, in general, either underestimation or overestimation may be experienced depending on the characteristics of the training data. The solution provided in this paper is also applicable in the latter case.
MELENDEZ et al.: CAD OF TUBERCULOSIS ON CHEST X-RAYS
183
during iterative refinement. The model for probability estimation is given by (2)
Fig. 3. New algorithm for miSVM optimization.
Fig. 4. The effect of sigmoid fitting during the first and last iterations of the new algorithm proposed to solve the miSVM problem. Notice the shift of the threshold used to relabel the instances in the positive bags (vertical lines located around 0.08 instead of 0 on the decision value axis).
of positive instances in the positive bags. For example, for the image set from Zambia2 (see Section IV-B), the fraction of positive instances that were still labeled as positive after iterative refinement (i.e., the true-positive instances) was less than half. As a result, the performance yielded by the miSVM-based CAD system was rather poor (see Section IV-E). In order to overcome this problem, we propose to follow a similar probability estimation procedure as the one suggested in [38] and utilize the estimates computed by this procedure instead of the sign of the SVM’s decision function when deciding which instances in the positive bags are to be relabeled 2This kind of analysis can only be conducted on the Zambia database, as it is the only one for which lesion annotations, and thus instance labels, are available.
where is the decision value yielded by the SVM, and and are parameters determined by minimizing the negative log likelihood of the training data (see [38] for details). The motivation to include this probability estimation procedure is twofold. 1) The method in [38] aims at deriving an unbiased training set for fitting the sigmoid function that models the class-conditional densities between the SVM’s margins, which is achieved by means of cross-validation. From here, it is expected that, by including a cross-validation approach during training, a better, unbiased estimate of the instances’ “positiveness” is obtained after classification. This is contrary to the biased approach followed by the original heuristic, where the decision values computed after classifying the exact same training set are assessed with no additional processing. 2) The sigmoid fitting mechanism itself contributes to further modifying the threshold used to relabel the instances in the positive bags as a result of adapting the sigmoid’s parameters to the cross-validated data. Graphically, this modification is observed as a shift of the point where the sigmoid reaches 0.5 with respect to the point where the SVM’s decision function is zero. Fig. 4 shows the aforementioned effect. Notice how the threshold values after the first and last iteration (indicated with vertical lines of the respective colors) are located around 0.08 instead of 0 on the decision value axis. This new probability-driven threshold leads to more instances being labeled as positive than when the sign of the decision function is used. This effect is cumulative along the several iterations that make up the refinement process. Thus, even in this particular example, where the threshold differences seem marginal, the overall changes are substantial. Furthermore, by varying the probability threshold, even more suitable modifications of the final SVM solution can be obtained, since, in this way, it is possible to control the amount of instances that are kept in the positive part of the training set. In addition to the arguments given above in favor of the proposed procedure, the following remarks are worth mentioning: • The cross-validation approach indicated in point 1 is a time-consuming process and may become a burden depending on the number of utilized folds. Therefore, in order to minimize the additional computation time, parallelizing the fold classification routines is suggested. Given the ubiquity of multi-core processors, this task should be easy to accomplish. • Care should be taken when setting the probability threshold used during iterative refinement. For example, by lowering this threshold, more instances would be labeled as positive, and the method will be less prone to underestimation. However, as the number of false positives included in the training set may also increase, the classifiers’ specificity may be compromised. For that reason, the best option
184
IEEE TRANSACTIONS ON MEDICAL IMAGING, VOL. 34, NO. 1, JANUARY 2015
tational issues introduced by the iterative procedure. Note that the nature of this approach is opposite to the one exposed in the previous section, which actually pointed at lowering the probability threshold in order to improve the performance. The reason is that, in the current case, there will be no cumulative effect due to the absence of iteration. Once a relabeled training set is obtained, a standard supervised SVM can be trained. C. Discarding the Negative Samples of the Positive Bags
Fig. 5. Accumulated percentage of changed labels per refinement iteration.
would be to treat the probability threshold as a free parameter and tune it appropriately according to the particularities of the given data. • Although it could be argued that a similar varyingthreshold strategy could be attempted directly on the decision values, their uncalibrated nature would make it difficult to specify a sensible setting. Moreover, the concept of decision value is not as intuitive and does not convey as much information as the concept of probability. Perhaps, an alternative approach would be to sort the decision values and use a quantile rule to define the threshold. However, such an approach could be influenced by the ratio of positive to negative instances, which would be difficult to estimate and correct for if instance labels are not available. B. Single-Iteration Refinement Another issue with the miSVM heuristic is its slow convergence. This problem, which is also experienced when probability estimates are included, is more or less severe depending on the utilized data, algorithm and parameter set. In fact, we have observed that the number of necessary iterations significantly varied along the different experiments carried out in this study (see, e.g., Table III). On the other hand, we have also observed that the large majority of the initially imputed positive labels changed their value during the first iterations of the refinement process. As an example, Fig. 5 shows that around 87% of the label changes occurred after the first 10 iterations given the image set from Zambia (see Section IV-B). Consequently, the remaining iterations can be regarded merely as a fine tuning step, and we can safely assume that, the later the iteration, the lesser the effect on the computed SVM solution. Considering the above observation and taking advantage of the new feature provided by the probability-driven mechanism described in the previous section, we introduce a further modification that consists of setting the probability threshold to a relatively high value (e.g., 0.6) in such a way that a large fraction of the instances in the positive bags is labeled as negative after the first iteration. As a result, subsequent refinement becomes unnecessary, which allows us to avoid all the compu-
The final improvement with respect to the original miSVM heuristic consists of discarding the instances that were initially imputed as positive but became negative as a result of the refinement process (either after one or several iterations) instead of keeping them in the negative part of the training set. The motivation for this approach is given by the training strategy followed by the supervised CAD system described in Section II-A, which discards the samples belonging to normal regions on abnormal images due to the uncertainty inherent to TB lesions and the lesion annotation process itself. From this perspective, we may safely assume that such uncertainty is also present in the context of MIL-based CAD and is even higher due to the weaker supervision (image labels versus lesion annotations) and the associated possibility of erroneous label imputation. In this sense, if the number of false negatives included in the training set is high, the SVM’s training algorithm may be biased to label similar positive instances as negative during classification, thus decreasing the classifier’s sensitivity. By discarding the uncertain instances, that risk is eliminated. IV. EXPERIMENTS AND RESULTS A. Evaluated Approaches We evaluated the detection performance of five CAD systems, each one using a different pattern recognition approach for pixel classification. The evaluated approaches are listed below: 1) The conventional CAD system described in Section II-A provided with a supervised k-NN classifier. This system will be referred to as k-NN. 2) The conventional CAD system described in Section II-A provided with a supervised SVM. This system will be referred to as SVM. 3) A MIL-based CAD system using the miSVM classifier optimized with the original heuristic proposed in [17] as shown in Fig. 2. This system will be referred to as miSVM. 4) A MIL-based CAD system utilizing the miSVM classifier optimized with the new algorithm shown in Fig. 3, which includes the probability estimation and data discarding procedures described in Sections III-A and III-C. This system will be referred to as miSVM+PEDD. 5) The same system as above but with its classifier optimized with a single iteration of the new algorithm shown in Fig. 3 as explained in Section III-B. This system will be referred to as si-miSVM+PEDD. B. Image Data Three CXR databases collected in Zambia, Tanzania and The Gambia were used in this study. Detailed information is given
MELENDEZ et al.: CAD OF TUBERCULOSIS ON CHEST X-RAYS
TABLE I INFORMATION ABOUT THE CXR DATABASES USED IN THIS STUDY
below and in Table I. Example images are shown in the first column of Fig. 9. The images in the first database were acquired at a busy urban health center in Lusaka, Zambia and correspond to highly TB-suspect subjects. Clinical practice establishes that, based on the outcome of X-ray examination (and symptoms), further tests (e.g., sputum smear, culture, or Xpert) may be performed on these subjects. This image set will be referred to as the Zambia database. The images in the second database were collected in the course of two TB cohort studies at Ifakara Health Institute in Bagamoyo, Tanzania. Study participants were recruited from adult individuals actively presenting to different clinics in the area and reporting symptoms suggestive of TB. This image set will be referred to as the Tanzania database. The images in the third database correspond to a subset obtained from the national TB prevalence survey that was carried out in The Gambia between December 2011 and January 2013. As such, not all the individuals were symptomatic, which is a major difference between this population and the previous two. Examinations were conducted at 80 clusters that adhered to WHO guidelines for TB prevalence surveys. This image set will be referred to as the Gambia database. All the databases correspond to a random sample of their original populations (in the latter case, taking into account only those images having consensus; see later). Each of the databases was divided into a training and a test set with similar proportions of normal and abnormal cases. Given the CXR-based methodology followed in this study, case condition was established by means of radiological evidence. The images from Zambia and Tanzania were assessed by certified readers trained according to the CRRS tuberculosis scoring system [39]. In case of doubt, the assessment was verified by an experienced chest radiologist. The images from The Gambia were read both by clinical officers and a central panel of radiologists. The subset utilized in our experiments corresponds to images for which both readings agreed. Leaving aside the aforementioned characteristics, the most relevant aspects of these databases in the context of the current study are the various scanning devices utilized to acquire the CXRs and the different levels of detail of the available labeling (lesion annotations or image labels). These differences allow us to emulate an adverse situation with varying conditions that is suitable to determine the strengths and weaknesses
185
of both the supervised and MIL-based CAD systems. In this respect, the Zambia database represents the baseline, favorable scenario, where both training and test images are similar, and detailed annotations are available; therefore, both the supervised and MIL-based systems can be appropriately optimized. Conversely, for the remaining databases, the operating conditions are worsened, as the images to be evaluated significantly differ from the ones in the previous database, which were used to train the CAD systems. Under the new conditions, perhaps the most appealing approach would be to retrain the systems. However, while retraining is possible for the MIL-based systems, given the availability of image labels, this is not an option for the supervised systems, as there is not enough information for their training algorithms to proceed. The results shown in Section IV-E take into account these conditions. Thus, while all the results reported for the supervised approaches (k-NN and SVM) correspond to systems trained on the Zambia database only, the results reported for the MIL-based approaches (miSVM, miSVM+PEDD, and si-miSVM+PEDD) correspond to systems that were (re)trained on each database. Nevertheless, although the supervised systems could not be retrained on the Tanzania and Gambia databases, in an attempt to obtain their best performance, we rescaled the images in the Zambia database in such a way that the pixel intensity distribution inside the lung fields was similar either to the one of the Tanzania or the one of the Gambia database, depending on which database was evaluated. Afterwards, the supervised systems were retrained accordingly, using the modified image sets. C. Evaluation Detection performance was evaluated using case-based receiver operating characteristic (ROC) analysis. The area under the ROC curve (AUC) was utilized as a performance measure. Statistical significance of the performance difference between pairs of evaluated approaches was determined by means of DeLong’s test [40]. Given the aim of the study, comparisons with the supervised approach (SVM) and the original miSVM method (miSVM) were of paramount importance; therefore, five comparisons per experiment (SVM versus miSVM, miSVM+PEDD and si-miSVM+PEDD, and miSVM versus miSVM+PEDD and si-miSVM+PEDD) were carried out. Due to the multiple comparisons, performance differences were considered significant if (0.05/5) by applying the Bonferroni correction. Besides the detection performance, the training time of the compared approaches and the number of iterations performed by the MIL methods until convergence was reached was also measured. An Intel i5 computer at 3.10 GHz with 12 GB of RAM was utilized for this purpose. D. Classifier Configuration Since soft-margin SVMs provided with the Gaussian kernel were used in our experiments, careful parameter selection was required in order to obtain a reasonable (hopefully, the best) performance. The two optimized parameters were the penalization coefficient, [see (1)], and the width of the Gaussian function, . In addition, appropriate values for the probability threshold,
186
IEEE TRANSACTIONS ON MEDICAL IMAGING, VOL. 34, NO. 1, JANUARY 2015
Fig. 6. ROC curves yielded by the evaluated approaches on the Zambia database.
, of miSVM+PEDD and si-miSVM+PEDD had to be determined. To carry out this process, we adopted well-known strategies such as cross-validation and grid search considering the training set. The number of cross-validated folds was set to two. The search points for and were determined by following similar approaches as the ones described in [41] and [42]. In particular, was separated into two parameters, and , that were, respectively, associated with the normal and abnormal instances. While was set to one, was searched over . For , the grid was set by randomly sampling 1000 data points, computing their pairwise distances and deriving the 5th, 10th, 30th, 50th, 70th, 90th, and 95th percentile, with results for each percentile being averaged over ten trials. Finally, for , values in the set were explored. The performance yielded by the different parameter combinations was assessed by means of the AUC. The basic SVM algorithms corresponded to those implemented in LIBSVM [43]. Regarding the k-NN classifier, the number of nearest neighbors was set according to [5]. A value of was found optimal.
Fig. 7. ROC curves yielded by the evaluated approaches on the Tanzania database.
Fig. 8. ROC curves yielded by the evaluated approaches on the Gambia database.
E. Results The detection results for the evaluated approaches are listed in Table II. Statistical significant differences are shown in bold. Additional results, in the form of ROC curves, are shown in Figs. 6–8. The measured training times and the number of performed iterations are reported in Table III. Nonparallelized implementations of the proposed MIL algorithms were used. V. DISCUSSION Before discussing the main results of the paper, we first assess the performance of the two supervised methods evaluated in our experiments. The results in Table II indicate that SVM is at least comparable and most times better than k-NN, which is
the classifier utilized by the original supervised CAD system described in Section II-A. As stated before, the selection of SVM as the supervised technique to compare with was not only motivated by its similarity to the MIL-based methods but mainly by the intention of comparing with the best supervised classifier available. Although previous work [2] has shown that a related system using a k-NN classifier can achieve a higher AUC (0.91) than the ones reported in this paper for data obtained from the same population (Zambia), substantial differences in the experimental setup make direct comparison with the current study inaccurate. First, the test set evaluated in [2] was composed of only 161 CXRs, whereas the test set evaluated in this study was almost three times larger; as a consequence, we may
MELENDEZ et al.: CAD OF TUBERCULOSIS ON CHEST X-RAYS
187
TABLE II DETECTION PERFORMANCE (AUC) ON THE EVALUATED DATA SETS AND THE -VALUES OBTAINED WHEN COMPARING WITH SVM (VERSUS SVM) AND MISVM (VERSUS MISVM) AS DESCRIBED IN SECTION IV-C. SIGNIFICANT DIFFERENCES ARE SHOWN IN BOLD
CPU TIME
AND
NUMBER
OF ITERATIONS
TABLE III REQUIRED BY SVM AND THE MIL-BASED METHODS REPORTED CPU TIMES ARE IN SECONDS
cover a wider variety of patterns. Second, the percentage of abnormal cases in [2] was 75%, which is much higher than the 54% corresponding to our data set; therefore, more favorable conditions for automatic detection may have been provided. Third, while the training set used in this study consisted of 461 images, the training set used in [2] was more than two times larger (945 images); thus, more relevant examples from which to learn may have been found. Finally, the texture-based system evaluated in [2] was paired with an additional module that aimed at detecting CXRs containing substantial parenchymal abnormalities that may lead to erroneous segmentation of the lung fields; therefore, the performance reported in [2] corresponds to a combination of systems and not to a single system as in the current paper. In view of this argumentation (and despite similar issues), a recent study by Muyoyeta et al. [4], in which a larger test set is evaluated, may be a more suitable reference. There, an AUC of 0.84 is reported for k-NN. Thus, given our and others’ results, we conclude that SVM is the best choice for the supervised CAD system and will only include this supervised alternative in the following discussion. Starting with the baseline scenario, where lesion annotations are available, the results in Table II show that SVM obtains a higher AUC than the remaining approaches, although the difference is significant only when comparing with miSVM ( ; and in the other cases). This higher AUC is not surprising, as, by definition, the supervised system exploits the provided information to the greatest extent, whereas the MIL-based approaches take into account partial knowledge only. However, we should notice that the difference between SVM and si-miSVM+PEDD is not considerable, which demonstrates that highly competitive results can be obtained with the proposed method despite the limited amount of supervision. Thus, by following our approach, it would be possible to develop CAD systems that achieve good performance, while avoiding the time-consuming lesion annotation process.
TO
COMPLETE THEIR TRAINING STAGE.
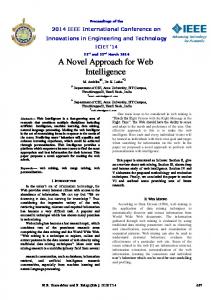
Our experimental results on the Zambia database also indicate that the proposed algorithm introduced to overcome the pitfalls of the original miSVM heuristic achieved not only a significant but a substantial improvement, which is noticeable in terms of both AUC and heat maps. For instance, columns three to five of the first row of Fig. 9 show the heat maps produced by miSVM, miSVM+PEDD, and si-miSVM+PEDD for an abnormal case. While miSVM+PEDD and si-miSVM+PEDD clearly prompt the lesions on both lungs and assign an image score that indicates abnormality (above 50), miSVM barely highlights the affected zones. The reason, as mentioned in Section III-A, is that miSVM tends to underestimate the number of true-positive instances in the positive bags during training, which leads to decreased sensitivity. Considering the Zambia database, miSVM retained 44.94% of the true positives, whereas miSVM+PEDD and si-miSVM+PEDD retained 55.75% and 84.01% of the true positives, respectively. As a result, more truly abnormal examples from which to learn were available for the latter approaches; therefore, they could better identify the abnormal instances of the test images. However, along with the increased sensitivity, there is a side effect that consists of allowing more false-positive instances to remain in the positive bags. Since these instances are regarded as truly positive examples during the final training step, the resulting model may become slightly more aggressive. This effect can be observed in the first two rows of Fig. 9, where miSVM+PEDD and si-miSVM+PEDD highlight more erroneous regions than miSVM. Nevertheless, those false-positive detections are not relevant compared with the true-positive detections, and the score assigned at the image level reflects the true condition of the cases. Comparing si-miSVM+PEDD to miSVM+PEDD in terms of AUC, the former performed only slightly better than the latter; however, despite the similar performance, we believe that there is indeed a limiting factor in miSVM+PEDD that
188
IEEE TRANSACTIONS ON MEDICAL IMAGING, VOL. 34, NO. 1, JANUARY 2015
Fig. 9. Examples of CXRs (first column) and the heat maps and scores produced by the evaluated approaches (second to fifth columns). The CXRs are shown with their image label. Annotated lesions (only available for the Zambia database) are outlined in red. On the heat maps, warm colors indicate abnormality.
MELENDEZ et al.: CAD OF TUBERCULOSIS ON CHEST X-RAYS
may lead to suboptimal system configuration. Our reasoning is that the cumulative effect of the iterative procedure utilized by miSVM+PEDD contributes to increase the difficulty of the parameter selection process, as the parameter set is kept constant along all the iterations. This observation is also valid for miSVM. Probably, by optimizing the parameter set at each iteration, a more accurate model could be obtained. Unfortunately, such an approach would drastically increase the training time, unless an elaborate parallelization strategy is devised. One option would be to utilize the cross-validation procedure carried out during probability estimation to also optimize the SVM parameters. However, even in that case, the probability threshold would still have to be optimized in a separate cross-validation loop. In this regard, si-miSVM+PEDD constitutes a more advantageous alternative, as it yields comparable results, while avoiding any performance issues associated with an iterative approach. Moving to the Tanzania database, the most noticeable outcome is the considerable drop in performance of SVM. This is certainly a consequence of the (large) difference between the images in this set and the images in the Zambia database, which were used to train the system. Apparently, the mismatch between image sets goes beyond pixel intensity differences, as performance degradation was experienced after correcting the pixel intensity distributions as indicated in Section IV-B. By inspecting the heat maps yielded by SVM (e.g., second column of rows three and four of Fig. 9), we can identify the reason behind its performance drop. While the system maintained its high sensitivity, as shown by the detected lesion on the abnormal image and the high assigned score, it was not able to maintain its high specificity and produced a large number of false-positive detections (mostly rib crossings and other bony structures). The MILbased approaches, on the other hand, being optimized according to the particularities of the new data, achieved a significantly better performance in most cases ( , , and for si-miSVM+PEDD, miSVM+PEDD, and miSVM, respectively) and remained consistent with the results reported on the previous database. Among the MIL-based methods, both versions of the proposed algorithm yielded again a significantly higher AUC than the original miSVM heuristic ( and for si-miSVM+PEDD and miSVM+PEDD, respectively). This difference is also appreciated on the obtained heat maps (e.g., Fig. 9, columns three to five of rows three and four), where the actual lesions are more strongly indicated by si-miSVM+PEDD and, especially, by miSVM+PEDD. The downside in the latter case is that more false-positive detections are also present. As with the previous database, the parameters determined for si-miSVM+PEDD, in particular the probability threshold, seem to be slightly more adequate than those determined for miSVM+PEDD. In this sense, the more conservative probability threshold set for si-miSVM+PEDD results in less false-positive detections and even virtually “clean” maps for a large number of normal images. A similar trend as with the image set from Tanzania is observed on the Gambia database, although, in this case, the AUC values are much higher. In general, the lesions in this set are more perceptible than in the previous databases; therefore, the
189
detection task is easier. Under those favorable conditions, even SVM achieved good performance despite being trained on a different image set. Notwithstanding, the same issues related to lower specificity pointed out before are also evident here as shown in the second column of rows five and six of Fig. 9, where several false-positive detections are visible, especially on the normal image. As a result, the performance of SVM is again significantly lower than the performance yielded by both versions of the proposed MIL method ( and for si-miSVM+PEDD and miSVM+PEDD, respectively). Given the greater conspicuousness of the lesions in the Gambia database, the gap between miSVM and both versions of the proposed MIL method is also narrower than before. While there is still a significant difference when comparing with miSVM+PEDD , the difference with si-miSVM+PEDD is not significant anymore . Nevertheless, there are several cases where both miSVM+PEDD and si-miSVM+PEDD are more confident about truly affected lung areas as shown in columns three to five of row five of Fig. 9. The better assessment of those cases leads to an overall higher sensitivity. Regarding specificity, the three MIL-based systems are comparable and, in general, produce very clean heat maps and low scores for normal images (e.g., columns three to five of the last row of Fig. 9). Besides the whole-curve analysis (in terms of AUC) discussed above, additional assessment at particular operating points related to the intended application of the evaluated CAD methodology is worth to be carried out. In this respect, we may consider triage as the most relevant application, especially in the context of screening. In this context, the CAD score could be used as a screening tool prior to Xpert or culture in such a way that the human reading burden is minimized (ideally eliminated), and the efficiency of the subsequent tests (whose availability in high-TB-prevalence regions is often limited) is maximized. Since under screening settings a low false negative rate is desirable, and a high false positive rate is tolerable [11], an operating point that yields high sensitivity (e.g., above 90%) with at least medium specificity (e.g., above 50%) could be adopted [44]. Considering these settings, similar or even better trends than with the AUC values discussed above are noticed. For instance, as shown in Fig. 6, si-miSVM+PEDD achieves virtually the same sensitivity as SVM while maintaining a substantial gap with respect to miSVM. Next, in Fig. 7, we can observe that the performance difference between si-miSVM+PEDD, and miSVM and SVM is considerable as well. Finally, in Fig. 8, the gap with miSVM is narrowed, but the advantage over SVM is still appreciable. In terms of training time, si-miSVM+PEDD clearly outperformed miSVM and miSVM+PEDD. As shown in Table III, si-miSVM+PEDD took more than 4 and 28 times less CPU time than miSVM and miSVM+PEDD, respectively, in order to optimize the final SVM models. The difference with miSVM could be further increased if a parallelized implementation of si-miSVM+PEDD, as suggested in Section III-A, was utilized. Another important point to take into account in this analysis is the number of iterations required to reach convergence, which is mostly determined by the characteristics of the data. Since such a factor cannot be controlled or even quantified, it would
190
be very difficult to predict how long the training stage of the iterative approaches would take, which is certainly inconvenient in time-constrained applications. Obviously, this is not an issue for si-miSVM+PEDD, as it always performs a single refinement iteration. For completeness, the training time corresponding to SVM is also included in Table III. As it would be expected, it is the lowest one and by a large margin. However, the benefits shown by si-miSVM+PEDD well deserve the increase in training time. Although it is not possible to directly compare the performance of the approaches evaluated in this paper with that of external alternatives reported in the literature due to the differences in methodology and the lack of publicly available databases, we now attempt to highlight certain key characteristics that may serve as a basis for informal assessment. One of those characteristics is, for example, the number and size of the data sets used for experimentation, which is typically restricted to one data set consisting of roughly hundred images (e.g., [6]–[8]). In this regard, the closest study to ours is perhaps the one by Jaeger et al. [3], who experimented with two data sets composed of 138 and 615 CXRs, respectively. While this is still well below the three data sets of more than 850 CRXs considered in our study, it provides a more reliable performance reference than the remaining alternative approaches. Given those two data sets, Jaeger et al. reported AUCs of 0.87 and 0.90, which are quite comparable to the AUCs we obtained. Although other researchers such as Tan et al. [8] reported a higher AUC of 0.93, as pointed out before, experimentation was performed using a small image set (95 CXRs). Another important difference with [3] is the number of utilized features. While sets of 192 and 594 features were computed by Jaeger et al., we used only 106 features independently of the data set being processed. In consequence, we may state that we could achieve similar performance with less feature complexity. Remarkably, the approach in [3] considers the whole lung area as the region of interest (ROI), which leads to a similar labeling scheme to ours, although not to a similar machine learning method. Perhaps, a large number of features as mentioned before is a requirement to achieve reasonable results for such an ROI. Additionally, an issue with this approach is that it does not provide lesion localization, as there is no attempt to perform pixel or region classification. As a result, no output equivalent to a heat map could be obtained. Furthermore, since no detailed classification is available, it is not possible to be sure if the actual lesions are being detected, or if they are truly driving the abnormality scores. Another issue may be the size of the lesions the system can learn to discriminate. Given that a single feature vector is associated with both lung fields, it is likely that the smaller the lesion, the lower the influence in the whole set of histograms and moments computed at this large integration scale. Related to the discussion earlier, one limitation of the current study (and similar studies reported in the literature) is that the evaluation was carried out at the image level, which required all the information provided by the pixel classification stage to be summarized into a single image score with the subsequent loss of detail. Although this kind of evaluation is arguably the most relevant for the type of applications our system is mainly aimed at (e.g., triage), more specific applications may require a more
IEEE TRANSACTIONS ON MEDICAL IMAGING, VOL. 34, NO. 1, JANUARY 2015
detailed or localized assessment or even a different strategy to summarize the scores resulting from pixel classification. In this respect, using the 95th percentile of the pixel scores as the image-level score is a limiting factor of our approach itself, as it is related to the minimum amount of pixels representing diseased tissue a CXR must show in order to be possible to prompt it as abnormal. As future work, we will investigate if a higher percentile provides a better trade-off between detectability and specificity. Another limitation is that the proposed approach has been specifically targeted at detecting textural lesions. Despite being textural abnormalities the predominant manifestations of TB, they certainly not cover the whole spectrum. Thus, although our MIL-based method is believed to be general enough to deal with any problem that follows a classification strategy similar to the one described in this paper, if it was aimed at detecting other types of lesion, some modifications and perhaps a different evaluation scheme may be needed. Apart from the MIL-based methods proposed in this paper, other approaches to adapting to different scenarios while reducing the amount of effort required to optimize a CAD system exist. For instance, one alternative would be to standardize the processed images in order to make the difference among them minimal. The idea would be to have a single training set for CAD optimization and to transform any other input image in such a way that its characteristics are as close as possible as those observed in that training set. Unfortunately, devising this kind of procedure is not trivial, as there are many factors, such as the scanners’ intrinsic parameters or the different proprietary postprocessing algorithms applied by their manufacturers, that have to be taken into account. In addition, the required standardization may also be problem dependent. As our results have shown, correcting for intensity distribution mismatch does not seem to be enough in order to avoid performance degradation. Given that our problem consists of detecting textural abnormalities, perhaps some sort of textural correction procedure that, for example, takes into account the specific filtering mechanisms utilized during feature extraction, would be more appropriate. As can be seen, the type of standardization to apply and its implementation remain open issues and are certainly not as straightforward as retraining a CAD system by taking advantage of the low supervision requirements of MIL. Another option would be to derive invariant features similar to those proposed in the more general computer vision field (e.g., [45]–[47]). The local binary pattern operator, for instance, is by definition invariant to any monotonic gray-scale transformation. However, if the variations experienced when processing different images are more involved than the (rather simple) transformations for which these kind of features are designed, achieving the desired level of invariance would not be possible. Thus, in order to deal with those situations, more elaborate strategies as with the previous alternative would be necessary, and, once again, the advantages of the proposed method become evident. Finally, besides MIL, other machine learning approaches could be applied. For example, a semisupervised learning technique [48], [49] could use a lesion-labeled training set in conjunction with unlabeled data from a new source to improve the prediction performance of a supervised classifier given the
MELENDEZ et al.: CAD OF TUBERCULOSIS ON CHEST X-RAYS
new operating conditions. As shown in [50], MIL and semisupervised learning are closely related, and both approaches, though seemingly different, can be unified under a common framework. However, despite the established links, we believe that, for detection tasks across different settings, the kind of supervision utilized in MIL is more accurate and more informative about the particularities of the new data. While in MIL, labeling of the new training data, even if it is only partial, is given, in semisupervised learning, that labeling (or the way the unlabeled set modifies the labeled set) has to be inferred. VI. CONCLUSION In this paper, a novel CAD approach for detecting tuberculosis on chest X-rays based on multiple-instance learning has been presented. The main advantage of the proposed approach, in comparison to traditional supervised CAD methods, is the lower labeling detail required during optimization. As we have shown, by utilizing image labels instead of precisely outlined lesions, highly competitive results have been obtained. Thus, by following the proposed approach, the time-consuming lesion annotation process commonly carried out to collect training data could be avoided. In addition, the weak supervision required by our method allowed us to easily retrain a previously optimized system in order to adapt to different operating conditions, as when processing images acquired by different devices. Such an expedient feature could largely facilitate (re)deployment of effective CAD solutions in real-word applications. REFERENCES [1] World Health Organization, Global Tuberculosis Report 2013. [2] P. Maduskar, M. Muyoyeta, H. Ayles, L. Hogeweg, L. Peters-Bax, and B. van Ginneken, “Detection of tuberculosis with digital chest radiography: Automatic reading versus interpretation by clinical officers,” Int. J. Tuberc. Lung D., vol. 17, pp. 1613–1620, 2013. [3] S. Jaeger, A. Karargyris, S. Candemir, L. Folio, J. Siegelman, F. Callaghan, Z. Xue, K. Palaniappan, R. K. Singh, S. Antani, G. Thoma, Y.-X. Wang, P.-X. Lu, and C. J. McDonald, “Automatic tuberculosis screening using chest radiographs,” IEEE Trans. Med. Imag., vol. 33, pp. 233–245, 2014. [4] M. Muyoyeta, P. Maduskar, M. Moyo, N. Kasese, D. Milimo, R. Spooner, N. Kapata, L. Hogeweg, B. van Ginneken, and H. Ayles, “The sensitivity and specificity of using a computer aided diagnosis program for automatically scoring chest X-rays of presumptive TB patients compared with Xpert MTB/RIF in Lusaka Zambia,” Plos One, vol. 9, 2014. [5] L. Hogeweg, “Automatic Detection of Tuberculosis in Chest Radiographs,” Ph.D. thesis, Radboud University Medical Center, Nijmegen, The Netherlands, 2013. [6] N. M. Noor, O. M. Rijal, A. Yunus, A. A. Mahayiddin, G. C. Peng, and S. A. R. Abu-Bakar, “A statistical interpretation of the chest radiograph for the detection of pulmonary tuberculosis,” in Proc. IECBES, 2010, pp. 47–51. [7] M. Rijal, H. Ebrahimian, and N. M. Noor, “Determining features for discriminating PTB and normal lungs using phase congruency model,” in Proc. IEEE-EMBS BHI, 2012, pp. 341–344. [8] J. H. Tan, U. R. Acharya, C. Tan, K. T. Abraham, and C. M. Lim, “Computer-assisted diagnosis of tuberculosis: A first order statistical approach to chest radiograph,” J. Med. Syst., vol. 36, pp. 2751–2759, 2012. [9] R. Shen, I. Cheng, and A. Basu. "A hybrid knowledge-guided detection technique for screening of infectious pulmonary tuberculosis from chest radiographs", IEEE T. Biomed. Eng., vol. 57, pp. 2646–2656, 2010. [10] A. Koeslag and G. de Jager, “Computer aided diagnosis of military tuberculosis,” in Proc. PRASA, 2001.
191
[11] S. Jaeger, A. Karargyris, S. Candemir, J. Siegelman, L. Folio, S. Antani, and G. Thoma, “Automatic screening for tuberculosis in chest radiographs: A survey,” Quant. Imag. Med. Surg., vol. 3, pp. 89–99, 2013. [12] R. Koppaka and N. Bock, “How reliable is chest radiography?,” in Toman’s Tuberculosis: Case Detection, Treatment, Monitoring—Questions and Answers, T. Frieden, Ed., 2nd ed. Geneva: World Health Organization, 2004, pp. 51–60. [13] Y. Balabanova, R. Coker, I. Fedorin, S. Zakharova, S. Plavinskij, N. Krukov, R. Atun, and F. Drobniewski, “Variability in interpretation of chest radiographs among Russian clinicians and implications for screening programmes: Observational study,” Brit. Med. J., vol. 331, pp. 379–382, 2005. [14] S. Sakurada, N. T. L. Hang, N. Ishizuka, E. Toyota, L. D. Hung, P. T. Chuc, L. T. Lien, P. H. Thuong, P. T. N. Bich, N. Keicho, and N. Kobayashi, “Inter-rater agreement in the assessment of abnormal chest X-ray findings for tuberculosis between two Asian countries,” BMC Infect. Dis., vol. 12, 2012. [15] R. Piccazzo, F. Paparo, and G. Garlaschi, “Diagnostic accuracy of chest radiography for the diagnosis of tuberculosis (TB) and its role in the detection of latent TB infection: A systematic review,” J. Rheumatol., vol. 91, pp. 32–40, 2014. [16] T. G. Dietterich, R. H. Lathrop, and T. Lozano-Perez, “Solving the multiple instance problem with axis-parallel rectangles,” Artif. Intell., vol. 89, pp. 31–71, 1997. [17] S. Andrews, I. Tsochantaridis, and T. Hofmann, “Support vector machines for multiple-instance learning,” in Proc. Adv. Neural Inf. Process. Syst., 2003, vol. 15, pp. 561–568. [18] J. Bi and J. Liang, “Multiple instance learning of pulmonary embolism detection with geodesic distance along vascular structure,” in Proc. IEEE CVPR, 2007, pp. 1–8. [19] M. M. Dundar, G. Fung, B. Krishnapuram, and R. B. Rao, “Multiple-instance learning algorithms for computer-aided detection,” IEEE Trans. Biomed. Eng., vol. 55, pp. 1015–1021, 2008. [20] D. Wu, J. Bi, and K. Boyer, “A min-max framework of cascaded classifier with multiple instance learning for computer aided diagnosis,” in Proc. IEEE CVPR, 2009, pp. 1359–1366. [21] G. Quellec, M. Lamard, M. D. Abràmoff, E. Decencière, B. Lay, A. Erginay, B. Cochener, and G. Cazuguel, “A multiple-instance learning framework for diabetic retinopathy screening,” Med. Image Anal., vol. 16, pp. 1228–1240, 2012. [22] L. Sun, Y. Lu, K. Yang, and S. Li, “ECG analysis using multiple instance learning for myocardial infarction detection,” IEEE Trans. Biomed. Eng., vol. 59, pp. 3348–3356, 2012. [23] S. Wang, M. T. McKenna, T. B. Nguyen, J. E. Burns, N. Petrick, B. Sahiner, and R. M. Summers, “Seeing is believing: Video classification for computed tomographic colonography using multiple-instance learning,” IEEE T. Med. Imag., vol. 31, pp. 1141–1153, 2012. [24] J. Melendez, C. I. Sánchez, R. H. H. M. Philipsen, P. Maduskar, and B. van Ginneken, “Multiple-instance learning for computer-aided detection of tuberculosis,” in Proc. SPIE Med. Imag., 2014, p. 90351J. [25] B. van Ginneken, M. B. Stegmann, and M. Loog, “Segmentation of anatomical structures in chest radiographs using supervised methods: A comparative study on a public database,” Med. Image Anal., vol. 10, pp. 19–40, 2006. [26] L. Hogeweg, C. Mol, P. A. de Jong, R. Dawson, H. Ayles, and B. van Ginneken, “Fusion of local and global detection systems to detect tuberculosis in chest radiographs,” in Proc. MICCAI, LNCS, 2010, vol. 6363, pp. 650–657. [27] M. Loog and B. van Ginneken, “Static posterior probability fusion for signal detection: Applications in the detection of interstitial diseases in chest radiographs,” in Proc. ICPR, 2004, vol. 1, pp. 644–647. [28] O. Maron and T. Lozano-Perez, “A framework for multiple-instance learning,” in Proc. Adv. Neural Inf. Process. Syst., 1998, vol. 10, pp. 570–576. [29] J. Wang and J.-D. Zucker, “Solving the multiple-instance problem: A lazy learning approach,” in Proc. ICML, 2000, pp. 1119–1125. [30] Y. Chen and J. Z. Wang, “Image categorization by learning and reasoning with regions,” J. Mach. Learn. Res., vol. 5, pp. 913–939, 2004. [31] R. Rahmani, S. A. Goldman, H. Zhang, S. R. Cholleti, and J. E. Fritts, “Localized content-based image retrieval,” IEEE T. Pattern Anal., vol. 30, pp. 1902–1912, 2008. [32] Z. Fu, A. Robles-Kelly, and J. Zhou, “MILIS: Multiple instance learning with instance selection,” IEEE T. Pattern Anal., vol. 33, pp. 958–977, 2011. [33] Q. Zhang and S. A. Goldman, “EM-DD: An improved multiple-instance learning technique,” in Proc. Adv. Neural Inf. Process. Syst., 2002, vol. 14, pp. 1073–1080.
192
IEEE TRANSACTIONS ON MEDICAL IMAGING, VOL. 34, NO. 1, JANUARY 2015
[34] D. Wang, J. Li, and B. Zhang, “Multiple-instance learning via random walk,” in Proc. ECML, LNCS, 2006, vol. 4212, pp. 473–484. [35] W.-J. Li and D.-Y. Yeung, “MILD: Multiple-instance learning via disambiguation,” IEEE T. Knowl. Data Eng., vol. 22, pp. 76–89, 2010. [36] Y. Chen, J. Bi, and J. Z. Wang, “MILES: Multiple-instance learning via embedded instance selection,” IEEE T. Pattern Anal., vol. 28, pp. 1931–1947, 2006. [37] C. Cortes and V. Vapnik, “Support-vector networks,” Mach. Learn., vol. 20, pp. 273–297, 1995. [38] J. Platt, “Probabilistic outputs for support vector machines and comparisons to regularized likelihood methods,” in Proc. Adv. Large Margin Classif., 1999, pp. 61–74. [39] R. Dawson, P. Masuka, D. J. Edwards, E. D. Bateman, L.-G. Bekker, R. Wood, and S. D. Lawn, “Chest radiograph reading and recording system: Evaluation for tuberculosis screening in patients with advanced HIV,” Int. J. Tuberc. Lung D., vol. 14, pp. 52–58, 2010. [40] E. R. DeLong, D. M. DeLong, and D. L. Clarke-Pearson, “Comparing the areas under two or more correlated receiver operating characteristic curves: A nonparametric approach,” Biometr., vol. 44, pp. 837–845, 1988. [41] J. Lesniak, R. Hupse, M. Kallenberg, M. Samulski, R. Blanc, N. Karssemeijer, and G. Székely, “Computer aided detection of breast masses in mammography using support vector machine classification,” Proc. SPIE: Med. Imag., vol. 7963, p. 79631K, 2011.
[42] J. M. Lesniak, R. Hupse, R. Blanc, N. Karssemeijer, and G. Székely, “Comparative evaluation of support vector machine classification for computer aided detection of breast masses in mammography,” Phys. Med. Biol., vol. 57, pp. 5295–5307, 2012. [43] C.-C. Chang and C.-J. Lin, “LIBSVM: A library for support vector machines,” ACM T. Intell. Syst. Comput. Tech. vol. 2, pp. 27:1–27:27, 2011 [Online]. Available: http://www.csie.ntu.edu.tw/~cjlin/libsvm [44] L. Hogeweg, A. Story, A. Hayward, R. Aldridge, I. Abubakar, P. Maduskar, and B. van Ginneken, “Computer-aided detection of tuberculosis among high risk groups: Potential for automated triage,” in Ann. Mtg. Radiolog. Soc. North Amer., 2011. [45] P. Janney and G. Geers, “Texture classification using invariant features of local textures,” IET Image Process., vol. 4, pp. 158–171, 2010. [46] T. Ojala, M. Pietikäinen, and T. Mäenpää, “Multiresolution gray-scale and rotation invariant texture classification with local binary patterns,” IEEE T. Pattern Anal., vol. 24, pp. 971–987, 2002. [47] P. Vacha, M. Haindl, and T. Suk, “Colour and rotation invariant textural features based on Markov random fields,” Pattern Recogn. Lett., vol. 32, pp. 771–777, 2011. [48] O. Chapelle, A. Zien, and B. Schölkopf, Semi-Supervised Learning. Cambridge, MA: MIT Press, 2006. [49] X. Zhu and A. B. Goldberg, “Introduction to semi-supervised learning,” Synth. Lectures on Artif. Intell. Mach. Learn., vol. 3, pp. 1–130, 2009. [50] Z.-H. Zhou and J.-M. Xu, “On the relation between multi-instance learning and semi-supervised learning,” in Proc. ICML, 2007, pp. 1167–1174.