A parallel point cloud clustering algorithm for subset segmentation and outlier detection Christian Teutsch*a, Erik Trostmanna, Dirk Berndta Fraunhofer Institute for Factory Operation and Automation, Sandtorstr. 22, 39106 Magdeburg, Germany
a
ABSTRACT We present a fast point cloud clustering technique which is suitable for outlier detection, object segmentation and region labeling for large multi-dimensional data sets. The basis is a minimal data structure similar to a kd-tree which enables us to detect connected subsets very fast. The proposed algorithms utilizing this tree structure are parallelizable which further increases the computation speed for very large data sets. The procedures given are a vital part of the data preprocessing. They improve the input data properties for a more reliable computation of surface measures, polygonal meshes and other visualization techniques. In order to show the effectiveness of our techniques we evaluate sets of point clouds from different 3D scanning devices. Keywords: point cloud, segmentation, outlier removal, laser scanning
1. INTRODUCTION Optical 3D scanning is a state-of-the-art technique to capture three-dimensional surfaces in order to apply metrological evaluations or for the digital reconstruction of real world objects by polygonal meshing. Along with the increasing distribution of 3D scanners the applications become wider. Measuring industrial items for quality inspection, scanning large statues for cultural heritage documentation and capturing factories in order to update the digital plant layout are typical applications we are focusing. Depending on the objects size, resolution and data density very large data sets with many millions of points are produced. The application of optical 3D metrology in online inspection systems as well as the processing of large data sets requires automatisms for data pre-processing such as filtering, segmentation or outlier detection. Especially the automatic segmentation of large point clouds is discussed here. A set of data points is subdivided by our algorithm which enables us to perform a piecewise data analysis on the resulting parts. This includes checking the point clouds connectivity, consistency, i.e. sufficient density, and the detection of artefacts resulting from reflections or shadowing effects (see processing steps in Figure 1). We consider the following major tasks: building an appropriate data structure for n-dimensional point data sets, performing efficient range queries, analyzing local neighborhoods, identifying and evaluating subsets with regards to different applications. Finally, we discuss highly efficient nearest neighbor query strategies at the example of point cloud models from a variety of measuring applications.
Figure 1 Shaded point cloud of a medal, highlighted outliers and adjusted point cloud (from left to right). A detailed view of the outlier removal effect is shown in the rightmost picture. The point cloud has 1.4 million points and was acquired with a light-section scanner mounted on a measuring arm.
*
[email protected]; phone +49 391 4090-239; fax +49 391 4090-93239; http://www.iff.fraunhofer.de
2. RELATED WORK Along with the increasing number of devices and 3D scan applications the variety of point cloud algorithms becomes wider, too. This also applies for approaches that aim to separate 3D point clouds into various objects/structures of interest. Typically the term segmentation refers to the separation of a point set into “meaningful” regions. The criteria if a point belongs to a region or desired object depend on the application. Existing segmentation approaches can be subdivided into three main classes: analyzing point connectivity, using color information (from images) and evaluating local surface orientation to separate objects. 2.1 Segmentation methods In order to analyze the connection between points several techniques have been developed. Most of them reconstruct graphs and comparable nearest neighbor structures. For example, Sedlacek et al. discuss an interactive unstructured point cloud segmentation process as graph cut problem. They determine the minimal cut at a weighted graph containing all points of the point cloud where the cost function is derived from the Euclidean distance between them [4]. For a given object location Golovinsky et al. propose an approach to separate the object as foreground from the background [2]. In addition, Yuan et al. propose a hybrid approach to interactively manipulate with point clouds into a desired view position [10]. The point cloud is rendered into an image, where the graph cut algorithm is applied. Finally the image segmentation is projected back to 3D. A comparable approach is presented by Brostow et al. They derive point clouds out of video sequences by applying a structure from motion approach. The resulting 3d data (cues) are projected back to image where are semantic segmentation is performed [5]. Zhan et al. use a colorimetrical measure to support the computation of spatial proximity of point sets [3]. In many cases the considered regions can be described by geometric primitives (planes, spheres, etc.) or parametric surfaces. The best-fit of those functions in order to detect and separate geometries is discussed by Ahn et al. in [11]. Furthermore, Doringer et al. introduce a segmentation method for building modeling that applies local regression planes (i.e. their orientation) to detect roofs, walls and similar planar objects [1]. In order to estimate the local surface normals a plane is fitted to neighboring points. For example, Castillo et al. employ the principal component analysis (PCA) as an effective and popular method for estimating surface normal vectors from point cloud data. Ahn et al. introduce a nonlinear least squares approach with the opportunity to define separate (quality) weights for point co-ordinates [6] and Mitra et al introduce an adaptive procedure to computed the optimal neighborhood for plane approximation in [9]. 2.2 Detecting nearest neighbors Our approaches also evaluate the local proximity in order to find connected subsets. But our focus is on automatisms, memory efficiency and high processing speeds for large point clouds with many millions of 3d points. In order to determine nearest neighbors an appropriate search data structure is required. Obviously, only search trees provide an appropriate high performance. We decided to use a minimal variant of a kd-tree which we will explain in more detail in section three. In general, a kd-tree is a multidimensional search tree in k dimensions (special case of binary space partitioning). Kdtrees use splitting planes perpendicular to the coordinate system axes (hyperplanes). Thus, a point set is subdivided into axis-aligned non-intersecting cuboidal regions. Because the three-dimensional kd-tree for n points is a binary tree with n leafs, it uses O(n) storage and has a construction time of O(n log n). The query time is bounded by O(n1−1/k + pr), where pr is the number of reported points. We use the algorithm presented by Press at al. in [8] to compute the median value as the k-largest element in O(n). But it is possible to perform even faster by utilizing range trees, which contain kd-trees as substructures. Such a range tree uses O(n log2 n) storage and it can be constructed in O(n log2 n + pr) time. Points that lie in the rectangular query range, are reported in O(log3 n + pr) time. In practice, the implementation of a three-dimensional range tree requires much more memory, bookkeeping and internal operations, which reduces performance benefits. Therefore, the best compromise was found by the kd-tree. Due to the efficiency with regard to memory consumption, computation time and flexibility it is used as basic data structure for the following algorithms. Depending on the application it is necessary to choose between fixed nearest neighbors or K-nearest neighbors (the radius increases as long as the number of neighbors is smaller than K). For a general approach the second is the optimal strategy since it is adaptive to the point density.
3. METHODOLOGY This section discusses the basic structure of our search tree implementation. We describe our strategies to extract connected subsets by using a highly optimized region growing approach, and we give hints for the parallelization of our algorithms. Many researchers assume data sets from 3D scanners as unstructured, which is not correct in general. Since each single measured point is the result of a specific measuring principle there is defined scheme for the data generation. For example, light-section approaches (e.g. laser line or fringe projection) produce sets of spatial but planar curves (scanlines). Run-length methods (e.g. laser scanners) use rotating mirrors to produce point sets in a defined way depending on projection angles. The underlying structure can be extracted from the scanner and/or measuring principle and employed for an optimized data processing. Thus we require the search tree and query algorithms to not change the input point cloud structure. 3.1 Search tree We employ a minimal variant of a kd-tree that only stores references to the point data in its leafs, which has multiple advantages. The first is that the original data is not changed, which is vital if the point cloud has a certain structure that must be preserved for other operations than search queries. Furthermore, this strategy is memory efficient and all internal tree operations (e.g. swaps) do not require to copy large blocks of bytes, especially if additional data is stored together with each point (e.g. surface normals or color values). For search operations we need to traverse the tree in one direction only, from top (root node) to the leafs at the bottom. So we do not store additional references to parent nodes. We further increase the computation speed by defining a 1-Bit marker that signals if a node or leaf has already been processed and that can be omitted in following queries. Every search query becomes (exponentially) faster the more queries have already been performed. If both childs/leafs have been marked their parent is marked to. This is done during the search query so we don't need (backward) references to the parents. Putting all together our tree contains only two data types with the following structures: • •
N nodes with four values: a key value (which is a reference to an ordinate of 3d point), a reference to the left and right child and a 1-Bit marker, N leafs storing a reference to the point data and a 1-Bit marker.
3.2 Extracting subsets We propose an optimize region growing approach to identify sets of neighboring points that belong to the same region (spatial proximity). The algorithm works as follows: Starting from an arbitrary point all points within a predefined (Euclidean) distance are queried and stored in a queue. In successive steps this operation is repeated for all points in the queue, and new points may be added. This process stops if no further points have been added and the queue is empty. Each point (i.e. leaf) added is marked as already visited and the searchable range of the tree is successively limited. Thus, the speed for every new query increases steadily (exponentially at the end). After having extracted one region the entire procedure repeats until all points (i.e. leafs) have been visited and marked. As a result we obtain indices that contain the number of the region for each point.
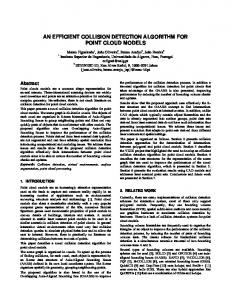
Figure 2. Point clouds derived from a laser light-section scanner. The segmented subsets from reflection artefacts, partly scanned mountings and neighboring objects are shown in different colors. From left to right: catalytic converter, golf ball, gear mechanism and can.
Unlike neighborhood graphs (e.g. minimum spanning trees) we do not search the nearest neighbor but all the neighbors in a certain circumsphere. But the main advantage is that we do not store a graph structure but just a list of indices that indicate the region a point belongs to. 3.3 Parallelization To achieve high processing speeds the capabilities of modern CPUs should be utilized. Most of the tree operations are scheduled in parallel. Since the kd-tree is a binary structure, its construction can be distributed on at least two processes starting after the first subdivision. The use of more threads than available CPUs (cores) is not recommended because the construction of a thread is expensive, especially when the tree depth, and thus, the number of subdivisions is high. Search queries can also be done simultaneously. For each new region the queries for neighboring points are computed in different processes. As long as the queue contains at least two points search operations are distributed. This is possible because the search radius is fixed and the extracted point set regions are disjoint. The performance for the tree construction and the subset extraction using different point cloud sizes is shown in Table 1. Table 1. Computation time for point clouds with different sizes (Intel Core2 Duo 2.5GHz, 4GB RAM, 32Bit WinXP).
Point number Kd-tree construction Subset extraction 24.2M
10.4sec
53.2sec
20.5M
8.9sec.
41.7sec
12.7M
5.7sec
21.5sec
11.4M
4.7sec.
22.5sec
6.2M
2.6sec.
10.5sec
1.5M
0.5sec.
2.9sec
700K
0.3sec
1.7sec
150K
0.07sec
0.3sec
4. APPLICATIONS Point clouds acquired from real world objects with the use of the 3D scanners are affected by many unwanted artefacts. The properties of the environmental conditions have a significant impact on the data quality [7]. Sunlight and shiny surfaces cause reflections which results in point measures not belonging to the surface observed. Rough surface and dark colored objects cause defects, and shadowing effects produce holes. This section deals with the application of our point clustering technique in order to detect such artefacts, like outliers and inconsistently captured surface parts. We also introduce a methodology to determine the required algorithmic parameters adaptively. 4.1 Outlier removal Multiples reflections on shiny surfaces such as polished metal or window glasses cause outlying points. These points affect the visual appearance on the one hand and distort geometric measures on the other. An important pre-processing step is to detect and remove such outliers. We define an outlier as single point or a connected set with only a few points that have a certain distance r to other points and objects. This distance value is chosen adaptively depending on prior known information about the 3D scanner properties and the measuring principle, respectively. Such information is the data resolution and the given uncertainty of the device as well as the distance between the scanner and each measured point. We assume that a point is an outlier if its distance to his neighbors is larger than the uncertainty σ and larger than the resolution ρ. So, we define:
r >σ + ρ
(1)
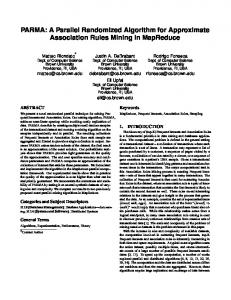
(a) (b) (c) (d) Figure 3. Point cloud of a pipework system (a) with 17.5 million points (from a laser range scanner). The point set has been clustered into 217.905 subsets (b). 217.852 sets contained < 1000 points (c) and have been removed (d).
Unfortunately, both parameters depend on the range between a point and the scanner. Due to the fact that laser scanners generate 3D measures by rotation the head nearby objects have a higher resolution than objects far away (see Figure 4). So we have to make our resolution value adaptive to this range:
ρ = tan(α / 2) ⋅ d
(2)
As an example , Figure 3 shows the laser scan of a pipework system with 17 million colored 3D points. The uncertainty of the scanner varies between 1mm and 2mm within a range of 20m. The angular sampling step size was 0.01 degrees. Accordingly, the resolution varies between 1mm and 3.5mm at distances from 5m to 20m. Consequently, our neighborhood distance value r varies between 2mm and 5.5mm. In many cases it is a good choice to add a constant value to r (about 10%) in order to achieve a higher reliability. We applied our point cloud clustering to this pipework data using the adaptive neighborhood r. The number of the resulting regions was about 218.000. Most of them contained less than 10 points and some of them less more than 100.000 points. We defined a threshold of 1000 points and removed all the small regions. That entire operation took about 37 seconds. Another strategy is to keep objects, e.g. assuming that only the largest (or the n-largest) regions belong to the desired object the remaining are removed. 4.2 Evaluating the point set consistency Another very important source of information is the local point distribution. Especially on strong edges and bumpy surfaces laser data cannot be acquired reliably and shadowing effects cause defects. The check of the point sets consistency is another application of our point clustering approach. Figure 4 shows two point clouds taken with a stationary light-section scanner. Due to the rough surface and the varying density some parts of the surface were missed by the scanner. By parameterizing the algorithm with the expected point density the number of the resulting regions is evaluated. In the optimal case there is only one single region with a global proximity of the desired density. The consistency check is a manual process where the regions are visualized in different colors. They enable us to identify those positions and regions where data is missing and the scanning processing should be repeated.
Figure 4. Point clouds of a plaster bust (100K pts) and a tile (2.1M pts). The consistency, i.e. point density, varies for both models resulting in subsets with no connection to the main model.
5. CONCLUSIONS We proposed an extremely fast point cloud clustering technique which is suitable for outlier detection, object segmentation and region labeling for large multi-dimensional data sets. The basic data structure is a binary tree similar to a kd-tree which enables us to detect connected subsets very fast. The procedures presented are a vital part of the data preprocessing at the beginning of a typical point cloud processing pipeline. They improve the input data properties by removing artefacts and detecting inconsistencies. Furthermore they enable a more reliable computation of surface measures, polygonal meshes and other visualization technique. For example, a point set with two million coordinates is analyzed within three seconds and 15 million points within 35 seconds on Intel Core2 processor. It handles arbitrary ndimensional data formats, e.g. with additional color and/or normal vector information since it is implemented as a template class. The algorithm is easy to parallelize which further increases the computation performance on multi-core machines for most applications. The feasibility of our clustering technique has been evaluated at the example of a variety of point clouds from different measuring applications and 3D scanning devices.
REFERENCES [1] Dorninger P and Nothegger C., 3D segmentation of unstructured point clouds for building modeling, Photogrammetric Image Analysis PIA07, 35, 191—196 (2007). [2] Golovinskiy A. and Funkhouser T,. Min-Cut Based Segmentation of Point Clouds. IEEE Workshop on Search in 3D and Video (S3DV), 39-46 (2009). [3] Zhan, Q; Liang, Y; Xiao, Y., Color-based segmentation of point clouds. Laserscanning09, Volume XXXVIII, 248-252 (2009). [4] Sedlacek D. and Zara J., Graph Cut Based Point-Cloud Segmentation for Polygonal Reconstruction, Proc. 5th International Symposium on Advances in Visual Computing: Part II (ISVC '09), 218--227, 2009 [5] Brostow G. J., J., Julien Fauqueur, Roberto Cipolla, Segmentation and Recognition Using Structure from Motion Point Clouds, Proc. 10th European Conference on Computer Vision: Part I,(ECCV '08), 44--57, (2008). [6] Castillo E. and Zhao H., Point Cloud Segmentation via Constrained Nonlinear Least Squares Surface Normal Estimates. Technical Report CAM09-104, Computational and Applied Mathematics Department, University of California Los Angeles, (2009). [7] Trostmann E., Teutsch C. and Berndt D., Adaptive pre-processing of large point clouds from optical 3D scanners. In Proc. IADIS Int. Conf. Applied Computing 43–52 (2010). [8] Press W. H., Teukolsky S. A., Vetterling W. T., and Flannery B. P., Numerical Recipes in C++: The Art of Scientific Computing. Cambridge University Press, 3rd edition (2007). [9] Mitra N. J., Nguyen A., and Guibas L., Estimating surface normals in noisy point cloud data. Special issue of Int. J. Computational Geometry and its Applications, 14(4–5):261–276, (2004). [10] Yuan X., Xu H., Nguyen M.X., Shesh A., Chen B., Sketch-based segmentation of scanned outdoor environment models., Proc. eurographics workshop on sketch-based interfaces and modeling (SBIM ’05), 19—27, 2005. [11] Ahn, S.J., Rauh, W., Warnecke, H.J., Least-squares orthogonal distances fitting of circle, sphere, ellipse, hyperbola, and parabola. Pattern Recog. 34, 2283–2303, (2001).