used to simulate a bluff-body-stabilized methane-air diffusion flame in a ...... 0.5. Table 1: Table showing the various cases considered for the current study. 12 ...
A PDF APPROACH TO MODELING TURBULENCE-RADIATION INTERACTIONS IN NONLUMINOUS FLAMES Sandip Mazumder and Michael F. Modest Department of Mechanical Engineering, The Pennsylvania State University, University Park, PA 16802.
Abstract The interactions between turbulence and radiation, although acknowledged and qualitatively understood over the last several decades, are extremely difficult to model. Traditional Eulerian turbulence models are incapable of addressing the ‘closure problem’ for any realistic reactive flow situation, on account of the large number of unknown turbulent moments. A novel approach, based on the velocity-composition joint probability density function (PDF) method, has been presented. This approach is Lagrangian in nature and provides a very elegant and feasible alternative for turbulence closure. On account of its Lagrangian nature, the need to model correlations arising from the nonlinear convective terms in classical Eulerian approaches is eliminated. Furthermore, the reaction source terms are treated exactly (i.e., without any turbulence model). In general, all physical processes, whose description require only one-point statistics, are treated exactly because the velocity-composition joint PDF contains information about the velocity and composition fields at all time and space. Owing to this strength of the PDF method, it is possible to treat turbulence-radiation interactions (TRI) by this approach. A mixed Monte Carlo / finite-volume technique has been used to simulate a bluff-body-stabilized methane-air diffusion flame in a recirculating combustor, and enables treatment of turbulence in recirculating flows, finite-rate chemistry, and multiple-band radiation calculations within the CPU limitations of a standard single-processor workstation. The finite-volume side of the code has been used to determine the mean pressure and the integrated incident radiative intensity, while the Lagrangian Monte-Carlo particle-tracing scheme has been used to obtain all velocity and scalar fields. Results presented show the dynamic quasiperiodic behavior of the flame — a well-known, experimentally observed phenomenon in bluff-body-stabilized flames. They also demonstrate the role of radiation and turbulence-radiation interactions in altering the overall flame structure, the wall heat loads, and the overall heat emission by the flame at various Reynolds numbers and equivalence ratios.
Nomenclature
a, A, b bij B cp� cpmix C�
constants in Arrhenius relationship [equation (13)] normalized anisotropy tensor width of bluff body (Fig. 1) specific heat of �-th species at constant pressure mixture specific heat at constant pressure contant in Dopazo’s model, = 2 1
D
Da
Ea Gij G� h� �h h0f� Hijkl I� Ib� k M� Mmix N Nb Nc p qC qR Ru Re
s s^ Schem S� t T T0 Ui Ua�in Uf�in Wi xi Y�
width of fuel injector (Fig. 1) Damk¨ohler number, = � = �R activation energy of fuel tensor in Langevin model spectral incident radiation total enthalpy of �-th species sensible enthalpy enthalpy of formation of the �-th species at the standard state tensor in Langevin model spectral radiative intensity Planck function turbulent kinetic energy molecular weight of �-th species mixture molecular weight total number of scalars total number of molecular gas bands total number of particles in a given cell pressure convective heat flux vector radiative heat flux vector universal gas constant Reynolds number position unit vector along a line of sight source term in energy transport equation due to chemical reaction source due to chemical reaction and radiation in �-th scalar transport equation time temperature standard state temperature velocity in the i-th direction inlet axial velocity of air stream inlet axial velocity of fuel stream isotropic Wiener process space variable in i-th direction mass-fraction of �-th species
Greek
�1 � �2 �1� �2� �3 �ij w
;� 1 to 6 , ?
�
constants in Langevin model constants in Langevin model Kronecker delta rate of dissipation of k emissivity of wall wave number generic kinematic diffusivity of �-th scalar constants in Langevin model spectral absorption coefficient 2
i � �� � �in � �a�in � �R
equivalent box height of i-th absorption band kinematic viscosity �-th scalar set consisting of all scalars inlet equivalence ratio mixture density inlet density of air stream turbulent time-scale reaction time-scale
Subscripts
w
at wall at wavenumber
Superscripts
? 0
of particle (or Lagrangian) turbulent fluctuation around ensemble average
Special Symbols h i ensemble average [] molar concentration
1
Introduction
Turbulent flames are characterized by large fluctuations in temperature and concentrations. The fluctuations often range between 40–65% of the mean [1, 2]. The spectral radiative absorption coefficient of a mixture of gases is a function of the temperature and concentration of the gas mixture and, therefore, is characterized by large fluctuations, as well. These fluctuations interact with fluctuations in the Planck function (a function of temperature) and the radiative intensity. These interactions are typically referred to as ‘Turbulence-Radiation Interactions’ (TRI). The interaction between radiation and turbulence is now a well-acknowledged phenomenon. Over the last two decades or so, substantial amount of research effort has been directed toward this area. In the seventies and eighties, it has been shown by analysis [3{10] that an interaction between turbulence and radiation does exist. The answer to the question as to how these interactions affect radiative heat fluxes and divergence of radiative heat fluxes is still a matter of conjecture and argument. The earliest numerical calculations were undertaken by Germano [7]. His calculations were based on the assumption that the scalar fluctuations are random and the medium is gray. Although far from the truth, the calculations based on these assumptions did prove that TRI exists. Pearce and Varma performed similar calculations for the 4.3 �m CO2 band. In their approach, the optical paths were broken up into a number of statistically independent homogeneous segments. The two-point statistical correlations were then described by assuming exponential correlation functions. This approach was later adopted by Chan and Chern [11] and by Faeth and coworkers [12{15]. In these numerical investigations, the hydrodynamic and scalar fields were obtained by a mixturefraction formulation and the k - -g model. Kounalakis et al. [13] have used experimentally measured 3
radiative intensities in conjunction with a stochastic time-series method and concluded that TRI enhances heat transfer rates in turbulent nonluminous diffusion flames by a factor of 1.1 to 4.2. This, however, appears to be in contrast with their earlier work [15], where the effect of TRI was deemed insignificant. In recent years, Song and Viskanta [10] and Soufiani et al. [9] have also performed calculations that show that TRI can enhance heat loads on combustor walls. The disparity between the time scales of reaction and turbulent mixing in a reactive turbulent flow poses severe problems in modeling turbulent combustion, and is best described in terms of the nondimensional Damk¨ohler number, Da, which is defined as Da = � = �R , where � is the time scale for the dissipation of the turbulent kinetic energy (or typically referred to as the ‘turbulent time scale’) and �R is the reaction time scale. In a typical hydrocarbon reaction with multistep chemistry, the time scale of the component reactions may vary from one-hundredth of a second to a few microseconds, depending on the fuel, the oxidizer, and the complexity of the chemistry model. The turbulent time scale is typically in the order of one-tenth of a second. Thus, the Damk¨ohler number, typically, has a very broad spectrum in a reacting flow situation. It is important to note here that Da is actually a result that evolves out of solving a reactive flow problem, rather than being a parameter, because neither � nor �R are known a priori. From a physical standpoint, this implies that Da cannot be controlled experimentally with any degree of certainty. It can only be qualitatively controlled by varying the inlet turbulent fluctuations, so that the turbulent time scale changes. However, since the fluid-mechanical problem is intimately coupled to the chemical rate equations through the density and pressure, it is impossible to quantify the exact change in the Damk¨ohler number in an experimental situation. The treatment of the broad range of Da is possible only by the use of finite-rate chemical kinetic models, and has remained a challenge in the context of classical turbulent combustion models. In pressure-based algorithms iteration is performed over the coupled set of steady-state transport equations. This implies that to evaluate the mean rate of production/destruction of energy or species, one has to assume that the reaction takes place instantaneously, in which case chemical reactions are not affected by the turbulent structures. This is referred to as ‘flamelet combustion,’ in which combustion occurs in thin sheets which, locally, have the properties of laminar flames. Flamelet combustion typically occurs for Re � 1 and Re1=2 � Da � Re [16], in which case the entire composition field can be described by instantaneous realizations of the mixture-fraction and its fluctuations. A wide range of models, such as the k - -g model [17], the ‘mixed-is-burnt’ model [18], etc., employ the assumption of combustion in the flamelet regime (large Da). This is the approach that has been adopted in all of the research cited above. A second class of models assume that reaction is as slow as the turbulent mixing process, which implies that the problem is entirely governed by fluid mechanical processes. In such cases, known as ‘distributed combustion,’ the Damk¨ohler number is small. Spalding’s eddy-breakup model [19, 20] employs such an assumption. The vast majority of real-life combustion applications has a spectrum of Da far removed from the above two categories. In real-life combustion applications, a wide variety of species are produced, and it is desirable to treat the concentrations of these species as primitive variables. Secondly, to relax the assumption of a particular regime of combustion, it is necessary to incorporate finite-rate chemistry to allow proper description and understanding of the coupling between turbulent fluid flow and chemical reactions. In most combustion models (except the BML model), turbulent transport of scalars is treated by a gradient diffusion model, which has been proven to be unreliable for variable-density flows [21]. Above all, numerical schemes for reactive turbulent flows based on traditional Eulerian closure schemes, involving a large set of species and a number of gas bands for radiation calculations, soon become computationally intractable and often surpass the capability of modern-day computers. 4
The evaluation of the unknown terms arising out of turbulence-radiation interactions poses considerable difficulties in Eulerian closure schemes. It essentially reduces to the evaluation of the correlations hT 2i and hY� T i, for � = 1� 2� 3� : : :� N ; 1, where N ; 1 is the total number of species with mass-fractions Y� . This can be shown by performing a Taylor series expansion of the spectral absorption coefficient and the Planck function about their mean values, and then averaging the resultant product after linearization. The correlations hT 2 i and hY� T i can be obtained by deriving transport equations for these quantities and then modeling the right-hand-side of the resulting transport equations although such modeling is extremely cumbersome. Even if the transport equations were available in modeled form, one would still have to solve a whole set of additional nonlinear partial differential equations. With any realistic chemistry, the problem soon becomes numerically intractable. It can be shown further that the evaluation of hY� T i by the traditional transport-equation approach requires the evaluation of the correlations hY� Y� i for all values of � and � . For details, the reader is referred to Mazumder [22]. This article presents a novel approach to accounting for TRI in confined turbulent flames. The approach presented here accounts for all aspects of a general turbulent reactive flow, namely, turbulent fluid flow, multiple species, finite-rate kinetics, multiple gas-band radiative calculations and the treatment of interactions between turbulence and radiation, and is the first of its kind in the sense that it treats all of the above important phenomena simultaneously without any ad hoc assumptions. It is an approach which is broad in its capabilities and is applicable to both premixed and diffusion flame computations. As opposed to Eulerian approaches and traditional combustion models, stochastic approaches, such as the velocity-composition joint probability density function (PDF) method [23, 24] can overcome most of the above problems with relative ease. Most importantly, as will be demonstrated later in this article, complicated problems can be solved within the CPU limitations of standard workstations by using stochastic approaches. As a first step in the velocity-composition joint PDF approach, a joint PDF transport equation is derived by combining all conservation equations. The fluid within the whole computational domain is then discretized into representative samples (or ‘particles’). These particles move within the domain with time following certain governing equations, which essentially are the Lagrangian equations of motion. The particles carry with them all passive scalars as well, whose magnitudes are determined by solving the Lagrangian scalar transport equations of the particles. The Eulerian mean quantities are obtained by sampling these particles in spatial bins, and then averaging. Since the approach is Lagrangian, convective transport is treated without any approximation or modeling and, therefore, the question of modeling the turbulent flux terms arising from averaging the nonlinear advective terms in traditional schemes does not arise. Also, this eliminates the critical problem of numerical diffusion associated with traditional finite-volume schemes. In such approaches, modeling is required only for closure of the fluctuating pressure-strain-rate terms, as well as the dissipation terms, and is performed using stochastic processes. A comprehensive discussion of the velocity-composition joint PDF method and its underlying theory may be found in Ref. 24 and the references cited therein. 0
0
0
0
5
0
0
0
0
0
0
2
Mathematical Description
2.1 Turbulence-Radiation Interactions (TRI) The radiative transfer equation (RTE) for a nonscattering medium [25] is:
@I� @s
= � (Ib�
;
I�) �
(1)
where I� is the spectral radiative intensity, � is the spectral absorption coefficient, and Ib� is the Planck function. The time-constant for radiative transport in an enclosure of characteristic dimension of a meter is in the order of few tens of nanoseconds. This is considerably faster than the fastest chemical reactions, whose time-constants are typically in the order of microseconds and, therefore, the transient term in the radiative transfer equation has been neglected. The spectral absorption coefficient, Planck function, and spectral intensity are decomposed into a mean and a fluctuating part:
�
=
�
h
i
+ � � I� = 0
I�
h
+ I� and� Ib� = 0
i
Ib�
h
+ Ib� � 0
i
(2)
where the quantities within angled brackets denote ensemble averages and the quantities with primes denote fluctuations. Substitution of equation (2) into equation (1), followed by averaging yields
@ I� @s h
i
=
� Ib�
h
ih
� I�
i ; h
ih
i
+
� Ib�
h
0
0
� I� :
i ; h
0
0
(3)
i
The last two terms in equation (3) are additional terms that arise due to the interaction of radiation with turbulence. For closure, these terms need to be evaluated. Researchers in the field of radiation-turbulence interaction have assumed that the correlation between the fluctuating absorption coefficient, � , and the fluctuating radiative intensity, I� , is negligible. Kabashnikov [4] has established a criterion, which states that this assumption is correct if the optical thickness of the radiating gas, based on the macroscale of turbulence, l, is small, i.e., h � i l � 1. This approximation is referred to as the ‘optically thin fluctuation approximation’ (OTFA). Kabashnikov and Myasnikova [3], and later Song and Viskanta [10], have provided physical arguments, which support this approximation. The idea has more recently been augmented by Hall and Vranos [8]. Thus, the only term that needs to be evaluated to attain closure is h � Ib� i. This is true in the vast majority of flames. 0
0
0
0
2.2 Lagrangian Transport Equations Hydrodynamic Transport The motion of individual particles is governed by the following set of ordinary differential equations given by Pope and coworkers [24, 26]:
�Ui?
=
;
+
1 @ hpi �? @xi �t + 2 �
Gij (Uj?
; h
@ 2 Ui �t + 2 � �W @ Ui j @xj @xqj @xj Uj ) �t + C0 �Wi � h
i
p
0
i
and 6
h
i
p
�x?i
Ui? �t + 2 � �Wi i = 1� 2� 3 � (4) where Ui? is the particle velocity, and x?i is the particle position. Quantities within angled brackets =
represent Eulerian averages, which, in the current context of reactive flows, are Favre averages. The first term in equation (4) represents transport by the mean pressure gradient; the second and third terms describe molecular transport, and are usually negligible at large Reynolds numbers except in the vicinity of solid walls. The last two terms, in conjunction, provide a stochastic representation of transport by the fluctuating pressure gradient and viscous dissipation of the turbulent fluctuations, and have been structured after the Generalized Langevin Model (GLM) [26]. The function �Wi(t) is the change in an isotropic Wiener process. The Wiener process is a nondifferentiable function which, when integrated over time, results in a random number drawn from a standardized Gaussian distribution whose mean is zero and whose variance is equal to the time interval over which the function has been integrated. The tensor, Gij , for a general inhomogeneous turbulent flow, assumes the following form [26]:
Gij
�1 �ij
+
�
�2 bij
�1
=
;
1 3 + C0 2 4
!
;
+
Hijkl @@xUk � h
i
(5) l where � is the time-scale for the dissipation of turbulent kinetic energy (often referred to as simply the ‘turbulent time-scale’), and �2 = 3:78. The quantity �1 is given by [26]
�
=
�2 bij bji
;
� ? bki bil @@xUk � h
i
l
where bij is the normalized anisotropy tensor, and is expressed as
(6)
1 1 hui uj i ; �ij � (7) 2 k 3 where ui are the fluctuations in velocity, and k is the turbulent kinetic energy. The constants in equation (6) are as follows: C0 = 2:1, 1 = ;1:24, 2 = 1:04, 3 = ;0:34, 4 = 0, 5 = 1:99, 6 = ;0:76, �1 = ;0:2, �2 = 0:8, �3 = ;0:2, and ? = + + + = 1:93 : (8) 0
bij
0
=
0
2
3
5
6
Finally, the fourth-order tensor, Hijkl , in equation (5) is given by
Hijkl
= + +
where �ij is the Kronecker delta.
�1 �ij �kl + �2 �ik �jl + �3 �il �jk 1 �ij bkl + 2 �ik bjl + 3 �il bjk 4 bij �kl + 5 bik �jl + 6 bil �jk �
(9)
Scalar Transport The Lagrangian transport of any passive scalar is governed by the following set of ordinary differential equations [22, 24, 27, 28]:
��?�
@ 2 �� �t + 2 � �W @ �� j @xj @xj @xj C� (�? � ) �t + S (�?) � � 2� �
= (;� + � ) ;
h
; h
p
i
h
i
7
i
� = 1� 2� : : : � N �
(10)
where �?� is the �th scalar of an individual particle (� = 1� 2� : : :� N ; 1 for the mass-fractions of N ; 1 species, and � = N for temperature), and ;� is the molecular diffusivity of the �-th scalar. The first two terms in equation (10) represent molecular transport. The third term describes dissipation of the scalar fluctuations (turbulent mixing), and is attributed to Dopazo [27]. The constant, C� , assumes a value close to 2, and a discussion to this effect may be found in Mazumder and Modest [28], and the references cited therein. The last term in equation (10) is the source due to chemical reaction and radiation, and is written as:
S�
=
8 Z dY ? > � > < t dt dt Z > > : S ? dt ;
�
= 1� 2� : : :� N
(r � qR ) �t
;
1
�
(11)
�=N t chem The determination of dY�? =dt and Schem will be discussed later. The above set of equations, in conjunction with the equation of state, completely describes the path and composition of a particle at any given time starting from an initial state. If the low Mach number assumption is invoked, the effects of pressure are decoupled, and the equations are coupled to each other through the density only. It is also reasonable to assume that the reference pressure does not change with time, which is true for most combustion applications except internal combustion engines. We will restrict ourselves to the case where the reference pressure does not change as a function of time, although the procedure is also applicable to truly compressible flows (except that, in such a case, the solution for the pressure field gets considerably more complicated). As a particle travels, it may approach a solid wall. In the vicinity of a solid wall, viscous effects come into play, and equations (4)-(10) need to be modified. These modifications have been outlined in detail by Mazumder and Modest [28, 29]. The detailed solution algorithm may be found in Mazumder [22]. Chemical Reaction Methane is the most important constituent of natural gases and, therefore, has been chosen as the fuel in the current study. Methane produces soot only under excessively rich conditions and is, thus, an ideal fuel for studies of nonluminous flames. A wide range of chemical kinetic models for methane are available in the literature. In this study, the simplest form, i.e., a single-step Arrhenius rate will be adopted. The single-step reaction of oxidation of methane may be written as: CH4 + 2 O2
!
CO2 + 2 H2 O :
(12)
Westbrook and Dryer [30] provide an Arrhenius relationship for the reaction-rate of methane as:
d[CH4 ] dt
=
;
A exp( Ea = Ru T ) [CH4 ]a [O2]b � ;
(13)
where the quantities within square brackets represent molar concentrations; Ru is the universal gas constant, and Ea is the activation energy of methane. A, a and b are unknown constants in the general Arrhenius equation, which are determined by matching experimental flame-speeds and flammability limits of the fuel. The match, in certain cases, is also provided by data obtained from a detailed chemical kinetic model. The constants in equation (13) are given by [30]: a = ;0:3, b = 1:3, A = 8:3 � 105 s 1 , and Ea = 30 kcal/mol. The rate of destruction of oxygen and the ;
8
rate of production of carbon dioxide and water vapor can be easily expressed in terms of the rate of destruction of methane by using the stoichiometry in equation (12). Since the constant a is negative for methane, it suggests that the rate of reaction will increase indefinitely as methane is depleted. This is liable to cause serious numerical problems when equation (13) is used. One way to avoid this problem is to set the reaction rate to zero below a certain methane concentration, corresponding to the lower flammability limit of the fuel. Indeed, experimental observations [30] show that the reaction rate of methane is almost zero below a certain cut-off concentration, and very high at concentrations slightly above this cut-off value. Westbrook and Dryer [30] also suggest alternative values for the constants in equation (13), with which the above numerical problem can be alleviated. However, these alternative values do not guarantee the correct pressure dependence of the reaction rate equation. In the current work, the first corrective measure was taken. The flammability limits were obtained from the same reference. The molar concentrations of the species are related to their mass-fractions by the relationship [�] =
Y� MMmix Rp0T � �
(14)
u
where M� is the molecular weight of the �-th species and Substitution of equation (14) into equation (13) yields
Mmix is the mixture molecular weight.
�
d � YCH = A exp � Ea � YCH a MCH YO dt T Ru T T MO T 4
4
;
;
4
2
!b =
RCH � 4
(15)
2
where RCH4 has been introduced as a shorthand for the right-hand-side of equation (15). The mixture molecular weight changes marginally with time and may be treated as constants. Using this assumption, equation (15) may be rewritten as:
"
dYCH dt
4
;
YCH dT T dt
#
4
=
T RCH � 4
(16)
The rate of production/destruction of heat due to chemical reactions requires special consideration. In the context of the current particle tracing scheme, the Arrhenius relationships are applied to individual particles. The contributions by reaction, dissipation, molecular transport and radiation are treated sequentially within a single time-step. The chemical energy in an individual particle is first transformed to sensible energy, which is then allowed to change by heat transfer from the particle by various mechanisms. The heat released by reaction in a single particle can be computed by treating the particle as an adiabatic control mass and a perfectly stirred reactor model [24]. Under this assumption (and assuming a constant pressure process, which is consistent with the low Mach number assumption discussed earlier), the First Law for an individual particle reduces to
dh dt
=
" # d XY h = 0� dt � � �
(17)
where the superscript ‘? ’ (representative of a particle) has been omitted to keep the notation simple. The enthalpy of the �-th species, by definition, is
h�
ZT
= hf� + T0 0
cp�(T ) dT � 9
(18)
where h0f� is the enthalpy of formation at the standard state, T0 is the temperature at the standard state, and cp� is the specific heat at constant pressure. The second term in equation (18) represents the sensible enthalpy measured against the standard state, and is often denoted by �h�. In order to determine the temperature from the enthalpy, the integral relation in equation (18) must be inverted. This is commonly performed by interpolation. Another common scheme for flame computations is to assume cp� to be a constant, evaluated at an elevated temperature, so that a fairly accurate answer is obtained. For purposes of the current study, the second approach was deemed adequate, and the value of the specific heat at 1500K was used. Equation (18), along with the assumption of constant specific heats, when substituted into equation (17) yields
Schem
NX1 ;
=
;
�=1
� h� dY dt
NX1 ;
=
;
�=1
� hf� dY dt 0
;
(T
;
T0 )
P
NX1 ;
�=1
� cp� dY dt
= cpmix
dT � dt
(19)
where cpmix is the mixture specific heat of a particle (= � Y� cp� ), and N ; 1 is the total number of species. Equations (16) and (19), in conjunction with the rate equations for the other species, form a set of nonlinear, implicitly-coupled ordinary differential equations (ODEs). This explains why the source due to chemical reaction in equation (11) was retained in an integral form. This set is stiff and cannot by solved by standard ODE solvers. In the current context, Gear’s method [31] was used. In the particle-tracing Lagrangian scheme, each particle has its own composition, i.e., its own temperature and species mass-fractions and, therefore, its own density, specific heat and molecular weight. This implies that all one-point statistics of the scalars are preserved by this approach. Since reaction depends only on one-point statistics of the scalars, this approach enables exact treatment of reactions, i.e., no turbulence model is necessary to treat reaction. Clearly, this is one of the strengths of the PDF approach, since in Eulerian approaches an assumption regarding the relative magnitudes of the reaction and turbulent time-scales is required to evaluate the average source term at each cell center. Thermal Radiation Equation (3) is a directional equation, and is difficult to solve in its present form even if the TRI terms are known. One strategy that is often employed is the use of the P1-approximation, which reduces this directional equation to a Helmholtz equation [25] for the integrated (over all directions) incident radiation, G� . The transport equation for the incident radiation [25], after decomposing into mean and fluctuating parts and averaging, may be written as
�
G�
1
3 h � i subject to the boundary condition r �
rh
"
!
i
=
;
4�
� Ib�
h
ih
i
+
� Ib�
h
0
0
i
+
#
n^ � qRw� = ; 3 h1 i n^ � r hG� i = 2 ( w; 2) �4 � Ibw� � w w
� G� �
h
;
ih
Gw� � �
i
(20)
where qR is the net radiative heat flux, n ^ is a unit vector normal to the wall, and w is the emissivity of the wall. All quantities with a subscript ‘w’ imply that they are evaluated at the wall. The correlation between G� and � has been neglected following arguments presented earlier. The internal source 0
0
10
due to radiation, which appears in equation (11) for � = N is equal to the negative of the divergence of the radiative heat flux, and is expressed as [25] ;r �
qR
Z h 1
=
;
0
=
;
4�
Nb � X 4� k=1
;
� Ib�
h
ih
k Ib k
h i
h
i
+
+
h
� Ib�
i
h
0
0
Ib k � 0
0
i
i
i
� G� d
; h
ih
i
k G k� �
; h
i
h
i
(21)
In the current study, the spectral variation of the absorption coefficient of the combustion gases was treated using wide-band models. The wide-band model data used here are a collection of data provided by Edwards [32] and Modak [33]. An excellent summary of all these data may be found in the text by Modest [25]. In the ‘box model’, the gas bands are modeled as rectangular boxes, within which the absorption coefficient is a constant (the box-height). The box-height and width can be determined from wide-band data following the procedure of Modest and Sikka [34]. Prior to solving equation (20) it is necessary to calculate the average absorption coefficient and the TRI terms for each cell and for each band. The band strengths and widths are functions of the temperature and composition field of the gas layer in question. For nonisothermal gas layers, the band widths and strengths are different at different spatial location. In order to solve equation (20), however, the set of band widths need to be the same over the entire computational domain. This is ensured by calculating the band-widths using a single characteristic value for temperature and composition. Although some accuracy is lost this way, it is unavoidable when solving the radiative transfer equation for a nonisothermal reactive gas layer by the simplified box model. In the current particle-tracing scheme, since each particle has its own scalar field, the band strengths are computed for each particle based on the particle’s own temperature and concentrations. Spatial averaging then yields the average band strength (box height) at each cell location. The deviation of the actual particle band strength from the average provides the fluctuating absorption coefficient. The TRI term for a given box, h Ibik , is calculated as 0
Ib k
h
0
0
i
=
Nc 1 X
Nc
n=1
[ ?nk
0
?
k ] [Ib�n�k
; h
i
Ib k ] � k
; h
i
= 1� 2�
: : : � Nb �
(22)
where Nc is the number of particles in the cell in question, and Nb is the total number of bands.
3
Results and Discussion
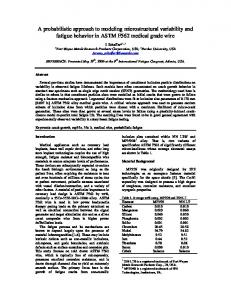
Bluff bodies are often used in practical burners to anchor diffusion flames. In addition, the behavior and characteristics of bluff-body-stabilized flames have been investigated experimentally by a number of researchers in the past. Notable amongst these studies are the ones by Rocquemore et al. [35], Lee and Onuma [36], and Masri and Bilger [37]. The geometry used for the simulations in the current study has been illustrated in Fig. 1. The dimensions shown in the figure were unchanged for all cases. The top and bottom walls, and the bluff-body were maintained isothermal at 700K, and were considered gray, with an emissivity of 0.8. The air and fuel (methane, in this case) were injected at temperatures of 1200K and 1000K, respectively, and the inlets were assumed to be ‘black’ at these temperatures. The exit of the burner was also assumed ‘black’ at the local temperature of the exiting gas.
11
BLUFF−BODY
AIR
x2
D = 16 mm
H = 0.5 m x1
FUEL B / 2 = 92 mm
AIR
L=2m
Figure 1: Geometry of bluff-body burner used for sample calculations
Case# 1 2 3 4 5 6 7 8 9 10 11 12 13 14 15 16 17 18
Re
�in
13,304 1.0 13,304 1.0 13,304 1.0 13,304 1.05 13,304 1.05 13,304 1.05 13,304 0.9 13,304 0.9 13,304 0.9 13,304 0.8 13,304 0.8 13,304 0.8 26,608 1.0 26,608 1.0 26,608 1.0 39,912 1.0 39,912 1.0 39,912 1.0
Radiation ? TRI ? No Yes Yes No Yes Yes No Yes Yes No Yes Yes No Yes Yes No Yes Yes
No No Yes No No Yes No No Yes No No Yes No No Yes No No Yes
Ua�in (m/s) Uf�in (m/s) �t (ms)
h
i
10.00 10.00 10.00 10.00 10.00 10.00 10.00 10.00 10.00 10.00 10.00 10.00 20.00 20.00 20.00 30.00 30.00 30.00
h
i
16.41 16.41 16.41 17.23 17.23 17.23 14.77 14.77 14.77 13.13 13.13 13.13 32.82 32.82 32.82 49.23 49.23 49.23
2.0 2.0 2.0 2.0 2.0 2.0 2.0 2.0 2.0 2.0 2.0 2.0 1.0 1.0 1.0 0.5 0.5 0.5
Table 1: Table showing the various cases considered for the current study
12
The simulations were performed primarily to study the effect of two important parameters: the inlet equivalence ratio, denoted by �in , and the Reynolds number, defined as:
�a�in Ua�in B = � � (23) where �a�in is the mean inlet air density, Ua�in is the mean inlet air speed in the axial direction, and B is the width of the bluff-body (Fig. 1). The dynamic viscosity of the fluid, �, was assumed to Re =
h
i
h
ih
h
i
i
be that of air over the whole computational domain and its value at 1200K was used everywhere. In order to facilitate easier referencing for future discussions, each case has been tabulated in Table 1, providing relevant information pertaining to each case, and has been assigned a number. In Table 1, hUf�in i is the mean inlet fuel velocity. The inlet equivalence ratio can be changed by changing either the inlet flow velocity of the fuel jet, or by changing the inlet injection area of the fuel. Changing the flow speed is probably what an experimentalist would do (instead of using a variety of bluff bodies) to adjust the equivalence ratio and, therefore, the same strategy was adopted here. Each simulation was performed with 100,000 particles and a 20�20 grid. The same grid was used for the finite-volume solution of the radiative transfer equation, as well as sampling in the Monte Carlo scheme. For radiation calculations, ten molecular gas bands, centered around the following wavelengths, were chosen: 1.38 �m, 1.87 �m, 2.7 �m, 6.3 �m, and 71 �m bands for H2 O; 2.7 �m, 4.3 �m and 15 �m bands for CO2 ; and 7.7 �m and 3.3 �m bands for CH4 .
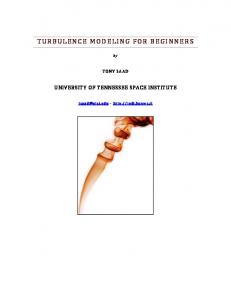
General Flame Structure and Characteristics The recirculation behind the bluff body anchors the flame. The coflowing air jet entrains the fuel jet behind the bluff body, causing intense mixing and combustion. The coaxial flow of two jets with significantly different densities and momenta results in a well-known instability. In this case, the instability is further enhanced by combustion, which results in significant temperature and density gradients. Rocquemore et al. [35] specifically addressed instabilities associated with bluffbody-stabilized diffusion flames. They observed (for a propane-air flame at various flowrates) that downstream of the recirculation zone, the flame is pinched off to form discrete ‘turbules’ of varying size and shape. These turbules are created at a rate that is almost periodic, and move downstream at a speed almost equal to the inlet air speed. Consequently, the problem under consideration does not have a steady-state solution. This experimentally observed behavior has been confirmed by the present simulation. The formation of flame turbules and their downstream march have been illustrated in a series of frames in Fig. 2 by showing temperature contours for Case 1 at various points in time. The first turbule begins to form approximately at 270 ms, and is pinched off completely from the tip of the flame at approximately 350 ms. During this time period, however, the primary flame changes shape from a blunt onion-like shape to a long dumpbell-like shape. The primary flame is observed to form two distinct lobes. This process continues and the length of the flame continues to grow until about 430 ms, at which point the second turbule is shed off. The final frame at 450 ms clearly shows the primary flame along with two turbules, which are almost equally spaced. These observations match closely with what was observed by Rocquemore et al. [35] in their experiments. Another feature of the secondary flamelets (or turbules) is that they become hotter as they march downstream. It is our belief that this phenomenon will be observed only for methane-air flames. The rich flammability limit for methane corresponds to an equivalence ratio of 1.5. This value is considerably smaller than the rich flammability limits of other hydrocarbons, which have values of about 3.5 [38]. When a fuel blob enters the combustor, it is rich, and combustion will not occur until 13
t = 270 ms
2050 1950
0.40
x2
1850 1750
0.30
1650
0.20
1550 1450 1350 1250
0.10
1150 0.5
1.0
1.5
x1
2.0
t = 290 ms
2050 1950
x2
0.40
1850
0.30
1750 1650 1550 1450
0.20
1350 1250
0.10
1150 0.5
1.0
1.5
x1
2.0
t = 310 ms
2050 1950
0.40
x2
1850 1750 1650
0.30
1550 1450 1350
0.20
1250
0.10
1150 0.5
1.0
1.5
x1
2.0
t = 330 ms
2050 1950
0.40
x2
1850 1750
0.30
1650 1550
0.20
1450 1350 1250
0.10
1150 0.5
1.0
1.5
x1
2.0
t = 350 ms
2050 1950
0.40
x2
1850 1750 1650
0.30
1550 1450
0.20
1350 1250
0.10
1150 0.5
1.0
1.5
x1
2.0
Figure 2: Turbule formation (temperature contours shown here) with time
14
t = 370 ms
2050 1950
0.40
x2
1850 1750
0.30
1650
0.20
1550 1450 1350 1250
0.10
1150 0.5
1.0
1.5
x1
2.0
t = 390 ms
2050 1950
x2
0.40
1850
0.30
1750 1650 1550 1450
0.20
1350 1250
0.10
1150 0.5
1.0
1.5
x1
2.0
t = 410 ms
2050 1950
0.40
x2
1850 1750 1650
0.30
1550 1450 1350
0.20
1250
0.10
1150 0.5
1.0
1.5
x1
2.0
t = 430 ms
2050 1950
0.40
x2
1850 1750
0.30
1650 1550
0.20
1450 1350 1250
0.10
1150 0.5
1.0
1.5
x1
2.0
t = 450 ms
2050 1950
0.40
x2
1850 1750 1650
0.30
1550 1450
0.20
1350 1250
0.10
1150 0.5
1.0
Figure 2 continued ...
15
1.5
x1
2.0
it captures enough air to satisfy the flammability limits of the fuel. For methane, the bulk of the fuel escapes the primary combustion zone unburnt because of its rich flammability limit being low. As the rich blobs march downstream, they capture more air, and reach a state where their fuel-air ratios lie within the flammability limits, and combustion is promoted. This causes the temperature rise of the turbules as they march downstream. This phenomenon was not observed in the propane-air flames investigated by Rocquemore et al. [35]. For the present methane flame, hot spots are observed to form in the air stream almost randomly. This is probably caused by the fact that the reaction rate of methane is highest when it exists in traces. In most cases, the concentration of methane, entrained in the air stream, is too low to promote combustion, but at times it exceeds the lean flammability limit and, since the reaction rate is highest at this limit, this promotes intense combustion, forming local hot spots. The distributions of the various species and the corresponding temperature distribution have been illustrated in the contour plots in Fig. 3, in which the profiles at 450 ms have been plotted for the same case as in the preceding figure. The dynamic interactions between fluid entrainment, mixing, and combustion processes, which result in the instability, are undoubtedly complex, and can only be explained subjectively, at best. Rocquemore et al. [35] and also Lee and Onuma [36] postulate that the fuel jet penetrates into the region of intense combustion (just downstream of the ‘neck’ of the flame) in discrete, almost periodic, bursts, and that this is the root cause of turbule formation. This would imply that in the ‘neck’ region, which typically occurs at x1=D ' 10 [39], the axial velocity at the centerline would be almost periodic. Data supporting this conjecture are shown in Fig. 4, which indicates a distinct periodic behavior in time of the velocity in question. The data shown in Fig. 4 are for Case 1. Similar behavior was also observed for all the other cases. Figure 2 shows that two turbules are formed between 270 and 450 ms, which is exactly equal to the number of crests or troughs observed to lie within that time interval in Fig. 4. This observation lends further support to the postulate of Rocquemore et al. [35] and Lee and Onuma [36]. In the presence of radiation and turbulence-radiation interactions, the overall behavior and structure of the flame remains almost the same. Noticeable differences, however, are observed in the flame temperatures. This has been illustrated in the series of frames in Fig. 5. Since the turbule formation process has already been demonstrated in Fig. 2, in this case only five frames are shown. The data presented here are for Case 3, which is identical to Case 1, except that thermal radiation and turbulence-radiation interactions were not neglected. In this case emission from the flame (to be quantified later) competes with heat release due to reaction. The net effect could produce a rise or fall in temperature depending on the relative strength of the two processes in question. Thus, the temperature of the marching turbules sometimes increase (as in the second turbule from 410 to 450 ms) and sometimes decrease (as in the first turbule from 290 ms onwards). Radiation appears as an important balancing mechanism: strong reaction produces high temperatures, in which case emission from the flame also becomes strong, and helps to keep the temperature under control. Figure 6 shows a contour plot of the divergence of the radiative heat flux, which is essentially a measure of the net radiative emission from the flame. In regions where the flame is strongly emitting, the divergence is large and positive, and in regions where the flame is absorbing, the divergence is negative. The data plotted in Fig. 6 are for Case 2, i.e. a case that does not take TRI into account. The dark shades indicate regions of strong emission, while the lighter shades indicate regions of absorption (negative divergence). The magnitude of the maximum negative divergence is considerably smaller than the maximum positive divergence (by about two orders of magnitude), implying that although there are parts of the flame which do absorb energy by radiation, they are only 16
Temperature
2050 1950
0.40
x2
1850 1750 1650 1550 1450 1350
0.30 0.20
1250 1150
0.10 0.5
1.0
1.5
x1
2.0
Methane mass-fraction
0.8000 0.7122 0.6244 0.5367 0.4489 0.3611
0.40
x2
0.30
0.2733 0.1856 0.0978 0.0100
0.20 0.10 0.5
1.0
1.5
x1
2.0
Oxygen mass-fraction
0.2 0.18
0.40
x2
0.16 0.14 0.12 0.1 0.08
0.30 0.20
0.06 0.04 0.02
0.10 0.5
1.0
1.5
x1
2.0
Carbon-dioxide mass-fraction
0.1 0.09 0.08 0.07 0.06 0.05
0.40
x2
0.30
0.04 0.03 0.02 0.01
0.20 0.10 0.5
1.0
1.5
x1
2.0
Water-vapor mass-fraction
0.081 0.073 0.065 0.057
0.40
x2
0.049 0.041 0.032 0.024 0.016 0.008
0.30 0.20 0.10 0.5
1.0
1.5
x1
Figure 3: Temperature and concentration profiles for Case 1 at 450 ms
17
2.0
Nondimensional axial velocity
0.8 0.7 0.6 0.5 0.4 0.3 0.2 0.1 0.0 0.0
0.1
0.2
0.3
0.4
0.5
0.6
0.7
0.8
time(s)
Figure 4: Centerline nondimensional (normalized by hUf�in i) axial velocity at function of time
18
x1 =D
= 9:375 as a
t = 290 ms
2050 1950 1850 1750 1650
0.40
x2
0.30
1550 1450 1350 1250 1150
0.20 0.10 0.5
1.0
1.5
x1
2.0
t = 330 ms
2050 1950 1850 1750 1650
0.40
x2
0.30
1550 1450 1350 1250 1150
0.20 0.10 0.5
1.0
1.5
x1
2.0
t = 370 ms
2050 1950 1850 1750 1650
0.40
x2
0.30
1550 1450 1350 1250 1150
0.20 0.10 0.5
1.0
1.5
x1
2.0
t = 410 ms
2050 1950 1850
0.40
x2
1750 1650 1550 1450 1350 1250
0.30 0.20 0.10
1150 0.5
1.0
1.5
x1
2.0
t = 450 ms
2050 1950 1850 1750
0.40
x2
1650 1550 1450 1350 1250
0.30 0.20 0.10
1150 0.5
1.0
1.5
Figure 5: Flame structure with radiation and TRI
19
x1
2.0
t = 450 ms 700000 621111
0.4
305556
X2
226667
0.3
147778 68888.9
0.2
0 -5000
0.1
-10000 0.5
1.0
1.5
X1
Figure 6: Divergence of radiative heat flux representative of absorption and emission from the flame Line Contours: With TRI Flood Contours: Without TRI
X2 0.40
0.30
5
700000
4 3
550000 400000
2
250000
1
100000
3
1
1 2
21 3
1
2 2
5
4
3
5 2
4
4
3 3
0.20
3
2
2
2
1
1
1
0.10
0.5
1.0
1.5
X1
Figure 7: Effect of TRI on the divergence of the radiative heat flux weakly absorbing. The net effect is strong emission from the core of the flame, thereby producing the lower temperatures discussed earlier in this section. Inclusion of TRI terms changes the entire flame structure, the temperature and composition fields, and the heat release due to reaction (since the reaction rate is dependent on temperature and compositions). This implies that a comparison of the divergences or any such quantities for the two cases at any given instant of time would be misleading. The effect of TRI can be best demonstrated, rather, by freezing a shot at any point in time, and then calculating the divergences first by turning off the TRI terms, and finally by turning them on. This approach isolates the effect of TRI on the flame emission and wall heat loads. In the current context, a restart file was generated after 460 ms for Case 2. The TRI terms were then turned on, and a single time-step of one nanosecond was used to obtain the results for the case with TRI. A comparison of the divergences of the radiative heat fluxes is given in Fig. 7. It is clear from the figure that TRI causes the regions of strong divergence to become larger and the flame to spread out more into the coflowing air stream. In other words, the flame, in the presence of TRI, is more strongly emitting than the case without TRI. Since absorption 20
% Increase in Wall Heat Flux
50
45
40
Radiative Total 35
30
25 0.0
0.5
1.0
1.5
X1(m)
2.0
Figure 8: Effect of TRI on the wall heat fluxes by the flame is relatively small, this implies that the heat loads at the walls should increase as a result of the inclusion of TRI. The wall heat fluxes were also calculated after the operation described above. Figure 8 illustrates the increase in the wall heat flux caused by TRI, expressed as a percentage of both the radiative heat flux and the net (radiative and convective) heat flux. The convective heat flux was noted to change only negligibly when TRI was included. An average increase of about 40% was found for the radiative heat flux, while the total heat flux increased by about 28%. A quantity of extreme practical importance is the heat load on the bluff body. In many practical burners excessive radiative load on the fuel injection nozzle has been known to cause meltdown. Since the bluff body is quite small in size, it is adequate to calculate an increase in the average heat flux (rather than the exact heat flux distribution) caused by TRI. In this particular case, the radiative heat flux on the bluff-body was enhanced by 45%, while the total heat flux increased by 35% when TRI is included. The percentage increase in the total heat flux is larger than for the top and bottom walls, because the convective heat fluxes on the bluff-body are relatively small, since in the wake behind the bluff body the flow velocities are quite small in comparison with the axial velocity of the air stream flowing past the top and bottom walls.
Effects of Inlet Equivalence Ratio The absence of a steady-state solution to the problem under consideration poses severe problems in data presentation. When the inlet equivalence ratio, �in , for example, is changed, the entire flame structure, and the time history of the flame, changes. Comparing results at any instance of time for the various cases is not at all meaningful since at the same instant of time, the flame structure and 21
�in qRw without TRI qRw with TRI qCw without TRI qCw with TRI 1.05 1.0 0.9 0.8
110.6 115.5 115.8 117.6
155.2 163.6 164.7 159.4
27.6 31.3 38.9 48.0
26.9 30.1 35.5 43.8
Table 2: Nondimensional average heat loads on the bluff body at various inlet equivalence ratios turbule locations are completely different for different values of � in . Even for the same value of �in such a comparison is not meaningful since the time histories are significantly different for the cases with and without radiation (and TRI). The above difficulty was overcome by a tedious data processing procedure. The steps involved were as follows: 1. Figures, similar to Fig. 4, were plotted for each case with and without TRI. 2. A time-period was determined for each case by careful examination of these plots. Typically they varied between 90 to 120 ms. 3. The data files for each case, which were stored earlier at 10 ms intervals, were averaged over two time periods once it was ascertained that the initial startup period had passed. This procedure yields a time average over two ‘periods’. While the determination of the so-called ‘time-period’ is somewhat qualitative, this procedure gives a fair average quasi-steady representation of the various cases. In fact, it was found that by performing the same operation over a single period or two periods produced results within 6% for each case. This discrepancy can easily be attributed to the difficulty in determining of the exact time-period in each case, and to the fact that this period is not globally true. The procedure, described above, was used to post-process wall heat flux data for the four different equivalence ratios with and without TRI. The nondimensional convective and radiative wall heat fluxes are depicted in Fig. 9. The heat fluxes have been normalized by � (hTa�in i ; Tw ) = B , where � is the thermal conductivity of the medium (assumed to be that of air at 1200 K), Tw is the wall temperature, hTa�in i is the mean inlet air temperature, and B is the size of the bluff body. Several important facts are revealed by Fig. 9. First, it shows that irrespective of the equivalence ratio, TRI enhances the radiative heat fluxes at the top and bottom walls by about 40%. Secondly, the radiative heat fluxes, on average, are about 1.6 times larger than the convective heat fluxes without TRI, and about 2.4 times larger when TRI is included. The inclusion of TRI, as shown earlier, makes the flame colder. The impact of TRI, however, is restricted to the hot axial zone of the flame where radiative effects are strong, and where the fluctuations in the temperature and composition fields are large. Convection is a local phenomenon, and the wall convective heat fluxes are a function of only the temperature of the fluid film adjacent to the wall, which is not affected by the changes in the hot axial zone. Consequently, the convective wall heat fluxes at the top and bottom walls remain unaffected by the inclusion of TRI, which is corroborated by Fig. 9. The maximum change in the convective heat flux at any location is 3.3%. Another important observation is that the radiative heat flux reaches a peak in the first half of the channel, where the primary hottest combustion zone is always located. Contrary to this observation, the convective heat flux decreases monotonically in the downstream direction. The nondimensional average heat loads on the bluff body are tabulated in Table 2. Here too, as for the walls considered earlier, the radiative heat flux is enhanced by about 40% for all equivalence 22
Nondimensional Wall Heat Flux
200 Radiative flux with TRI
180
160
140
Radiative flux without TRI
120
Φin=1.0 Φin=1.05 Φin=0.9 Φin=0.8
100
80 Convective flux
60 0.0
0.5
1.0
1.5
x1(m) 2.0
Figure 9: Nondimensional wall heat fluxes at various inlet equivalence ratios with and without TRI
Φi = 1.0
Φi = 0.9
x2
Φi = 0.8 2250 2171.43
x2
x2
0.40
0.40
0.40
0.30
0.30
0.30
0.20
0.20
0.20 0.4
1464.29 1385.71
0.10
0.10
0.10 0.3 0.2
1307.14 1228.57
2092.86 2014.29 1935.71 1857.14 1778.57 1700 1621.43 1542.86
0.1 0.1
0.2
0.3
x1
0.4
0.5
0.1
0.2
0.3
x1
0.4
0.5
1150 0.1 0.2 0.3 0.4 0.2 0.5 0.1
0.3
x1
0.4
0.5
Figure 10: Temperature contours in the wake of the bluff-body for various equivalence ratios after 450 ms 23
ratios. An interesting trend is observed for the convective heat flux: as the inlet equivalence ratio decreases, the convective heat flux increases. An increase of 35% is observed when comparing equivalence ratios of unity and 0.8, as opposed to almost no change for the top and bottom walls. This is due to the fact that here the equivalence ratio is decreased by decreasing the fuel injection velocity (Table 1). As a result, the temperatures in the wake behind the bluff body are significantly larger for smaller equivalence ratios. This is illustrated in Fig. 10. Although a single snapshot is shown here, the above observation was made for all times. Rocquemore et al. [35] and Lee and Onuma [36] discusses the structure of the recirculation zone behind the bluff-body for various fuel injection speeds. For slower fuel injection speeds, the recirculation zone behind the bluff-body becomes stronger and assumes an almost spherical shape. Bulk mixing, in such cases, plays a significant role. Consequently, convective heat transfer behind the bluff body becomes stronger. This is reflected in Table 2, where a distinct increase in convective heat flux is noted for smaller values of �in (slower flow). For small equivalence ratios, it is also observed that TRI decreases the convective heat flux by about 9%, as opposed to the maximum of 3% that was noted for the top and bottom walls. Inclusion of TRI decreases the temperatures, and due to stronger mixing (than near the top and bottom walls) behind the bluff body, the convective heat load on the bluff body is affected.
Effects of Reynolds number Thus far, the discussion has been limited to a single Reynolds number. For this baseline Re equal to 13,304, it was found that the radiative fluxes dominated the convective fluxes. As the Reynolds number is increased, convective fluxes are expected to become more and more dominant. The relative magnitude of the convective and radiative heat loads has always been an important issue in burner design and, therefore, the Reynolds number is definitely an important parameter. Computations were performed at three different Reynolds numbers (Cases 13 through 18). The general flame structure for Reynolds numbers of 26,608 and 39,912 have been illustrated in Figs. 11 and 12 for the cases without radiation (Cases 13 and 16). All calculations were performed at a baseline equivalence ratio of unity. Two noticeable trends are observed. First, as the Reynolds number is increased, the flame on an average gets colder. This is clear from Figs. 3, 11, and 12. Secondly, as the Reynolds number is increased, the flame seems to extinguish completely in the neck region before reigniting further downstream. This is a typical experimentally observed phenomenon. The heat released by chemical reaction is transferred away by convection and radiation. As the flow speed is increased, convective transport increases. High flow rate implies that the residence times of the fluid blobs within any volume in space are shorter. In the presence of finite-rate kinetics, therefore, a smaller amount of heat would be released in a given volume. These two phenomena, in conjunction, results in lower temperatures. Blowout or extinction is actually the limit when the heat transfer rates are so large that the chemical reaction cannot proceed at a rate fast enough to sustain the flame. The same procedure, as described earlier, was adopted to obtain a quasi-steady representation of the wall heat fluxes at the three different Reynolds numbers. Figure 13 shows the nondimensional radiative and convective wall heat fluxes at various Reynolds numbers. As discussed earlier, with an increase in the Reynolds number, the flame gets colder and consequently, the radiative heat fluxes decrease both with and without TRI. The convective heat fluxes, on the other hand, increase with an increase in the Reynolds number in accordance with earlier expectations. For the two higher Re, convective and radiative wall heat loads contribute almost equally to the net heat flux. The effect of 24
Temperature
2050 1950
0.40
x2
1850 1750 1650 1550 1450 1350
0.30 0.20
1250 1150
0.10 0.5
1.0
1.5
x1
2.0
Methane mass-fraction
0.800 0.712 0.624 0.537 0.449 0.361
0.40
x2
0.30
0.273 0.186 0.098 0.010
0.20 0.10 0.5
1.0
1.5
x1
2.0
Oxygen mass-fraction
0.2 0.18
0.40
x2
0.16 0.14 0.12 0.1 0.08
0.30 0.20
0.06 0.04 0.02
0.10 0.5
1.0
1.5
x1
2.0
Carbon-dioxide mass-fraction
0.1 0.09 0.08 0.07 0.06 0.05
0.40
x2
0.30
0.04 0.03 0.02 0.01
0.20 0.10 0.5
1.0
1.5
x1
2.0
Water-vapor mass-fraction
0.081 0.0729 0.0648 0.0567
0.40
x2
0.0486 0.0405 0.0324 0.0243 0.0162 0.0081
0.30 0.20 0.10 0.5
1.0
1.5
x1
2.0
Figure 11: Temperature and concentration distributions for Re = 26,608 at 240 ms
25
Temperature
2050 1950
0.40
x2
1850 1750 1650 1550 1450 1350
0.30 0.20
1250 1150
0.10 0.5
1.0
1.5
x1
2.0
Methane mass-fraction
0.800 0.712 0.624 0.537 0.449 0.361
0.40
x2
0.30
0.273 0.186 0.098 0.010
0.20 0.10 0.5
1.0
1.5
x1
2.0
Oxygen mass-fraction
0.2 0.18
0.40
x2
0.16 0.14 0.12 0.1 0.08
0.30 0.20
0.06 0.04 0.02
0.10 0.5
1.0
1.5
x1
2.0
Carbon-dioxide mass-fraction
0.1 0.09 0.08 0.07 0.06 0.05
0.40
x2
0.30
0.04 0.03 0.02 0.01
0.20 0.10 0.5
1.0
1.5
x1
2.0
Water-vapor mass-fraction
0.081 0.0729 0.0648 0.0567
0.40
x2
0.0486 0.0405 0.0324 0.0243 0.0162 0.0081
0.30 0.20 0.10 0.5
1.0
1.5
x1
2.0
Figure 12: Temperature and concentration distributions for Re = 39,912 at 150 ms
26
Nondimensional Wall Heat Flux
Re = 13,304 180
160
140
120
Radiative Flux without TRI Convective Flux (with and without TRI) Radiative Flux with TRI
100
80
60 0.0
0.5
1.0
1.5
x1(m)
2.0
Nondimensional Wall Heat Flux
Re = 26,608 180
160
140
120
100
80
Radiative Flux without TRI
60
Convective Flux (with and without TRI) Radiative Flux with TRI
0.0
0.5
1.0
1.5
x1(m)
2.0
Nondimensional Wall Heat Flux
Re = 39,912 180
160
140
Radiative Flux without TRI
120
Convective Flux (with and without TRI) Radiative Flux with TRI
100
80
60 0.0
0.5
1.0
1.5
x1(m)
2.0
Figure 13: Nondimesional wall heat fluxes at various Reynolds numbers
27
Re 13,304 26,608 39,912
qRw without TRI qRw with TRI qCw without TRI qCw with TRI 115.5 91.1 77.9
163.6 144.8 136.8
31.3 45.0 53.7
30.1 44.9 53.0
Table 3: Nondimensional average heat loads on the bluff-body at various Reynolds numbers TRI, once again, is to substantially enhance the radiative heat loads, and cause insignificant changes in the convective heat loads. Although the radiative heat fluxes decrease with increasing Re, the enhancement of the radiative heat fluxes caused by TRI is almost constant if absolute magnitudes are considered and, in fact, larger at higher Re if the enhancement is expressed as a percentage of the radiative heat flux without TRI. The fact that the effect of TRI is almost constant even if the flame is cold, suggests that its role can, by no means, overlooked or ignored. If TRI is included, the extinction of the flame, for example, would take place at relatively lower flow speeds than for the case when TRI is not taken into account. In Fig. 13 it is also observed that for a lower Reynolds number, the peak radiative load on the wall lies in the first half of the channel. With an increase in the Reynolds number, the peak shifts downstream. This is due to the fact that for a lower Re, the primary combustion zone is the hottest. With an increase in Re, the primary combustion zone becomes colder, and the secondary turbules are often hotter than the primary combustion zone. The reason for this has already been explained earlier, and can also be observed if the temperature contours, depicted in Figs. 11 and 12, are compared. The heat loads on the bluff body have been tabulated in Table 3 for various Reynolds numbers. Here too, as was the case for the top and bottom walls, the radiative heat fluxes decrease with an increase in the Reynolds number. The magnitude of the radiative heat fluxes on the bluff body are still much larger than the convective heat fluxes. Although the convective heat fluxes on the bluff body increase with an increase in Re, even for the highest Re, its magnitude is substantially smaller than the radiative heat fluxes, especially if TRI is taken into account. This is an important observation from a practical standpoint, because damage to injection nozzles in most practical burners is caused by radiative feedback of heat, rather than the convective heat loads. The primary reason for this is that the flame usually stabilizes in the vicinity of the nozzle tip, resulting in an extremely favorable configuration for radiation feedback. On the other hand, the bulk flow in jet flames or even buoyant flames is away from the bluff-body surface, resulting in low convective loads on the bluff body. It is a common practice to coat the bluff-body surface with a highly reflective coating, such as alumina. Soot, however, is formed primarily in the fuel-rich region close to the surface of the bluff body [39, 35], thereby rendering the radiation coating ineffective. In practical burners, the situation is kept in control by using radial jets to blow away the soot as soon as it is deposited on the bluff-body surface, so that the radiation coating stays exposed. If the total heat load (convective + radiative) on the bluff-body is considered, Table 3 reveals that without the inclusion of TRI, the net heat flux decreases by about 10% when the Reynolds number is increased threefold, while it decreases only by about 2% if TRI is included. This, of course, is in addition to the fact that with TRI the neat heat loads are much larger. These observations lead to the conclusion that if TRI is included, the bluff-body is susceptible to much larger heat loads at a wide range of Reynolds numbers.
28
Calculation Performed
% of total CPU
Radiative Property Averaging Solution of RTE Printing Output Smoothing & Derivatives Explicit Integration Boundary Treatment Chemical Reaction Miscellaneous Total CPU
3.61 8.92 4.44 0.22 1.26 8.45 8.15 63.27 1.67 96 seconds
Table 4: CPU budget for a single time step
Numerical Issues Two issues are of particular interest here: (1) the computational effort which was required to solve the problem under consideration, and (2) the statistical errors associated with the results presented in the preceding sections. Apart from its ability in being able to resolve the various interactions in a reactive flow problem, the PDF Monte Carlo method has the advantage of being able to produce worthwhile results within the limitations of a standard single-processor workstation. For the current study, since the problem under consideration does not have a steady state solution, a budget of the CPU consumed during a single time step was constructed. Table 4 shows the CPU consumed by each process within a time step expressed as a percentage of the total CPU consumed during the time step. The total CPU time required for a single time step calculation was 96 seconds (for Case 3) on a 195 MHz, single-processor R10000 Silicon Graphics Indigo2 computer, which suggests that a 400 time-step job would require approximately 11 hours. It is evident from Table 4 that the solution of the reaction rate equations constitute a major fraction of the total CPU time. This has been a serious challenge to researchers in the area of combustion and chemical kinetics for decades. Hydrocarbon combustion is known to be notoriously stiff and unstable, and the reaction rates are fast, to say the least. This is one of the prime reasons why even the simulation of laminar flames is computationally expensive and difficult. A discussion on the progress and challenges, pertaining to these issues, may be found in the review papers by Pope [23] and Westbrook and Dryer [38]. The accuracy of the results, which have been presented earlier, require closer examination. Statistical errors are inherent to any Monte-Carlo simulation. These errors arise from the fact that the number of samples used are always finite. By the theory of statistics, an increase in the number of statistical samples will increase the accuracy of the solution. In addition to these errors, there are errors associated with the pseudo-randomness of the random number generator used. In this particular case, there are additional sources of numerical errors, which are dependent on the size of the grid used, the spline fits used, the time-steps used, and so on. Individual investigation of all of these sources of error would result in a thesis in statistics by itself. For current purposes, only the statistical uncertainties will be estimated for the results presented earlier. To estimate the statistical uncertainties, Case 3 was computed up to 250 ms ten different times. For each run, a 29
(a) T(K)
2200 2100 2000 1900 1800 1700 1600 1500 1400 1300 1200 0.0
0.5
1.0
1.5
x1(m)
2.0
(b) T(K)
2200
2000
1800
1600
1400
1200 0.00
0.10
0.20
0.30
0.40
0.50
x2(m)
Figure 14: Statistical errors associated with temperature: (a) temperature along channel centerline (x2 = 0:25 m) with uncertainties, and (b) temperature along a cross-section cut at x1 = 0:4 m with uncertainties
30
(a) YCO2
0.100 0.090 0.080 0.070 0.060 0.050 0.040 0.030 0.020 0.010 0.000 0.0
0.5
1.0
1.5
x1(m)
2.0
(b) YCO2
0.10
0.08
0.06
0.04
0.02
0.00 0.00
0.10
0.20
0.30
0.40
0.50
x2(m)
Figure 15: Statistical errors associated with CO2 concentrations: (a) CO2 mass-fraction along channel centerline (x2 = 0:25 m) with uncertainties, and (b) CO2 mass-fraction along a cross-section cut at x1 = 0:4 m with uncertainties
31
(a) YCH4
0.50
0.40
0.30
0.20
0.10
0.00 0.0
0.5
1.0
1.5
x1(m)
2.0
(b) YCH4
0.7 0.6
0.5
0.4 0.3
0.2 0.1
0.0 0.00
0.10
0.20
0.30
0.40
0.50
x2(m)
Figure 16: Statistical errors associated with CH4 concentrations: (a) CH4 mass-fraction along channel centerline (x2 = 0:25 m) with uncertainties, and (b) CH4 mass-fraction along a cross-section cut at x1 = 0:15 m with uncertainties
32
different set of starting random number seeds were used. The mean of all quantities at all spatial locations were stored from all ten runs. They were finally averaged to provide the mean of the means at all spatial locations. The deviation of the individual data sets from the mean of the mean provided the standard deviation (or uncertainty). The uncertainties were computed separately for each species. Figures 14 through 16 show the statistical errors associated with the calculation of temperature, methane concentration, and carbon dioxide concentration. For temperature and carbon dioxide mass-fractions, uncertainties are shown along the channel centerline and for a cross-section at x1 = 0:4 because these are sections where the chemical reaction is strong, and where the bulk of the action takes place. For methane, a cross-section at x1 = 0:15 is depicted because this was observed to be the section of maximum uncertainty. Furthermore, this location corresponds to x1 =D ' 10, which is the so-called ‘neck’ of the flame, and the location at which the sporadic injection of methane (discussed earlier in Section 8.1) occurs. Figures 14 through 16 indicate that the standard deviations are largest in regions associated either with physical instabilities or with strong nonlinear phenomena such as chemical reaction. This is not surprising in the sense that even for Eulerian approaches the maximum inaccuracies are usually in regions of strong nonlinearities or physical instabilities. One has to also consider the fact that only ten data sets were considered for the standard deviation computations in this particular case. In theory, the calculations should be performed by doubling the number of particles to investigate the effect of the number of particles on the uncertainties. In practice, however, this process is extremely cumbersome and computationally expensive. Ten runs with twice the number of particles requires computational time in the order of several weeks, and was not carried out for that reason.
4
Summary and Conclusions
A novel approach for the computation of turbulent reactive flows including radiation has been presented. The velocity-composition joint PDF is unique approach that can resolve the various interactions between turbulence, chemical reaction and radiative transfer. In the current study, the method has been applied to a two-dimensional bluff-body burner. It has been established that the method, while being a powerful tool in resolving the above-mentioned interactions, has the added benefit of being computationally tractable and economic. The results may be summarized as follows: 1. The experimentally observed turbule shedding phenomenon, the stretching of the flame, and the sporadic injection of fuel into the primary combustion zone were, at least qualitatively, reproduced by the current code. 2. It was observed that radiation resulted in the flame being about 250 K colder, on the average, than a nonradiating flame. When turbulence-radiation interactions (TRI) were included, the flame temperatures decreased by an additional 100 K. Turbulence-radiation interactions enhance emission from the flame, and since the bulk of the gas within the combustor is optically thin, stronger flame emission results in an increase in wall radiative heat loads. 3. The increase in radiative heat fluxes due to TRI was almost the same at all inlet equivalence ratios for a baseline Reynolds number of 13,304. In each case the radiative heat flux at the top and bottom walls, as well as the bluff body, increased by about 40-45% when TRI was included. The convective heat fluxes at the top and bottom walls remained unchanged when TRI was included, and were also observed to be the same at various inlet equivalence ratios. Since the inlet equivalence ratio was adjusted by adjusting the fuel injection speed, noticeable differences were observed in temperature distributions close to the bluff body at various inlet 33
equivalence ratios. At smaller inlet equivalence ratios (smaller fuel injection speeds), the convective heat loads on the bluff body were observed to be larger. In addition, the inclusion of TRI was observed to decrease the convective heat loads on the bluff body. 4. Simulations were also performed for various Reynolds numbers at a baseline inlet equivalence ratio of unity. With an increase in Reynolds number, the flame became colder, and consequently, the radiative wall fluxes decreased. On the other hand, the convective wall heat fluxes increased with Reynolds number. When TRI was included, the radiative wall heat fluxes were enhanced by almost the same absolute values for all Reynolds numbers, although the net radiative flux was smaller for larger Reynolds numbers. At higher Reynolds numbers, the peak heat fluxes were also observed to shift further downstream. 5. The statistical errors associated with the calculations were reported. It was found that the errors were highest in regions of strong chemical reaction and radiation, the highest being in the order of about 16%. Technology is changing rapidly. In the computational field, the thrust is shifting from supercomputing to distributed computing. Lagrangian methods are extremely suitable for distributed computing by the very nature of their algorithms. In addition, they provide highest returns when used for complex problems. With the increase in the size and complexity of engineering problems dealt with today, it appears that novel techniques, such as the one outlined here, are becoming more of a necessity than a mere option. Hopefully, the advantages and benefits of using the velocitycomposition joint PDF method have been emphasized and highlighted enough to lure the reader into adopting the current approach in his or her research.
Acknowledgment The authors wish to thank the Applied Research Laboratory at Penn State for partial funding of this research. The first author also wishes to thank Dr. Stephen R. Turns for his suggestions on the combustion aspects of the problem, Dr. Timothy F. Miller for his help with CFD issues, and Silicon Graphics Inc. for sharing their computational resources.
References 1. G. Cox, On Radiant Heat Transfer from Turbulent Flames, Combustion Science and Technology 17, 75–78 (1977), Short Communication. 2. S.E. Elghobashi and W.M. Pun, A Theoretical and Experimental Study of Turbulent Diffusion Flames in Cylindrical Furnaces, Fifteenth Symposium (International) on Combustion / The Combustion Institute, 1353 (1974). 3. V.P. Kabashnikov and G.I. Myasnikova, Thermal Radiation in Turbulent Flows - Temperature and Concentration Fluctuations, Heat Transfer - Soviet Research 17(6), 116–125 (1985). 4. V.P. Kabashnikov, Thermal Radiation in Turbulent Flows - in the Case of Large Fluctuations of the Absorption Coefficient and the Planck Function, Journal of Engineering Physics 49(1), 778–784 (1985). 5. V.P. Kabashnikov and G.I. Kmit, Influence of turbulent fluctuations on thermal radiation, J. Appl. Spectrosc. 31, 963–967 (1979). 6. B.E. Pearce and A.K. Varma, Radiation-Turbulence Interaction in a Tactical Missile Exhaust Plume, AIAA Paper (81-1110), (1981). 34
7. M. Germano, Turbulent Fluctuations Coupled with the Radiation Field, AIAA Paper (78-840), (1978). 8. J. Hall and A. Vranos, Efficient Calculations of Gas Radiation fron Turbulent Flames, Int. J. Heat Mass Transfer 37(17), 2745–2750 (1994). 9. A. Soufiani, P. Mignon and J. Taine, Radiation-Turbulence Interaction in Channel Flows of Infrared Active Gases, Proceedings of the International Heat Transfer Conference 6, 403–408 (1990). 10. T.H. Song and R. Viskanta, Interaction of Radiation with Turbulence: Application to a Combustion System, Journal of Thermophysics 1(1), 56–62 (1987). 11. S.H. Chan and C.F. Chern, A Method for Turbulence-Radiation Interaction Analysis in Multiphase Liquid Metal Diffusion Flames, Proceedings of the Ninth International Heat Transfer Conference, Jerusalem, Israel 4(11-J-04), 143–148 (1990). 12. J.P. Gore, S.M. Jeng and G.M. Faeth, Spectral and Total Radiation Properties of Turbulent Carcon-monoxide/air Diffusion Flames, AIAA Journal 25(2), 339–345 (1987). 13. M. Kounalakis, Y. Sivathanu and G.M. Faeth, Infrared Radiation Statistics of Nonluminous Turbulent Diffusion Flames, ASME/JSME Thermal Engineering Proceedings 5, 3–12 (1991). 14. J.P. Gore, S.M. Jeng and G.M. Faeth, Spectral and Total Radiation Properties of Turbulent Hydrogen/Air Diffusion Flames, Journal of Heat Transfer 109, 165–171 (1987). 15. S.M. Jeng, M.C. Lai and G.M. Faeth, Nonluminous Radiation in Turbulent Buoyant Axisymmetric Flames, Combustion Science and Technology 40, 41–53 (1984). 16. K.K. Kuo, Principles of Combustion, John Wiley and Sons, Inc., (1986). 17. R.W. Bilger, Turbulent Jet Diffusion Flames, Progress in Energy and Combustion Science 1, 87–109 (1976). 18. AEA Industrial Technology, Harwell Laboratory Oxfordshire OX11 0RA, United Kingdom, HARWELL-FLOW3D User manual (May 1990). 19. D.B. Spalding, Mixing and Chemical Reaction in Steady, Confined Turbulent Flames, Thirteenth Symposium on Combustion / The Combustion Institute, 643 (1970). 20. D.B. Spalding, Development of the Eddy-Breakup Model of Turbulent Combustion, Sixteenth Symposium on Combustion / The Combustion Institute, 1657 (1976). 21. P.A. Libby and K.N.C. Bray, Counter-Gradient Diffusion in Premixed Turbulent Flames, AIAA Paper no. 80-0013, (1980). 22. S. Mazumder, Numerical Study of Chemically Reactive Turbulent Flows with Radiative Heat Transfer, PhD thesis, The Pennsylvania State University, (January 1997). 23. S.B. Pope, Computations of Turbulent Combustion : Progress and Challenges, Twenty-Third Symposium (International) on Combustion / The Combustion Institute, 591–612 (1990). 24. S.B. Pope, PDF Methods for Turbulent Reactive Flows, Progress in Energy and Combustion Science 11, 119–192 (1985). 25. M.F. Modest, Radiative Heat Transfer, McGraw Hill, Inc., (1993), pp. 303-305. 26. D.C. Haworth and S.B. Pope, A PDF Modeling Study of Self-Similar Turbulent Free Shear Flows, Physics of Fluids 30, 1026–1044 (1987). 27. C. Dopazo, Probability Density Function Approach for a Turbulent Axisymmetric Heated Jet. Centerline Evolution, Physics of Fluids 18(4), 397–404 (1975). 28. S. Mazumder and M.F. Modest, A Stochastic Lagrangian Model for Near-Wall Turbulent Heat Transfer, ASME Journal of Heat Transfer, (1996), (accepted; in press).
35
29. S. Mazumder and M.F. Modest, Boundary Conditions and an Efficient Pressure Algorithm for Internal Turbulent Flows using the PDF Method, Int. J. for Numerical Methods in Fluids 24, 1–18 (1997). 30. C.K. Westbrook and F.L. Dryer, Simplified Reaction Mechanisms for the Oxidation of Hydrocarbon Fuels in Flames, Combustion Science and Technology 27, 31–43 (1981). 31. C.W. Gear, Numerical Initial-Value Problems in Ordinary Differential Equations, PrenticeHall, Englewood Cliffs, New Jersey, (1971). 32. D.K. Edwards, Molecular Gas Band Radiation, Advances in Heat Transfer 12, 115–193 (1976). 33. A.T. Modak, Exponential Wide Band Parameters for the Pure Rotational Band of Water Vapor, J. Quant. Spectrosc. Rad. Transfer 21, 131–142 (1979). 34. M.F. Modest and K.K. Sikka, The Stepwise Gray P-1 Approximation for Multi-Dimensional Radiative Transfer in Molecular-Gas-Particulate Mixtures, J. Quant. Spectrosc. Rad. Transfer 48(2), 159–168 (1992). 35. W.M. Roquemore, R.L. Britton and S.S. Sandhu, Dynamic Behavior of a Bluff-Body Diffusion Flame, AIAA Journal 21(10), 1410–1417 (1983). 36. C.E. Lee and Y. Onuma, Experimental Study of Turbulent Diffusion Flames Stabilized on a Bluff Body, JSME International Journal, Series B 37(1), 165–171 (1994). 37. A.R. Masri and R.W. Bilger, Turbulent Diffusion Flames of Hydrocarbon Fuels Stabilized on a Bluff Body, Twentieth Symposium (international) on Combustion, 319 (1984). 38. C.K. Westbrook and F.L. Dryer, Chemical Kinetic Modeling of Hydrocarbon Combustion, Prog. Energy Combustion Sci. 10, 1–57 (1984). 39. S.M. Correa, A. Gulati and S.B. Pope, Raman Measurements and Joint PDF Modeling of a Nonpremixed Bluff-Body-Stabilized Methane Flame, Twenty-fifth Symposium (International) on Combustion / The Combustion Institute, 1167–1173 (1994).
36