1] Wesley W. Chu and Lance M. T. Lan. \Task. Allocation and Precedence Relations for Dis- tributed Real-Time Systems". IEEE Transac- tions on Computers ...
A Performance Study on Load Balancing Algorithms with Task Migration Chin Lu and Sau-Ming Lau Computer Science Department The Chinese University of Hong Kong Shatin, Hong Kong
Abstract
In this paper, we present a performance study on three di�erent load balancing algorithms. The rst algorithm employs only task assignment, whereas the other two allow both task assignment and migration. We conclude that although task migration usually costs more than task assignment, under some situations it can augment task assignment to provide extra performance improvement. This is because task migration provides an alternate mechanism for distributing workload in a distributed system. The performance improvement by using this approach is especially signi cant when a heavily-loaded node has no appropriate tasks for assignment. Keywords: Dynamic load balancing algorithms, task migration, performance evaluation
1 Introduction
In a distributed system where a set of machines or processing nodes are connected by a local area network, some machines tend to have higher task arrival rates than others [11] [6]. It is desirable for such workload imbalance to be smoothed out so as to make use of the computing capacity of idle or lightly loaded machines. By then the CPU utilization and total system throughput can be maximized while the average task response time can be minimized. Load balancing algorithms try to accomplish this objective by relocating tasks to other machines so that the workload on each machine is approximately the same. Task relocations can be most easily done with a homogeneous environment, in which all processing nodes are functionally equivalent, except some locally connected peripherals. The two most commonly used approaches in task relocations are task assignment and task migration. Task assignment refers to the initial placement of tasks to processing nodes. Task migration is the relocation of an executing task to another processing node. In task migration, the task being migrated is suspended and the state of the task is captured and transferred to the remote node. Typically, the state of a task consists of a virtual memory image, a process control block, I/O bu�ers, messages, le pointers, timers, and so on [9] [8]. The constituent state of a task varies widely with di�erent operating systems. In general, migration costs more than assignment [9]. However, migration may still provide performance improvement in some load distributions. Our primary objective in this study is to investigate situations where migration can augment assignment to provide extra performance improvement,
and to design load balancing algorithms for such use. We con ne our study to dynamic load balancing algorithms, in which the current (or near current) system load information are used to decide where in the network a task should be processed. Many algorithms have been designed using this approach [1] [3] [5] [10] [12] [7]. There are three important components in a dynamic load balancing algorithm : (1) Transfer Policy : it determines whether a node should participate in task relocations, either as a sender or a receiver, and selects the task(s) to be relocated from among a set of candidate tasks (task selection ); (2) Location Policy : it identi es the appropriate destination node, once the transfer policy has chosen a source node in task relocations (host selection ); and (3) Information Policy : it determines what information about the load states in the net is needed and how such information is to be collected. In this paper, we evaluate three dynamic load balancing algorithms. All of them use the same information and location policy. They di�er only in the transfer policy, task selection in particular. The rst algorithm employs only task assignment, whereas the other two allows both task assignment and migration. The third algorithm di�ers from the second in that a timer is used for initiating the load balancing algorithm. The location policy that the algorithms share is based on the symmetrically-initiated location policy proposed by Shivaratri and Krueger [7]. The information policy is based on a 3-level load scheme in which load states of nodes are exchanged by polling. The rest of the paper is organized as follows. Section 2 describes the system model, provides the cost model of the algorithm execution and communication delay, and a list of the performance metrics we used for evaluating the load balancing algorithms. Section 3 describes the load balancing algorithms we used for evaluation. Section 4 presents the performance results based on simulations. Section 5 gives the conclusion.
2 The System Model
The distributed system model described here applies to most current local area networks where every single node is an autonomous machine. The network is fully connected logically. In other words, a node is reachable from any other node. We de ne the node at which a new task arrives as the arrival node of the task and the node on which a task executes as the resident node of that task. In principle, task assignment algorithms bind an arrival task to a resident node. If the resident node is the same as the arrival
node, the assignment is said to be local . Otherwise, the assignment is said to be remote .
2.1 Analytical Host Model tasks migrated to remote node
tasks migrated from remote node unfinished tasks waiting for next CPU slice
Service Queue
CPU
local task arrival
Task Queue tasks assigned to remote node
Threshold Queue
finished task
tasks assigned from remote node
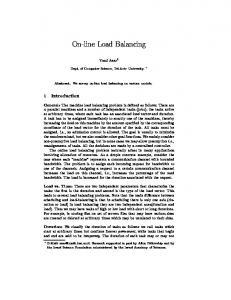
Figure 1: Analytical model of a node The analytical model of each node consists of three FIFO queues: the task queue , the service queue , and the threshold queue , as is shown in Figure 1. The task queue and the threshold queue both have in nite capacity. However, the service queue has a a xed capacity of Qo . When local tasks arrive, they go to the task queue to become candidates for task assignment. A task may be assigned either locally by entering the local threshold queue, or remotely by entering the threshold queue on a remote node. If no suitable node is found for an assignment, the task stays in the arrival task queue until next assignment algorithm invocation. Once a task enters the threshold queue, it will not be reassigned to another node. Tasks in the threshold queue can get the CPU for memory allocation only when an executing task is completed or when there is an empty slot in the service queue. A task is serviced by the CPU for at most a xed time slice, TCPU . If a task cannot nish within its time slice, it will go to the end of the service queue and wait for its turn again. Tasks in the service queue are candidates for migration. A task migration algorithm selects the appropriate task in the service queue, saves its current state, and transfers it to a remote node. The migrated task (migrant ) will have its state restored on the destination host, and then be put in the service queue to resume its execution. The performance of the algorithms will be evaluated by simulations. We assume that tasks arrivals on a node Pi have independent Poisson distribution with mean arrival rate �i . Suppose that n is the number of nodes. The mean arrival rates of the n nodes, f�1 ; �2; :::; �ng, have a log normal distribution with mean �o and standard deviation �� . This distribution characterizes the fact that di�erent nodes may be subjected to di�erent loads. We refer to ��, which is a measure of the load imbalance of the distributed system, as the imbalance factor of the system. Within a node Pi, the CPU time needed for completing a task (task service time ) has an exponential distribution with a mean of Si .
2.2 Cost Model
We assume that the CPU overhead and communication delay for task assignment/migration algorithm executions are not negligible. They will be calculated as the cost of the algorithms. We use time as a uni ed metric for measuring the overhead.
In this way, task response time is directly correlated with the overhead. We consider our task assignment/migration algorithms to have two distinct phases: location phase and transfer phase. In the location phase , sender and receiver negotiate. Depending on the particular algorithm, this negotiation may not be necessary. For example, a sender may assign a task to the receiver without the receiver rst agrees to accept. Location phase roughly corresponds to the execution of the location policy. In the transfer phase , the sender prepares for the task transfer message and sends it to the receiver. The receiver processes the message and puts the task into the appropriate queue.
Location Phase Cost:
Depending on the particular algorithm, there may be polling operations in the location phase. We assume the following cost model for it. Polling Cost = 2 � Cpolling + Fpolling + D (1) where Cpolling is a constant representing the CPU overhead in packing or unpacking the polling message, which consists of a single frame. This overhead is imposed on both the sender and the receiver of the polling message. Fpolling is a constant representing the time needed for injecting a single polling message frame into the communication channel. D is a constant representing the propagation delay. Before tasks can be assigned remotely or migrated, the sender (receiver) in some algorithms must get the consent from its counterpart. Several polls may have to be done before a counterpart can be successfully found. Unlimited number of polls may waste both CPU time and network bandwidth. Thus our algorithms introduce a limit for the number of polls used in the location phase, referred to as the probe-limit [3]. The probe-limit can also prevent inde nite postponement by the polling processing.
Assignment Transfer Phase Cost:
We assume the following cost model for task assignment transfer phase. Assignment CPU Overhead = Cassign + Cpack � li (2) Assignment Communication Delay = Ftask � li + D (3) where Cassign and Cpack are constants representing the CPU overhead of the assignment algorithm execution (for example, task selection), and the CPU overhead in packing or unpacking each message frame, respectively. li is the number of message frames generated for a task i, referred to as the task code length of i. Within a node, li has an exponential distribution with mean lassign. Ftask is a constant representing the time needed for injecting a single task message frame into the channel.
Migration Transfer Phase Cost:
The cost model of task migration di�ers from that of the task assignment only in the CPU overhead: Migration CPU Overhead = Cmigrate + Cpack � li (4) Migration Communication Delay = 0
Ftask � li + D (5) where Cmigrate represents the CPU overhead of the migration algorithm execution, for example, migrant selection and task image saving and restoration. Within each node, Cmigrate has an exponential distribution with mean Cmigrateo . The distribution characterizes the fact that some migration imposes more CPU overhead because of opened les, established communication channels, and allocated memory, etc. li represents the number of message frames generated for a task i, referred to as the task state length of i. Within a node, li has an exponential distribution with mean lmigrate . We assume that task assignment/migration algorithm execution has a higher priority than other tasks. A task in execution is suspended when the load balancing algorithm needs to be invoked. 0
0
0
2.3 Performance Metrics
This section describes the performance metrics which we will collect in our simulations. Some of these metrics are proposed and detailed by Kremien and Kramer in [4]. Mean Task Response Time: This is the primary performance metric of our load balancing algorithms. Performance Ratio: It is formulated as follows: Performance Ratio = ResponseTime(no LB) ? ResponseTime(LB) ResponseTime(no LB) where LB is the load balancing algorithm under study. This metric provides a normalized performance measurement under speci c condition. A positive performance ratio indicates an improvement in system performance. The closer the performance ratio to 1, the better the performance of the LB algorithm. A negative performance ratio indicates a degradation in system performance.
Standard Deviation of Task Response Times:
It measures the fairness of service because it indicates how much each individual task expects its response time can di�er from a mean value regardless of its arrival node. In other words, it measures the predictability of the system. Mean CPU Utilization: It measures the e�ectiveness of an algorithm in making maximal CPU utilization. However, execution of load balancing algorithms introduces extra CPU overhead and therefore it is essential to refer the level of the CPU overhead. Percentage of CPU Overhead: It measures the percentage of total CPU time spent on running the load balancing algorithm. It measures the level of CPU overhead injected by the algorithm to attain the corresponding performance improvement. Remote Execution Percentage: It measures the percentage of tasks executed remotely. Zhou et al. found that only a small percentage of remote execution is needed for signi cant performance gain [13]. Hit Ratio: This is the ratio of successful probing decisions over the total number of probes sent out. It measures the quality of the polling decisions. The exact de nition of a hit and a miss depends on the negotiation protocol of an algorithm.
Channel Utilization: It measures the network communication overhead injected by an algorithm including probing and task transfer messages.
3 Algorithms Description
This section presents the information, transfer, and location policies used in the load balancing algorithms. Recall that the three algorithms share the same information and location policies.
3.1 Information Policy
It has been shown that precise numerical load measurements are not required to make a load balancing algorithm e�ective [3] [5]. Therefore we use a 3-level load measurement scheme to describe the fullness of the service queue. The de nitions of load states used in the simulations are given in Table 1 and stated as follows. A node is in high load (Hload) if the service queue is more than two-third full. A node is in low load (L-load) if the service queue is one-third or less full. Otherwise, the node is in normal load (N-load). Polling is used to obtain individual node's load state. Table 1: 3-level load measurement scheme Load State Criteria H-load N > 32 Qo 1Q < N � 2Q N-load 3 o 3 o L-load N � 31 Qo
N = total number of tasks residing in the node Qo = service queue capacity
3.2 Transfer Policy
Transfer policy contains two parts: (1) determination of the need for task relocations; and (2) task selection. Task relocation is needed whenever a node is regarded as a potential sender or a potential receiver. This in turn depends on the load state of the node. A node in H-load is regarded as a potential sender, whereas a node in L-load is a potential receiver.
Task Selection for Assignment:
All the tasks in the assignment queue are candidates for task assignment. Unlike many proposed assignment algorithms which bind a locally arrived task permanently upon its arrival [3] [2] [7], we allow a task in the task queue to be a candidate for assignment until it is either assigned to a remote node or is dispatched to the local threshold queue.
Task Selection for Migration:
A task in the service queue is a candidate for migration if it satis es the following two criteria. (1) The candidate task is locally assigned. (2) The estimated remaining execution time of the candidate task is larger than the estimated overhead (in time) if it is migrated. The remaining execution time of the candidate task p, denoted as RETp , with arrival node j and accumulated execution time, AETp , is estimated as follows. RETp = Sj ? AETp (6) where Sj is the mean task service time of node j. The correct selection of a task for migration depends largely on the accuracy of the estimation of RETp .
3.3 Location Policy
There are three basic approaches of location policy: (1) sender-initiated : congested nodes search for lightly loaded nodes to which tasks can be transferred; (2) receiver-initiated : lightly loaded nodes search for congested nodes from which tasks can be transferred; and (3) symmetrically-initiated : both sender- and receiver-initiated approaches are used. Eager et al. [2] showed that receiver-initiated location policies perform better at high system load, whereas sender-initiated policies perform better at low to medium load. Shivaratri and Krueger [7] proposed a symmetrically-initiated location policy to capture the advantages of both approaches. The key feature of the location policy is to utilize the information gathered during probings to keep track of the recent load states of other nodes and thereby avoid instability due to indiscriminate probings. This feature improves the quality of probing decisions (when compared to random location policies [3] [7]) and thus complementary receiver/sender node is located more e�ciently, in the sense that less probing sessions are required. All the three algorithms we evaluate use this location policy.
3.4 Three Load Balancing Algorithms
The algorithms used in our simulation are described below. Sender-initiated negotiation of the location policy starts whenever a local task arrival triggers its arrival node into the H-load state. Receiver-initiated negotiation starts if a task completion makes that node in L-load. Algorithm A: This algorithm employs only task assignment but not migration. Algorithm AM : This algorithm allows both task assignment and migration. Task assignment has precedence over migration. That is, migration takes place only if the sender node nds no appropriate task for assignment. Algorithm AMT : This algorithm is identical to algorithm AM except that a receiver-timeout mechanism is used. The mechanism ensures that the receiverinitiated negotiation is invoked whenever a node has been in the L-load state for longer than receivertimeout , which is an algorithm design parameter. The mechanism avoids a potential receiver from remaining idle for a prolonged period without searching for a task to receive.
4 Simulations and Analysis of Results This section presents the simulation results and gives an analysis. We run simulations for two different system environment - even and uneven task service times. With even task service time, tasks arrive at all nodes have the same mean task service time. With uneven task service time, tasks arrive on some nodes require longer task service time than others.
4.1 Even Task Service Time
This set of simulations assume that all nodes generate tasks that share the same mean task service time, that is Si = 1, i = 1:::n. The arrival rate of di�erent nodes however is characterized by the log normal distribution (�o ; ��).
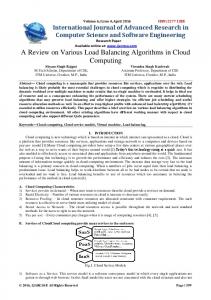
Primary Performance Comparisons: Figure 2 shows the comparisons of performance of
the three load balancing algorithms. We have the following performance observations.
(1) Figure 2(a) shows that both AM and AMT performs better than algorithm A under all range of system load. The di�erence is more signi cant when the system load is high (around mean arrival rate 0.9 to 1.0). In fact the system with either AM or AMT becomes saturated at higher system load when compared with algorithm A. The primary reason behind this observation is that the available processing power of the distributed system is more fully utilized with AM and AMT . This is shown in Figure 2(c) as higher mean CPU utilization. This can be explained by the fact that task migrations provide an alternate mechanism for task relocations when a busy node has no appropriate fresh task for assignment. A close examination of Figure 2(a) reviews that algorithm AMT performs better than AM at low to medium system load. This di�erence diminishes when the system load becomes high. This can be explained as follows. At low system load, the majority of nodes are lightly loaded. The time period between two successive task completions in a lightly loaded may be very long. With algorithm AM , receiver-initiated searching therefore occurs infrequently. A lightly loaded node may remain idle or nearly idle for a long time. The processing power of the node is wasted. With algorithm AMT , such waste of processing power is avoided by the receivertimeout mechanism. This is shown in Figure 2(c) as a higher CPU utilization, and in Figure 2(g) as a higher remote execution percentage of algorithm AMT . At high system load, the receiver-timeout mechanism has no need to trigger extra receiverinitiated task transfers because the probability that the receiver-timeout period expires is small. This accounts for the identical performance of algorithms AM and AMT at high system load. (2) Figure 2(b) shows that both algorithms AM and AMT have signi cantly lower response time standard deviation when compared with algorithm A. This means that AM and AMT provides fairer services than algorithm A. (3) Figure 2(d) shows a comparison of the percentage CPU overhead between the three algorithms. Algorithms AM and AMT have higher CPU overhead before the system is saturated at about 0.9. There are two reasons for this. The rst reason is that because of task migrations, AM and AMT have larger number of tasks relocations, which impose non-negligible CPU overhead. This is shown in Figure 2(g) as a higher remote execution percentage. Another reason is the smaller hit ratio which means a larger number of probings, Figure 2(e). These two reasons also account for the higher channel utilization of AM and AMT as shown in Figure 2(f). when the system is saturated, the CPU overhead imposed by algorithm A becomes the highest among the three because algorithm A has a lower hit ratio at high system load. More probe sessions are introduced until the probe-limit is reached or a complementary node is found. This is re ected in the higher channel utilization. (4) Figure 2(f) shows that all the three algorithms have low channel utilization at low system load. The channel utilization grows steadily with the system load until a peak where task relocations occur most frequently. After the peak, the channel utilization steadily drops with higher system load. This re ects the fact that all three algorithms adapt itself to the
system load.
7
30
A AM AMT
6
A AM AMT
5 % CPU Overhead
Response Time
25
20
4
3
2
15
1 10 0 0 5 0.6
0.7
0.8 0.9 Mean Arrival Rate
1
(a) Response Time
0.6 0.8 1 Mean Arrival Rate
1.2
1.4
1.6
1
A AM AMT
45
A AM AMT
0.8 0.7
40
0.6 Hit Ratio
Response Time Standard Deviation
0.4
0.9
50
35
0.5 0.4
30
0.3 25 0.2 20
0.1
15
0
10 0.6
0 0.7
0.8 0.9 Mean Arrival Rate
1
0.2
0.4
0.6 0.8 1 Mean Arrival Rate
1.2
1.6
8 A AM AMT
7
100 A AM AMT
98
1.4
(e) Hit Ratio
1.1
(b) Response Time Standard Deviation
6 Channel Utilization
96 94 CPU Utilization
0.2
(d) Percentage CPU Overhead
1.1
92 90 88
5 4 3 2
86
1
84 0 0
82 80 0.8
0.85
0.9
0.95 Mean Arrival Rate
1
1.05
0.4
0.6 0.8 1 Mean Arrival Rate
1.2
1.4
1.6
(f) Channel Utilization in Terms of Mean Number of Messages in Channel
1.1
(c) CPU Utilization
50 A AM AMT
45 40 35 Remote Execution %
At high system load, most of the nodes are potential senders and few are potential receivers. An initial high rate of failure of sender-initiated probings results in the removal of entries in RLists. Eventually sender-initiated probings are prevented because there is no entry in RLists. At low system load, most of the nodes are potential receivers and few are senders. A sender has no problem in locating a receiver. Most of the receiver-initiated probings are failed however. This does not have an adverse e�ect on the system performance because there is spare processing capacity for the failure. Also, the failed receiver-initiated probings have the positive e�ect of updating the RLists of the probed nodes. Tasks relocations occur most frequently in medium load. This accounts for the high channel utilization because task transfer messages are longer than probe messages.
0.2
30 25 20 15 10 5 0 0
0.2
0.4
0.6 0.8 1 Mean Arrival Rate
1.2
(g) Remote Execution Percentage
1.4
1.6
Figure 2: Comparison of system performance of different load balancing algorithms. Qo = 30, �� = 2:0, Tcpu = 0:2, probe-limit = 5
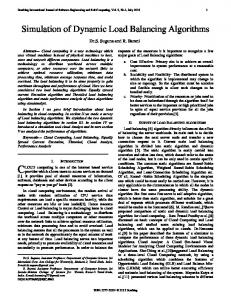
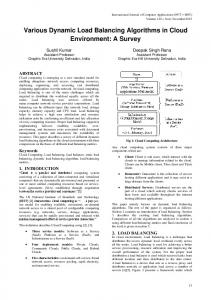
E�ect of Imbalance Factor: Figure 3 shows the e�ect of imbalance factor on
Imbalance Factor=0.01 Imbalance Factor=0.50 Imbalance Factor=1.00 Imbalance Factor=2.00 Imbalance Factor=3.00 Imbalance Factor=5.00
60
50 Remote Execution %
the performance of algorithms A and AMT . It can be seen that for a system with small imbalance factor (0.50), the di�erence in performance between the two algorithms is small. The di�erence progressively enlarges with larger imbalance factors. The primary reason behind this observation is that for a system with large imbalance factor, there is more room for a sender to transfer tasks to. This is shown in Figure 4. Algorithm AMT can make better use of this by introducing more task relocations as migrations. We can conclude that for a highly imbalanced system, task migration can provide extra performance improvement.
70
40
30
20
10
0 0
0.2
0.4
0.6 0.8 1 Mean Arrival Rate
1.2
1.4
1.6
(a) Algorithm A 70
Imbalance Factor=0.01 Imbalance Factor=0.50 Imbalance Factor=1.00 Imbalance Factor=2.00 Imbalance Factor=3.00 Imbalance Factor=5.00
1 A AM
60
50 Remote Execution %
Performance Ratio
0.8
0.6
0.4
40
30
20 0.2 10 0 0 0
-0.2 0
0.2
0.4
0.6 0.8 1 Mean Arrival Rate
1.2
1.4
1.6
(a) Imbalance Factor = 0.50
0.2
0.4
0.6 0.8 1 Mean Arrival Rate
1.2
1.4
1.6
(b) Algorithm AMT
1 A AM
Figure 4: E�ect of imbalance factor on remote execution percentage on algorithms A and AMT
Performance Ratio
0.8
0.6
be injected into the network and unnecessary CPU overhead. The di�erence diminishs at high system load because the e�ect of the receiver-timeout mechanism is lost at high system load. From Figure 5, the optimal receiver-timeout is 3.
0.4
0.2
4.2 Uneven Task Service Time
0
-0.2 0
0.2
0.4
0.6 0.8 1 Mean Arrival Rate
1.2
1.4
1.6
(b) Imbalance Factor = 3.00
Figure 3: Comparison of performance between A and
AMT under di�erent imbalance factor
E�ect of receiver-timeout: Figure 5 shows the e�ect of receiver-timeout on the
performance of algorithm AMT . It can be seen that a small receiver-timeout value does not result in signi cantly better response time than a large value. In fact, a too small value (in our case 1) may result in poorer system performance as shown in Figure 5(a). With di�erent receiver-timeout values, the di�erence in communication overhead re ected as channel utilization is signi cant, until the system is saturated (at arrival rate 0.9), Figure 5(b). This can be explained as follows. At low system load, the probability that a receiver nds a sender successfully is low. A small receiver-timeout value results in frequent probe sessions. Most of them fails, thus causing many unnecessary probe messages to
Results presented in the previous section assumes that all nodes have the same mean task service time. However, there may be situations in which a few nodes generate \long" tasks while the rest generate \normal" tasks. We therefore run a number of simulations to study the system performance under such situations. To do so, we de ne six di�erent node types to characterize the load pattern of a node. The node type de nitions are given in Table 2. Each node type is de ned by its mean task service time and its mean task arrival rate. For example, a node which generates long tasks in low rate is denotes as \Long-Low", a node which generates normal tasks in medium rate is denoted as \Normal-Medium", and so on. Table 3 de nes di�erent system types by specifying the component node types and their numbers. In all system types de ned, there are ve nodes that generate long tasks and 25 nodes that generate normal tasks. We label the system type by specifying the arrival rate of these two kinds of nodes. For example, a system in which the long task nodes have low arrival rate and the normal task nodes have medium arrival rate is labeled as LM; a system in
Table 3: System Type De nition - Uneven Loading
30 Receiver Timeout = 01 Receiver Timeout = 03 Receiver Timeout = 05 Receiver Timeout = 10
Response Time
25
20
15
10
5 0.6
0.7
0.8 0.9 Mean Arrival Rate
1
1.1
(a) Response Time 16 Receiver Timeout = 01 Receiver Timeout = 03 Receiver Timeout = 05 Receiver Timeout = 10
14
Channel Utilization
12 10 8 6 4 2 0 0
0.2
0.4
0.6 0.8 1 Mean Arrival Rate
1.2
1.4
1.6
(b) Channel Utilization in Terms of Mean Number of Messages in Channel
Figure 5: E�ect of receiver-timeout on performance of AMT which both types of nodes have high arrival rate is labeled as HH; and so on. Table 4{6 shows that the performance of algorithms AM (but not AMT ) is marginallybetter than algorithm A for a system consisting of a few nodes that generate long task in low arrival rate, whereas other nodes have low to medium load. Table 7 shows that algorithms AM and AMT have a performance improvement of about 24% over algorithm A. Table 8 shows an even larger performance improvement of about 30%. From these, we can conclude that for a system which consists of a few long task nodes at low to medium load while the other nodes are not heavily loaded, algorithm AM has performance advantage over algorithm A. In system MM for example, the probability that the ve Long-Low nodes become heavily loaded is high because it takes Table 2: Node Type De nition Node Type Task Service Time Long-Low 10 Long-Medium 10 Long-High 10 Normal-Low 1 Normal-Medium 1 Normal-High 1
Arrival Rate 0.20 0.60 0.95 0.20 0.60 0.95
System Type Node Type LL Long-Low Normal-Low LM Long-Low Normal-Medium LH Long-Low Normal-High ML Long-Medium Normal-Low MM Long-Medium Normal-Medium MH Long-Medium Normal-High HL Long-High Normal-Low HM Long-High Normal-Medium HH Long-High Normal-High
Number 5 25 5 25 5 25 5 25 5 25 5 25 5 25 5 25 5 25
a relatively long time to nish a long task. However, their assignment queue may be empty. If this is the case, these heavily loaded nodes do not have appropriate candidates for assignment. With algorithm A, potential receivers have no way to share their workload. With algorithms AM or AMT , the workload can be shared by migrating the executing tasks from the Long-Low nodes to the potential receivers. This accounts for the higher CPU utilization and remote execution percentage. As the load of normal task nodes increases, the probability that they become a potential receiver diminishes. By the time a receiver-initiated probing arrives at a long task node, the node may have accumulated enough workload that tasks are waiting in its task queue. In such case, assignment takes place rather than migration. This explains why when the normal tasks nodes have high arrival rates, algorithms AM or AMT do not perform better than algorithm A.
5 Conclusion
In this paper, three load balancing algorithms are studied. The algorithms share the same information policy and location policy. They di�er in the transfer policy. We found that the algorithms which employ both task assignment and migration perform significantly better than the one which only allows task assignment over the whole range of system load. We can conclude that although task migration usually costs more than task assignment, under some situations it can augment task assignment to provide extra performance improvement. This is because task migration provides an alternate mechanism for distributing workload in a distributed system. The performance improvement by using this approach is especially signi cant when a heavily-loaded node has no appropriate tasks for assignment.
References
[1] Wesley W. Chu and Lance M. T. Lan. \Task Allocation and Precedence Relations for Distributed Real-Time Systems". IEEE Transactions on Computers, C-36(6), June 1987.
Table 4: LL System Performance
LB Alg. A AM AMT LB Alg. A AM AMT
Response % CPU % CPU Time Util. Overhead 10.77 34.59 1.531 10.64 34.59 1.540 12.89 36.49 3.467 % % HitAssignment Migration Ratio 0.599 � 0.003 0.348 0.260 0.002 1.255 0.622 0.004
LB Alg. A AM AMT LB Alg. A AM AMT
Response % CPU % CPU Time Util. Overhead 6.01 69.90 3.586 5.98 69.93 3.619 6.31 70.84 4.552 % % HitAssignment Migration Ratio 0.696 � 0.004 0.503 0.213 0.003 0.668 0.256 0.004
LB Alg. A AM AMT LB Alg. A AM AMT
Response % CPU % CPU Time Util. Overhead 10.58 99.51 4.101 10.61 99.54 4.143 11.27 99.64 4.234 % % HitAssignment Migration Ratio 1.126 � 0.009 0.953 0.304 0.008 0.957 0.355 0.008
LB Alg. A AM AMT LB Alg. A AM AMT
Response % CPU % CPU Time Util. Overhead 23.33 68.20 2.183 17.72 68.78 2.638 17.33 70.26 4.104 % % HitAssignment Migration Ratio 26.533 � 0.130 17.386 10.584 0.099 20.460 8.208 0.068
LB Alg. A AM AMT LB Alg. A AM AMT
% Remote Exec. 0.599 0.609 1.877 Channel Util. 2.339 2.345 5.275
Table 5: LM System Performance
% Remote Exec. 0.696 0.716 0.923 Channel Util. 5.476 5.511 6.929
Table 6: LH System Performance
% Remote Exec. 1.126 1.258 1.312 Channel Util. 6.246 6.270 6.402
Table 7: ML System Performance
% Remote Exec. 26.533 27.971 28.668 Channel Util. 3.130 3.362 5.702
Table 8: MM System Performance Response % CPU % CPU Time Util. Overhead 40.81 98.39 2.300 28.25 99.42 0.955 28.76 99.41 0.985 % % HitAssignment Migration Ratio 10.713 � 0.104 7.041 4.271 0.278 6.961 4.489 0.275
% Remote Exec. 10.713 11.312 11.450 Channel Util. 3.329 0.847 0.861
[2] D. L. Eager and E. D. Lazowska. \A Comparison of Receiver-Initiated and Sender-Initiated Adaptive Load Sharing". Performance Evaluation, 6:53{68, 1986. [3] D. L. Eager and E. D. Lazowska. \Adaptive Load Sharing in Homogeneous Distributed Systems". IEEE Transactions on Software Engineering, SE-12(5), May 1986. [4] O. Kremien and J. Kramer. \Methodical Analysis of Adaptive Load Sharing Algorithms". IEEE Transactions on Parallel and Distributed Systems, 3(6):747{760, November 1992. [5] L. M. Ni, C. W. Xu, and T. B. Gendreau. \Drafting Algorithm - A Dynamic Process Migration Protocol for Distributed Systems". In Proceedings, the 5th International Conference on Distributed Computing Systems, pages 539{ 546. IEEE, 1985. [6] L. M. Ni, C. W. Xu, and T. B. Gendreau. \Load Balancing from a UNIX Shell". In Proceedings, the 13th Conference on Local Computer Networks, October 1988. [7] N. G. Shivaratri and P. Krueger. \Two Adaptive Location Policies for Global Scheduling Algorithms". In Proceedings, The 10th International Conference on Distributed Computing Systems, pages 502{509, May 1990. [8] N. G. Shivaratri, P. Krueger, and M. Singhal. \Load Distributing for Locally Distributed Systems". IEEE Computer, pages 33{44, December 1992. [9] Jonathan M. Smith. \A Survey of Process Migration Mechanisms". Operating Systems Review, 22(3):28{40, July 1988. [10] John A. Stankovic and Inderjit S. Sidhu. \An Adaptive Bidding Algorithm for Processes, Clusters, and Distributed Groups". In Proceedings, The 4th International Conference on Distributed Computing Systems, pages 13{18, May 1984. [11] Marvin M. Theimer and Keith A. Lantz. \Finding Idle Machines in a Workstation-Based Distributed Systems". IEEE Transactions on Software Engineering, 15(11), November 1989. [12] S. Zhou. \A Trace-Driven Simulation Study of Dynamic Load Balancing". IEEE Transactions on Software Engineering, 14(9):1327{ 1341, September 1988. [13] S. Zhou and D. Ferrari. \A Measurement Study of Load Balancing Performance". In Proceedings, The 7th International Conference of Distributed Computing Systems, pages 490{497. IEEE, 1987.