Behavior Research Methods, Instruments, & Computers 1995,27 (1), I-II
A pointing technique for rapidly collecting localization responses in auditory research ROBERT H, GILKEY ALICFBA, Wright-Patterson Air Force Base, Ohio and Wright State University, Dayton, Ohio MICHAEL D, GOOD Wright State University, Dayton, Ohio MARK A. ERICSON ALlCFBA, Wright-Patterson Air Force Base, Ohio JOHN BRINKMAN Systems Research Laboratories, Inc., Dayton, Ohio and JOHN M. STEWART Wright State University, Dayton, Ohio Atechnique is described for rapidly collecting responses in auditory-localization experiments. Subjects indicate the perceived direction of the sound by pointing at a 20-cm-diam spherical model. In Experiment 1, the subjects judged the direction of a broadband signal, which could originate from any of 239 directions ranging through 3600 of azimuth and between -45 0 and +900 of elevation, Using this technique, the subjects responded 2-8 times more rapidly than previous subjects who used either a verbal-reporting technique or a head-pointing technique. Localization judgments were as accurate as they had been with verbal reports, but were not as accurate as judgments collected using the head-pointing technique. In Experiment 2, the signal was turned off and the experimenter read the spherical coordinates of the signal location to the subjects, The subjects pointed to these coordinates more accurately than they had judged the direction of the sounds in Experiment 1, suggesting that the response technique had not been the limiting factor in that experiment. Circumstances relevant to the choice of response techniques for auditory-localization experiments are discussed, There has been a recent resurgence of interest in the phenomena of human sound localization (e.g., Butler, 1987; Doll, Gerth, Engelman, & Folds, 1986; Makous & Middlebrooks, 1990; Middlebrooks & Green, 1991; Musicant & Butler, 1984; Oldfield & Parker, 1984a, 1984b; Wightman & Kistler, 1989a, 1989b). The need for further
This work was supported by Grant AFOSR-91-0289 from the Air Force Office of Scientific Research. Additional support was provided by the Armstrong Laboratory, Crew Systems Directorate, Bioengineering and Biodynamics Division, Bioacoustics and Biocornmunicalion Branch; the National Institute of Deafness and Other Communicative Disorders (DC-00786); and Wright State University. We thank Christine Good, Melinda McGuire, Jason Yow, Larry Jacknin, and William D'Angelo for their assistance with this project; Frederic Wightman and Doris Kistler for allowing us to use their raw data; and Janet Weisenberger, Daniel Weber, Doris Kistler, and an anonymous reviewer for reading and commenting on an earlier version of the manuscript. M.D.G. is now at Ford Motor Company, Dearborn, Ml. M.A.E. is now at the Department of Speech and Hearing Science, Ohio State University. lB. is now at Automation Technology, Inc., Dayton, OH. Correspondence concerning this article should be addressed to R. H. Gilkey, Department of Psychology, Wright State University, Dayton, OH 45435 (e-mail:
[email protected]).
research was sparked by the realization that traditional models of sound localization, based solely on interaural differences in stimulation, are inadequate to explain the observed phenomenology, such as vertical localization and the perceived externalization of sound sources. In addition, the development of three-dimensional virtual auditory displays (e.g., McKinley & Ericson, 1989; Wenzel, Wightman, & Foster, 1988) has created the need for a more detailed specification of the sound-localization abilities of human observers in various applied settings. The effective rate of data collection for the field as a whole limits the speed and efficiency with which our understanding of sound localization can develop. In most experiments, the subject must report the perceived direction of the sound source on every trial. This type of response is complicated in comparison with the binary responses that are collected with most psychophysical procedures. With currently available techniques, localizationjudgments are collected at very slow rates. Wightman and Kistler (Kistler & Wightman, 1992; Wightman & Kistler, 1989b; Wightman & Kistler, 1992) required their subjects to report verbally the spherical coordinates
Copyright 1995 Psychonomic Society, Inc.
2
GILKEY, GOOD, ERICSON, BRINKMAN, AND STEWART
that corresponded to the perceived direction of the sound.' For example, a subject might call out the coordinates "minus 45, 30," indicating that the sound came from 45° to the left of the subject and from 30° above the horizontal plane. On each trial, the experimenter recorded the judgment by typing these coordinates into a computer. Using this technique, Wightman and Kistler (l989b) were able to collect 2-3 judgments per min. Makous and Middlebrooks (1990) used a head-pointing technique. In their "open-loop" condition, the subjects held their heads still during the sound presentation, and then turned their heads to point their noses in the direction from which they believed the sound had been presented. The position ofthe subject's head was monitored using a Polhemus Isotrak head-tracker. With this technique, Makous and Middlebrooks were able to collect approximately 3--4 localization judgments per min. The speed of trial presentation in these experiments was also limited by other factors, such as the stimulus duration and the need to move speakers between trials. Nevertheless, it is clear that these response techniques can be quite time consuming. Because performance typically needs to be measured for each of a few hundred sound-source locations, more judgments are required from each subject under each experimental condition in a sound-localization experiment than would be the case in most psychophysical studies. Thus, considerable time and effort is required to complete even simple experiments. With breaks, somewhere between 150 and 300 responses can be expected in a 2-h session using techniques such as those employed by Wightman and Kistler (l989b) and Makous and Middlebrooks (1990). If, for example, the experimental design required 10 responses to be collected under a single condition from each of225 speaker locations, data for four subjects could be collected in about two weeks, running 8 h per day (2 h per subject), 5 days per week. The duration of an experiment with a modest 3 X 3 factorial design would extend well beyond a single academic semester. Our own research questions have often suggested experiments with factorial designs, and it therefore became critical to find procedures that would yield data at higher rates. It was not possible to run multiple subjects using our apparatus, nor was it financially feasible to reproduce the apparatus. Because we were uncertain a priori about the types oflocalization errors we would encounter, significantly reducing the number of speaker locations did not seem advisable. We therefore sought a procedure that would increase the number of responses that a single subject could produce per min. The God's eye localization pointing (GELP) technique reported here has proven to be quite effective. Using this technique, subjects can produce accurate responses at much higher rates than they could with previous procedures. VALIDATION EXPERIMENTS
The GELP technique is quite simple in strategy: the subject indicates the perceived direction of the sound by
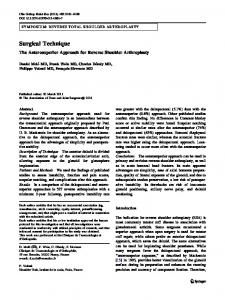
pointing at a 20-cm-diam spherical model of auditory space. Thus, rather than using an egocentric frame of reference to point from or to determine spherical coordinates, the subject responds using a "God's-eye" frame of reference. There was some concern that this change in frame of reference might be difficult for the subjects. However, the subjects report that the translation is quite easy and natural. Their data indicate that they can map spatial locations onto this model rapidly and accurately. Two experiments were performed to validate the GELP technique. Experiment I was designed to determine its effectiveness as a response technique in a simple sound-localization experiment. On each trial, a broadband click train was presented from a randomly chosen location around the subject. The subject used the GELP technique to indicate the perceived direction of the sound. The results of this experiment were compared with those of similar experiments in the literature that had used different response techniques. At least two possible sources of variability could influence the localization judgments from Experiment 1: (1) variability in the subject's perception of the stimulus location; and (2) variability in the motor response. The second experiment was designed to estimate the variability inherent to the motor response. On each trial of Experiment 2, the experimenter read a pair of spherical coordinates to the subject, whose task was to point to the location on the spherical model that corresponded to these coordinates. The results of Experiment 2 were compared with those of Experiment 1. EXPERIMENT 1 Method Subjects. Two males and one female served as subjects. Their ages ranged from 22 to 25 years. They all had clinically normal hearing and had participated in previous free-field listening experiments. They received several thousand practice trials using the GELP technique before data collection began. Subject M.G. is one of the authors. Apparatus. The Auditory Localization Facility of the Armstrong Laboratory at Wright-Patterson Air Force Base is housed in a large anechoic chamber with 1.1-m fiberglass wedges. The internal dimensions of the chamber are approximately 6.7 X 6.7 X 6.7 m from wedge tip to wedge tip. The facility includes a 4.3-mdiam geodesic sphere with 272 Bose 4.5-in. Helical-Voice-Coil, full-range drivers (Model 118038) mounted at the vertices of the sphere. An additional five drivers are mounted on the surface of the sphere, one directly in front of the subject (0° azimuth, 0° elevation), one directly to the subject's left ( - 90° azimuth, 0° elevation), one directly to the subject's right (90° azimuth, 0° elevation), one directly above the subject (0° azimuth, 90° elevation), and one directly behind the subject (180° azimuth, 0° elevation). The metal frame of the sphere is covered with acoustic foam to reduce sound reflections. A simple visual display, consisting of IS light-emitting diodes (LEDs), mounted on the surface of the sphere directly in front of the subject, is used to provide information to the subject about the trial timing. Implementation. Figure I shows a subject in our apparatus. The subject is positioned with her head in the center of the geodesic sphere of 277 speakers, and straddles an 81 X 30-cm padded bench attached to an 87 X 60-cm platform. A bite bar is mounted on the end ofa PVC tube that protrudes vertically through the bench. The height of the platform and the length of the PVC tube are both
AUDITORY-LOCALIZATION POINTING TECHNIQUE
3
Figure 1. A subject using the GELP technique.
adjustable, so that subject comfort is maintained, while assuring that the subject's head is positioned in the center of the sphere. The spherical model is attached to the top ofa second PVC tube 22 em in front of the first tube. The model is plastic and approximately 20 ern in diam. The center of the model is 31 cm above the bench and approximately (depending on the height ofthe subject) 50 em below the subject's ears. The subject's task on each trial is to position the tip of a Polhemus stylus (Mode14A031 0-OX)2at a point on the surface of the spherical model, such that a vector from the center ofthe sphere to the stylus tip points in the same direction as a vector from the center of the subject's head to the perceived location ofthe sound source. The stylus is connected to a Polhemus Fastrak (ModeI4A0316-0 1). The transmitter (Model 3A0369-03) for the Fastrak is mounted on a wood block directly below the model. Houselights in the chamber are kept on during the experimental sessions, and the subjects are not blindfolded. However, because the subjects hold the bite bar during the experiment, their view of the model is somewhat limited. Therefore, three great circles are etched on the surface of the spherical model, corresponding to the horizontal, frontal, and median planes. The subject can feel these lines and use them as a guide. Thus, we expect that the subjects can, and possibly do, complete this task without vision. When the tip of the stylus is positioned at the desired location, the subject depresses a foot-switch to record his/her judgment.
The Fastrak is connected to the serial-communications port of an 80486-based personal computer. When the foot-switch is depressed, the software on the computer sends a query to the Fastrak, which returns coordinates indicating the current position and orientation of the stylus. The software ignores the orientation coordinates and translates thex-,y-, z-coordinates of the stylus tip into spherical coordinates relative to the center of the spherical modeJ.3 If the radius is greater than lOA em, the tip of the stylus is deemed to be too far from the surface of the sphere (as ifthe subject had accidentally depressed the foot-switch at the wrong moment), and the judgment is discarded. Otherwise, the azimuth and elevation are stored as the subject's judgment. As currently implemented, this procedure does not allow the subject to reenter a discarded response or to correct an incorrectly entered response. Although neither of these problems seemed to occur frequently, the former problem could be corrected by merely waiting for a response within the lOA-em radius, and the latter problem could be solved by using a second foot-switch. Procedure. On each trial, the signal location was randomly chosen from a pool of 239 possible speaker locations. The pool of speakers included azimuths that completely surrounded the subject, but elevations were limited to values between -45° and +90°. The angular separation of any speaker from its nearest neighboring speaker ranged from 8° to 15°.
4
GILKEY, GOOD, ERICSON, BRINKMAN, AND STEWART
The target signal was a train of25-,usec pulses repeated at a 100Hz repetition rate. The signal was windowed with 25-msec cosramps to have a duration of268 msec at the half-power points, and was played through a l6-bit digital-to-analog converter (TuckerDavis Technologies Model DO 1). The analog waveform was then passed through a 20-kHz lowpass antialiasing filter (Tucker-Davis Technologies Model FT5-l1) and bandpass filtered from .53 to 11.0 kHz (Krohn-Hite Model 3700). Each trial began with a 100-msec warning light (a single red LED on the display), followed, after a 200-msec pause, by the observation interval, during which the signal was presented. To mark the observation interval, a row of four LEOs was illuminated for 300 msec, beginning 66 msec before the signal onset. After the observation interval, the subjects were allowed to take as long as they needed to indicate the perceived direction of the signal, using the GELP technique. A row of three yellow LEOs was illuminated for 150 msec to inform the subjects that their judgments had been recorded. No feedback was provided concerning the accuracy of this judgment. After a 200-msec pause, the next trial began. During each block, 50-65 trials were presented. Data were collected in sets of five blocks, with a l-2-min break between blocks within a set and a 1O-minbreak between sets. Within each experimental session, 3-4 sets of blocks were presented. Each session lasted approximately 1.5-2 h. Data analysis. During the course of the experiment, 8 localization judgments were recorded in response to signals from each speaker location. To allow comparison of our data with those of Wightman and Kistler (1989b), the judgment centroid, the average angle oferror, and IC I were computed for each location. The judgment centroid is computed as the average of all of the judgment vectors for a specific target location, where the judgment vector is the vector from the center ofthe spherical model to the position indicated by the GELP technique. The average angle of error is computed for each target location and is the mean of the unsigned angles between the judgment vectors and the target vector (the vector from the center of the spherical model to the point on the surface corresponding to the location of the speaker). ICI is a measure of dispersion of the judgments and compares the magnitude of the vector that results from summing all ofthe judgment vectors for a particular target location with the maximum possible resultant. An unbiased estimate of IC I for the unit sphere is provided by /(-1 =
N(N-R) (N-l)2 '
where N is the number of judgments and R is the length of the resultant vector (Fisher, Lewis, & Embleton, 1987, pp. 129-130). In keeping with the procedures of Wightman and Kistler, all frontback reversals are resolved before these statistics are computed (i.e., if the target vector is in the frontal hemisphere and the judgment vector is in the rear hemisphere, the response azimuth is reflected through the frontal plane to the corresponding azimuth in the frontal hemisphere; the opposite operation is performed when the target vector is in the rear hemisphere and the judgment vector is in the frontal hemisphere). We also computed horizontal and vertical errors in the manner employed by Makous and Middlebrooks (1990). The vertical error is simply the difference between the judgment and target elevations when represented as spherical coordinates. The horizontal error is the angle between the target vector and the vector from the center of the sphere to a point on the surface of the sphere whose longitude is equal to the judgment longitude, but whose latitude corresponds to the target latitude. In keeping with the procedures of Makous and Middlebrooks, judgments that represented frontback reversals were eliminated from the data set before these measures were computed.
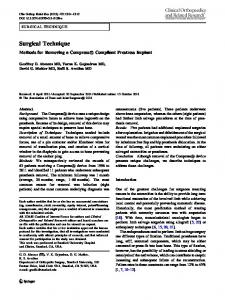
Results A major motivation for this project was the need to develop a technique that would allow subjects to produce localization judgments more rapidly. Wightman and Kistler (1989b) reported that 2-3 judgments could be collected per minute with the verbal-reporting technique. Makous and Middlebrooks (1990) were able to collect 3--4judgments per minute using the head-pointing technique. Our subjects were able to produce 16-20 judgments per minute using the GELP technique, a substantial increase in speed." Figures 2 and 3 compare our data with those of Wightman and Kistler (1989b). On each trial, Wightman and Kistler presented eight 250-msec bursts ofGaussian noise separated by 300-msec periods ofsilence. The noise was bandpass filtered from .2-14.0 kHz. The energy spectrum of each noise sample was scrambled (i.e., the energy in each critical band was separately randomized over a 20-dB range). Wightman and Kistler presented stimuli from 72 speaker locations selected from a set of 144 possible locations, which ranged through 360° of azimuth and from - 36° to +54° of elevation. Their subjects wore blindfolds during the experiment. Figure 2 plots the azimuth component of the judgment centroid as a function of the actual azimuth of the target. The top three panels show data for our three subjects, and the bottom two panels show data for two ofthe subjects of Wightman and Kistler (1989b). The overall localization performance of Subject S.D.a. (bottom left panel) was as good as or better than that of most of Wightman and Kistler's subjects, whereas the overall localization performance of Subject S.D.E. (bottom right panel) was worse than that ofmost oftheir subjects. Because Wightman and Kistler only presented elevations between - 36° and +54°, the data shown in the top three panels of this figure have also been limited to this range. Note that ideal performance is represented by the positive slope diagonal. Table 1 shows the slope and intercept of the lines that result from the regression of azimuth coordinates of the judgment centroids on the actual azimuths. The proportion of variance accounted for by the relation is also shown. The value ofr 2 is greater than .98 for each subject. As can be seen, the performance of our subjects is good, and is similar to the performance obtained by Wightman and Kistler with the verbal-reporting technique. Figure 3 plots the elevation component of the subjects' judgment centroids as a function of the actual elevation ofthe target. As in Figure 2, the top three panels show the results for our three subjects, and the bottom two panels show the results for the same two subjects from Wightman and Kistler (1989b). Values of slope, intercept, and r 2 are shown in Table 1. When compared with the azimuthjudgments, the subjects' elevation judgments show more spread around the best-fitting line (values ofr 2 for our subjects range from .75 to .83). Moreover, the slopes are all less than 1.0 deg/deg (slopes range from 0.67 to 0.77 deg/deg), and the intercepts are all greater than 0.0° (intercepts range from 2.1° to 11.3°). This pattern ofre-
AUDITORY-LOCALIZATION POINTING TECHNIQUE
o
_cD
e,,-
5
SUB: Me
SUB: CG
W
o
-0
::I: en
5
~o
~
00 Wen e,,1
o
:::>0 ...,~
I
-180
o
-90
180 -180
90
o
-90
180 -180
90
o
-90
90
180
SUB: SDE
SUB: SOO
00 Wen e,,1
o
:::>0 ...,~
I
-180
-90
0
90
180 -180
TARGET AZIMUTH (DEG)
-90
0
90
180
TARGET AZIMUTH (DEG)
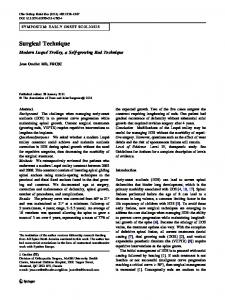
Figure 2. Judgment centroids for the sound-localization condition of Experiment 1. The azimuth coordinate ofthe judgment centroid for each target location is plotted as a function of the azimuth ofthe target. The top three panels show data for each ofthe three subjects in the present experiment. The bottom two panels show data for two ofthe subjects of Wightman and Kistler (1989b; the left panel shows data from a subject whose performance was better than, and the right panel shows data from a subject whose performance was worse than, that of most oftheir subjects). The centroids in the top panels are based on 8 judgments at each speaker location; those in the bottom panels are based on either 6 or 12 judgments at each speaker location. Front-back reversals have been resolved.
suits is similar to that observed for the subjects ofWightman and Kistler, except that their Subject S.D.O. shows a slope greater than 1.0. Note also that most of Wightman and Kistler's other subjects showed slopes closer to 1.0 than did Subject S.D.E. or any of our subjects. Table 1 also shows median values (across speaker locations) of the average angle of error and IC I. The average angle of error is influenced both by the variability of the judgment vectors and by any systematic bias; IC I, on the other hand, is determined by the dispersion of the judgment vectors, and is less influenced by systematic bias in the judgments (in both cases, smaller values indicate more accurate performance). Median values of average angle of error and /(-1 observed for our subjects are comparable to, or smaller than, those observed for the subjects of Wightman and Kistler (1989b). Makous and Middlebrooks (1990) used a head-pointing procedure, in which their subjects were to point their noses in the perceived direction of the sound source. On each
trial, two 150-msec bursts of reproducible noise were presented. An inverse filter was used to assure a flat amplitude spectrum for the noise at the output of each speaker, within the 1.8- to 16.0-kHz passband of the noise; a single pseudorandom phase spectrum was used for all presentations. The first noise was presented from directly in front of the subjects, at 0° elevation, and the subjects used this to "center" their heads. The second stimulus was the target; the subjects' task was to point their noses in the perceived direction of this sound. Makous and Middlebrooks presented sounds from 249 speaker locations that ranged in azimuth from -170° to + 170° and in elevation from -45° to +55°. Their experimental sessions were conducted in the dark. Makous and Middlebrooks (1990) reported substantially smaller localization errors than Wightman and Kistler (l989b). Table 2 compares the localization errors reported by Makous and Middlebrooks with the localization errors observed in Experiment 1. For this analysis,
6
GILKEY, GOOD, ERICSON, BRINKMAN, AND STEWART
SUB: CG
SUB: MG
0
(3i
30
60
90
-60
-30
SUB: JY
0
SUB: SOO
30
60
90
-60 -30
0
30
60
90
SUB: SOE
IJJ
C
-0
ZUl 0
->
.Z
z;J>~
Z
;:0
-
ttl
.Z
0
rJ)
o
;:0
-
rn
.0
0 0
a
.>-