Michigan State University. East Lansing MI USA 48824 ...... http://www.biometrics.org:8080/ â¼BC/ REPORTS/ INSPASS.html,. 1996. [11] âHaSIS. -. A. Hand.
A Prototype Hand Geometry-based Verification System Arun Ross Department of Computer Science and Engineering Michigan State University East Lansing MI USA 48824 Abstract Geometric measurements of the human hand have been used for identity authentication in a number of commercial systems. In this project we have developed a protoype hand geometry-based verification system and analyzed it’s performance. We have demonstrated the practical utility of this system by designing an application that uses hand geometry as opposed to password for restricting access to a web site. We present our preliminary verification results based on hand measurements of 50 individuals captured over a period of time.
1
Introduction
Associating an identity with an individual is called personal identification. The problem of resolving the identity of a person can be categorized into two fundamentally distinct types of problems with different inherent complexities: (i) verification and (ii) identification. Verification (authentication) refers to the problem of confirming or denying a person’s claimed identity (“Am I who I claim I am?”). Identification (“Who am I?”) refers to the problem of establishing a subject’s identity. Biometrics involves identifying an individual based on his physiological or behavioral traits. The practical utility of biometrics-based identification is well established, as many systems require some sort of reliable user identification for servicing requests (e.g., ATM booths, cellular phones and laptop
computers). Various biometric techniques have been described in the literature and many of them are being used for real-time authentication, the most popular ones being fingerprint identification and face recognition. Other biometrics that have resulted in commercial systems include iris scan, speech, retinal scan, facial thermograms and hand geometry. In this project we describe a verification system that uses the geometry of a person’s hand to authenticate his identity. We present two techniques for computing the various features. The first technique , known as the parameter estimation technique is invariant to the lighting conditions of the device, presence of noise and the color of the skin. The second technique, known as the windowing technique employs a heuristic approach for computing the hand features. We also describe a web-application that uses hand geometry for user-authentication purposes. Experiments and results based on the stand-alone hand geometry application and the web-application are presented.
2
Why Hand Geometry?
What is the most effective biometric measurement? There is no ideal biometric measurement; each biometrics has its strengths and limitations, and accordingly each biometric appeals to a particular identification (authentication) application. Suitability of a particular biometric to a specific application depends upon several factors [8]; among these factors, the user acceptability seems to be the most significant. For many access control applications, like immigration, border control and dormitory meal plan access, very distinctive biometrics, e.g., fingerprint and iris, may not be acceptable for the sake of protecting an individual’s privacy. In such situations, it is desirable that the given biometric indicator be only distinctive enough for verification but not for identification. As hand geometry information is not very distinctive, it is one of the biometrics of choice in applications like those mentioned above. Hand geometry-based authentication is also very effective for various other reasons. Almost all of the working population have hands and exception processing for people with disabilities could be easily engineered [9]. Hand geometry measurements are easily collectible due to both the dexterity of the hand and due to a relatively simple method of sensing which does not impose undue requirements on the imaging optics. Note that good frictional
skin is required by fingerprint imaging systems, and a special illumination setup is needed by iris or retina-based identification systems. Further, hand geometry is ideally suited for integration with other biometrics, in particular, fingerprints. For instance, an identification/verification system may use fingerprints for (infrequent) identification and use hand geometry for (frequent) verification. It is easy to conceptualize a sensing system which can simultaneously capture both fingerprints and hand geometry.
3
Background
Hand Geometry, as the name suggests, refers to the geometric structure of the hand. This structure includes width of the fingers at various locations, width of the palm, thickness of the palm, length of the fingers, etc. Although these metrics do not vary significantly across the population, they can however be used to verify the identity of an individual. Hand geometry measurement is non-intrusive and the verification involves a simple processing of the resulting features. Unlike palmprint verification methods this method does not involve extraction of detailed features of the hand (for example, wrinkles on the skin). Hand geometry-based verification systems are not new and have been available since the early 1970s. However, there is not much open literature addressing the research issues underlying hand geometry-based identity authentication; much of the literature is in the form of patents [2, 3, 4] or application-oriented description. Sidlauskas [6] discusses a 3D hand profile identification apparatus that has been used for hand geometry recognition. Authentication of identity of an individual based on a set of hand features is an important research problem. It is well known that the individual hand features themselves are not very descriptive; devising methods to combine these non-salient individual features to attain robust positive identification is a challenging pattern recognition problem in its own right. The research described here is our initial attempt to draw the attention of biometric researchers to this important yet neglected topic.
4
Image Acquisition
The image acquisition system which we have designed (inspired from [6, 9]) comprises of a light source, a camera, a single mirror and a flat surface (with
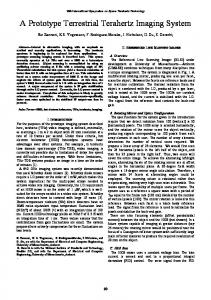
five pegs on it). The user places his hand - palm facing downwards - on the flat surface of the device. The five pegs serve as control points for appropriate placement of the right hand of the user. The device also has knobs to change the intensity of the light source and the focal length of the camera. The lone mirror projects the side-view of the user’s hand onto the camera. The device is hooked to a PC with a GUI application which provides a live visual feedback of the top-view and the side-view of the hand (Figure 1) and has the following functionality: (i) assists the user in correct positioning of the hand on the surface of the device; (ii) acquires images of the user’s hand; (iii) displays images that were captured previously; (iv) extracts features from a given image; (v) registers the user in a database along with the extracted feature vector; (vi) checks whether a given image of the hand matches any of the entries in the database; (vii) updates a particular user’s entry in the database by recomputing the feature vector. In the current prototype implementation, a 640 × 480 8-bit grayscale image of the hand is captured.
Figure 1: Hand geometry sensing device.
4.1
Enrollment Phase
This process involves one of the following two tasks: (i) add a new user to the database; (ii) update a current user’s feature vector. During the
enrollment phase, five images of the same hand are taken in succession; the user removes his hand completely from the device before every acquisition. These five images are then used to compute the feature vector of the given hand. Recomputing a feature vector simply involves averaging the individual feature values.
4.2
Verification Phase
This process involves matching a given hand to a person previously enrolled in the system. Two snapshots of the hand are taken and the “average” feature vector is computed. The given feature vector is then compared with the feature vector stored in the database associated with the claimed identity. Let F = (f1 , f2 , ..., fd ) represent the d-dimensional feature vector in the database associated with the claimed identity and Y = (y1 , y2 , ..., yd ) be the feature vector of the hand whose identity has to be verified. The verification is positive if the distance between F and Y is less than a threshold value. Four distance metrics, absolute, weighted absolute, Euclidean, and weighted Euclidean, corresponding to the following four equations were explored: d X
| yj − f j | < � a ,
(1)
j=1
d X | yj − f j | < �wa , σj j=1 v u d uX t (yj − fj )2 < �e , and
(2)
(3)
j=1
v u d uX (yj − fj )2 t < �we , 2 σ j j=1
(4)
where σj2 is the feature variance of the jth feature and �a , �wa , �e , and �we are threshold values for each respective distance metric.
5
Feature Extraction
The hand geometry-based authentication system relies on geometric invariants of a human hand. Typical features include length and width of the fingers, aspect ratio of the palm or fingers, thickness of the hand, etc. [11]. To our knowledge, the existing commercial systems do not take advantage of any non-geometric attributes of the hand, e.g., color of the skin. Figure 2 shows the 14 axes along which the various features mentioned above have been measured. The five pegs on the image serve as control points and assist in choosing these axes. The hand is represented as a vector of the measurements selected above. Since the positions of the five pegs are fixed in the image, no attempt is made to remove these pegs in the acquired images.
Figure 2: The fourteen axes along which feature values are computed. We describe the two techniques that were used to extract features from the image of the hand.
5.1
The Parameter Estimation Technique:
In order to offset the effects of background lighting, color of the skin, and noise, the following approach was devised to compute the various feature values. A sequence of pixels along a measurement axis will have an ideal gray scale profile as shown in Figure 3(a). Here Len refers to the total number of pixels considered, Ps and Pe refer to the end points within which
A2
GRAYSCALE VALUE
GRAYSCALE VALUE
the object (e.g., finger) to be measured is located, and A1, A2 and B are the gray scale values.
A1
B
Ps
Pe PIXEL NUMBER
PIXEL NUMBER
(a) The ideal profile
(b) An observed profile
Figure 3: The gray scale profile of pixels along a measurement axis. The actual gray scale profile tends to be spiky as shown in Figure 3(b). Our first step is to model the above profile. Let the pixels along a measurement axis be numbered from 1 to Len. Let X = (x1 , x2 , ..., xLen ) be the gray values of the pixels along that axis. We make the following assumptions about the profile: 1. The observed profile (Figure 3(b)) is obtained from the ideal profile (Figure 3(a)) by the addition of Gaussian noise to each of the pixels in the latter. Thus, for example, the gray level of a pixel lying between Ps and Pe is assumed to be drawn from the distribution G(x/B, σB2 )
1
exp =p 2πσB2
�
−1 (x − B)2 2 2σB
�
(5)
where σB2 is the variance of x in the interval R, Ps < R ≤ Pe . 2. The gray level of an arbitrary pixel along a particular axis is independent of the gray level of other pixels in the line. This assumption holds good because of the absence of pronounced shadows in the acquired image.
Operating under these assumptions, we can write the joint distribution of all the pixel values along a particular axis as "P s Y
�# 1 p exp − 2 (xj − A1)2 P (X/Θ) = 2 2σA1 2πσ A1 j=1 " P � �# e Y 1 1 p exp − 2 (xj − B)2 2 2σB 2πσB j=Ps +1 " Len �# � Y 1 1 p , exp − 2 (xj − A2)2 2 2σA2 2πσ A2 j=P +1 1
�
(6)
e
2 2 2 2 , σA2 , σB2 ) and σA1 , σA2 and σB2 are the where Θ = (Ps , Pe , A1, A2, B, σA1 variances of x in the three intervals [1, Ps ], [Ps + 1, Pe ] and [Pe + 1, Len], respectively. The goal now is to estimate Ps and Pe using the observed pixel values along the chosen axis. We use the Maximum Likelihood Estimate (MLE) method to estimate Θ. By taking logarithm on both sides of Eq. (6) and simplifying, we obtain the likelihood function:
Ps Pe 1 X 1 X 2 L(Θ) = 2 (xj − A1) + 2 (xj − B)2 σA1 1 σB P +1 s
+
1 2 σA2
Len X
2 (xj − A2)2 + Ps log σA1
(7)
Pe +1
2 + (Pe − Ps ) log σB2 + (Len − Pe ) log σA2
The parameters can now be estimated iteratively; the parameter estimates at the (k + 1)st stage, given the observation X = (x1 , x2 , ..., xLen ), are given below.
c Ps
c Pe
(k+1)
(k+1)
(k) c (k) , A2 c (k) , Ps , c Pe , A1 = arg min L (k) (k) (k) Ps d 2 d 2 b (k) , σ B ,σ , σc2 A1 (k+1)
A2 (k)
B (k)
A2
B
c , A2 c , c , Pe , A1 Ps = arg min L (k) (k) (k) Pe d 2 d 2 b (k) , σ , σc2 ,σ B
b (k+1) = B
(k+1) 2 σc = B
c (k+1) = A1
(k+1) d 2 σ = A1
c (k+1) = A2
(k+1) d 2 σ = A2
A1
!
!
PPe (k+1)
xj +1 (k+1) c Ps
(k+1)
Ps (k+1)
c Pe − (k+1) P Pe (k+1)
Ps (k+1)
+1
x2j
(k+1) c −c Ps Pe PPe (k+1) xj 1 (k+1) c Ps PPe (k+1) 2 xj 1 (k+1) c Ps PLen Pe
Len − PLen Pe
xj +1 (k+1) c Pe
(k+1)
Len −
n (k+1) o2 c − A1
xj +1 (k+1) c Pe
(k+1)
n o2 b (k+1) ) − B
n (k+1) o2 c − A2
(8)
2 2 , B and σB2 are obtained as , A2, σA2 The initial estimates of A1, σA1 2 follows: (i) A1 and σA1 are estimated using the gray values of the first NA1 2 pixels along the axis; (ii) A2 and σA2 are estimated using the gray values of the pixels from (Len − NA2 ) to Len; (iii) B and σB2 are estimated using the gray values of the pixels between (Len/2 − NB ) and (Len/2 + NB ). The values of NA1 , NA2 and NB are fixed for the system; NA1 = 5, NA2 = 4 and NB = 5. The initial values of Ps and Pe are set to Len/2−10 and Len/2+10, respectively.
5.2
The Windowing Technique:
In the previous subsection we observed that the actual gray scale profile (G(x), 0 ≤ x < Len) tends to be spiky as shown in Figure 3(b). The goal is to locate the end points Ps and Pe from this grayscale profile. It is easy to observe from Figure 3(b) that the profile at Ps dips down sharply, while at Pe the profile straightens out after a steep climb. Such a profile was a common occurence across images and thus the points Ps and Pe may be obtained by examining the profile for such sharp changes. The following heuristic method was adopted to locate these points. A window of length wlen is moved over the profile, one pixel at a time, starting from the leftmost pixel. Let Wi , 0 ≤ i ≤ N , refer to the sequence of pixels covered by the window after the ith move, with WN indicating the final position. For each position Wi , compute four values M axvalWi , M axindexWi , M invalWi and M inindexWi as,
M axvalWi = max G(j)
(9)
M axindexWi = arg max G(j)
(10)
M invalWi = min G(j)
(11)
M inindexWi = arg min G(j)
(12)
j∈Wi
j∈Wi
j∈Wi
j∈Wi
Ps and Pe can now be obtained by locating the positions Wi where (M axvalWi −M invalWi ) is the maximum. This would indicate a sharp change in the grayscale of the profile. Ps =M axindexWk s.t.M inindexWk > M axindexWk , (M axvalWk − M invalWk ) > (M axvalWi − M invalWi ), ∀i 6= k, 0 ≤ i, k ≤ N
(13)
Pe =M axindexWk s.t.M axindexWk > M inindexWk , (M axvalWk − M invalWk ) > (M axvalWi − M invalWi ), ∀i 6= k, 0 ≤ i, k ≤ N
(14)
There was no significant difference in the performance of the system between these two techniques and we therefore present the results based only on the parameter estimation method. Figure 4 shows a hand image along with the positions of detected points (Ps and Pe ) along each of the 14 axes and the corresponding feature vector.
(a) Estimates of Ps and Pe along the 14 axes (akasapuv 65 53 59 52 62 47 47 45 255 333 253 287 243 149)
(b) The corresponding database entry
Figure 4: Computation of the feature vector.
6
Experimental Results
The hand geometry authentication system was trained and tested using a database of 50 users. Ten images of each user’s hand were captured over two sessions; in each session the background lighting of the acquisition device was changed. Thus a total of 500 images were made available. Out of 500 images, only 360 were used for testing our hand geometry system. The remaining 140 images were discarded due to incorrect placement of the hand by the
1
6
11
16
2
7
12
17
3
8
13
18
4
9
14
19
5
10
15
20
Figure 5: Chernoff Faces representing the average feature vectors of 20 different hands. user (see for example, Figure 6). Thus, user adaptation of this biometric is necessary. Two images of each user’s hand were randomly selected to compute the feature vector which is stored in the database along with the user’s name. Figure 5 [12] representing the average feature vector of shows the Chernoff faces [12] representing the average feature vector of 20 of the users. 15 hand features have been mapped to the attributes of the cartoon face as follows: 1-area of face; 2-shape of face; 3-length of nose; 4-location of mouth; 5-curve of smile; 6-width of mouth; 7, 8, 9, 10 and 11-location, separation, angle, shape and width of eyes; 12-location and width of pupil; 13 and 14 -location and angle of eyebrow. The difference between any two hand geometries as reflected in these cartoon faces appears to be significant. Eqs. (1)-(4) are used for verifying whether the feature vector of a hand matches with the feature vector stored in the database. In order to study the effectiveness of various distance metrics, the genuine and impostor distributions are plotted for matching scores obtained using each distance metric and a ROC (Receiver Operating Characteristic) curve generated from each pair of distributions. A genuine matching score is obtained by comparing two feature vectors from the same hand while an impostor matching score is obtained by comparing the feature vectors of two different hands. Let us define the hit rate to be the percentage of time the system matches a hand to the right entry in the database, and the false acceptance rate to be the percentage of time the system matches a hand to an incorrect entry in the
Figure 6: Incorrect placement of hand. database for a given threshold. The ROC that plots the hit rate against the false acceptance rate is then computed using the leave-one-out method. A feature vector in the database is matched against those feature vectors representing a different user to compute the impostor matching scores. If the matching score falls below the chosen threshold, it is considered to be a false acceptance by the system. This process is repeated for all the users in the database. A genuine matching score is obtained by matching a feature vector against those feature vectors that belong to the same user. If the matching score falls below the chosen threshold then it is considered to be a hit. The ROC shown in Figure 7 depicts the performance of the system for the absolute distance measure (Eq. 1) which gave the best result. The system performance could be significantly improved by (i) having habituated users; (ii) better registration of hand geometry measurements; and (iii) using higher level features (like color of the skin, wrinkles and folds on the skin etc.). Among these factors, registration appears to be the most critical. Even though the pegs are used for registration in our system, the registration accomplished by the pegs is not sufficiently accurate.
7
An Application: A Hand Geometry-based Web Access System
As an illustration of the potential uses of a hand geometry-based system, we present the following application that uses the geometry of a person’s hand as a ‘password’ for granting access to a secure website. Authentication and encryption are crucial to network security. Public key cryptography provides a secure way to exchange information but designing a high security auth entication system still remains an open problem. Complex passwords are easy to forget while simple passwords are easily guessed by unauthorized persons. Several of the biometric characteristics of an individual are unique and do not change over time. These properties make biometrics well suited for authentication. Authentication systems based on fingerprints, voice, iris, and hand geometry exist for applications such as passport control, forensics, automatic teller machines, driver license, and border control. With the increasing growth of the Internet, there is a need to restrict access to sensitive data on the Web to authorized users. We have developed a prototype system which uses hand geometry to authenticate users to restrict access to web pages. Initial evaluation of the prototype system is encouraging. Similar techniques can be used to authenticate people for e-commerce applications.
7.1
Motivation and Assumptions
Basic Authentication [14] is a NCSA (National Center for Supercomputing Applications) method of authentication which restricts access to HTML documents and server directories to those visitors who give a valid username and password. This feature allows webmasters to restrict access to certain directories. The usernames and encrypted passwords are kept in a webmaster-maintained file. Authentication based on passwords is susceptible to compromise by an imposter, particularly since the user need not be present at the point of authentication. Passwords can also be forgotten. Biometrics, which refers to authentication of people based on their physiological or behavioral characteristics is inherently more reliable and has a higher discrimination capability than the knowledge-based approaches (like remembering passwords), because the biometric characteristics are unique to each person. We will demonstrate that it is feasible to design a biometric-based access mechanism for the Web.
In Basic Authentication [14], the password is transmitted over the network as a “uuencoded” string rather than encrypted. So, the password can be easily decoded by someone who is able to capture the right packet. There are utilities available which can easily find such packets. More secure authentication can be provided by sending the password encrypted. A system based on biometrics must also transmit data back to the server which can be done using encryption. An even more secure method is to use a dual-key encryption system where one of the keys is derived from the sensed biometric itself. For simplicity, let us assume that the information is transmitted over the network in a secure way. The issue is to provide a more secure authentication. Our system still uses Basic Authentication [14] as provided by NCSA to restrict access to the web server directories, but uses biometrics instead of passwords for authentication. With the increasing acceptability of biometrics, we anticipate that such a facility will be integrated in the NCSA HTTPD (Hyper Text Transfer Protocol Daemon) and will become a standard.
7.2
System Design
Our system can be logically divided into two independent modules. The first module is the hand geometry-based authentication system, and the second module deals with the client-server interaction to restrict/grant access to the web. The first module has been sufficiently described in the preceding sections. We therefore describe the second module in reasonable detail in the following subsections. Figure 8 shows the client/server interaction for the enrollm ent and access of secure pages. Only one file (e.g., index.html) is allowed access in the directory. This file, when downloaded to the client side, prompts the user to provide his hand geometry for authentication. The dialog box which provides live feedback of the hand geometry is an ActiveX control which can access system resources. This control captures the hand geometry image, calculates the feature vector and sends it to the server along with other information about the user without storing it on the client’s disk. This way, transmission of the feature vector is transparent to the user and the user has to be present at the point of authentication. This information is sent to the server as a digitally signed form. Currently, a Java applet cannot access system resources, therefore, we have made use of an ActiveX control to capture the hand geometry image. Since the feature vector is sent across
the network, an imposter could listen to the channel and capture the feature vector. To avoid this, public key encryption methods should be used. Once the server has the hand geometry information about a user along with the user name, the server invokes the hand geometry authentication module to verify the user. If the authentication fails, the client is denied access to the files and this information is conveyed to the client (Figure 9 (b)). If the access is allowed (Figure 9 (a)), then the server retrieves all the filenames accessible to this user and displays them as a list. The client can then access these files by clicking on their names in the browser. The secure files do not reside in a world readable directory and hence cannot be accessed through a URL. The server reads the file the user has requested (by clicking on one of the filenames) and dynamically generates a HTML file containing the contents.
7.3
Experiments and Results
In order to evaluate the performance of this system, ten files were created in a web directory and Basic Authentication [14] was used to restrict access to this directory. Ten users were asked to evaluate the system. Seven out of the ten users were enrolled into the system. Each of the seven enrolled users was allowed to access a subset of the ten files. Over a period of three weeks, enrolled users accessed their files by providing their hand image each time. A user accessing a set of files was not aware of the existence of the other files. The users were challenged to access other files or access the files without providing their hand geometry but none of these attempts were successful. Access to the files could not be gained in any way other than providing genuine hand geometry images. Each of the enrolled user also tried to enter the system by impersonating the other six users, while the three users who were not enrolled tried to enter the system as one of the seven enrolled users. In this experiment, we operated our hand geometry system at a threshold near the knee in the curve shown in Figure 7; this threshold gives a FRR of about 15% and a FAR of about 2% on the database used in the first experiment. For the ten users in the second experiment (200 authentic trials and 200 imposter trials), a FAR of 0% and FRR of 5% was obtained.
8
Future Work
We have designed a prototype hand geometry-based verification system and presented our initial identity authentication results based on the hand-geometry measurements of 50 individuals. We have presented an end-to-end technological description of the design/implementation/evaluation of the hand geometry based authentication. We have also described an application that uses hand geometry for authentication purposes. Our ongoing work is investigating imaging set up, feature extraction, and a theoretical framework for matching. In particular, we are concentrating on the following problems: (i) The present imaging involves visible light. It would be interesting to explore the effects of infra-red imaging on the system performance. We also plan to investigate the effects of different resolutions and color planes on the system performance. (ii) The existing feature set should be extended to include 2-D features of the hand. We plan to use deformable models for a robust representation of the hand. (iii) A more extensive system performance on larger datasets collected over a period of time is necessary. (iv) Integration of hand geometry information with other biometrics, e.g., fingerprints, would require designing a new image acquisition setup. With the availability of solid-state fingerprint sensors [13], this is now feasible.
References [1] A.K. Jain, R. Bolle and S. Pankanti (Eds.), “Biometrics: Personal Identification in Networked Society”, Kluwer Academic Publishers, 1998. [2] R. P. Miller, “Finger dimension comparison identification system”, US Patent No. 3576538, 1971. [3] R. H. Ernst, “Hand ID system”, US Patent No. 3576537, 1971. [4] I. H. Jacoby, A. J. Giordano, and W. H. Fioretti, “Personnel Identification Apparatus”, US Patent No. 3648240, 1972. [5] “A Performance Evaluation of Biometric Identification Devices”, Technical Report SAND91-0276, UC-906, Sandia National Laboratories, Albuquerque, NM and Livermore, CA, 1991.
[6] D. P. Sidlauskas, “3D hand profile identification apparatus”, US Patent No. 4736203, 1988. [7] J. R. Young and H. W. Hammon, “Automatic Palmprint Verification Study”, Rome Air Development Center, RADC-TR-81-161 Final Technical Report, June 1981. [8] A. Jain, L. Hong, S. Pankanti, and R. Bolle, “On-line identityauthentication system using fingerprints,” Proceedings of IEEE, vol. 85, pp. 1365–1388, September 1997. [9] R. Zunkel, “Hand Geometry Based Authentication” in “Biometrics: Personal Identification in Networked Society”, A. Jain, R. Bolle, and S. Pankanti (Eds.), Kluwer Academic Publishers, 1998. [10] “INS Passenger Accelerated Service System (INSPASS),” http://www.biometrics.org:8080/ ∼BC/ REPORTS/ INSPASS.html, 1996. [11] “HaSIS A Hand Shape Identification http://www.csr.unibo.it/research/biolab/hand.htm.
System”,
[12] Chernoff, H., “The use of Faces to Represent Points in k-Dimensional Space Graphically”, Journal of the American Statistical Association, 68, 361-368, 1973. [13] “Veridicom Fingerprint Sensor http://www.veridicom.com/fps100frames.htm.
for
[14] NCSA HTTPD Mosaic User Authentication http://hoohoo.ncsa.uiuc.edu/docs/tutorials/user.html
OEMS”, Tutorial.
[15] Ed Tittel, M. Gaither, S. Hassinger and M. Erwin. Web Programming Secrets with HTML, CGI, and Perl, IDG Books Worldwide, 1996.
Threshold 20 25 30 35 40 45 50 55 60 65 70 75 80 85 90 95 100 105 110 115 120 125 130 135
Hit Rate (%) 46.61 66.67 72.27 81.42 86.14 89.68 94.10 94.99 96.17 97.64 97.64 98.23 98.53 99.12 99.41 99.41 99.71 99.71 99.71 99.71 99.71 99.71 99.71 100.00
FAR (%) 0.00 0.01 0.04 0.28 0.72 1.76 2.81 4.62 6.69 9.11 11.95 15.09 18.26 21.81 24.94 28.18 31.24 34.33 37.36 40.11 42.79 45.17 47.45 50.09
50
60
HIT RATE(%)
70
80
90
100
(a) The hit rate and false acceptance rate at various thresholds
0
20
40
60
FALSE ACCEPT RATE(%)
(b) Receiver Operating Characteristic (ROC) Curve
ENROLL CLIENT
SERVER Request to Enroll
PROVIDE HAND
Send a form
IMAGE
CALCULATE AND ENCRYPT HAND FEATURES
Send encrypted details
DECRYPT AND ENROLL USER
ACCESS CLIENT
SERVER Request for document
DATABASE PROVIDE HAND
HAND TEMPLATES
Send a form
IMAGE FILE LIST CALCULATE AND ENCRYPT HAND FEATURES
details
ACCESS DENIED
SECURE FILES
Send encrypted DECRYPT AND VERIFY USER
NO
YES
ACCESS GRANTED LIST OF SECURE FILES
Request File EXTRACT SECURE FILE
SECURE FILE DISPLAYED
Figure 8: Flow diagram of client-server interaction.
(a)
(b)
Figure 9: Authentication GUI. (a) When access is granted, a list of accessible files is presented to the user. (b) When access is denied, user can not access any file.