The rising popularity of cloud computing makes build- ing high quality cloud ... alized cloud component ranking is to evaluate all the com- ponents at the ...
CloudRank: A QoS-Driven Component Ranking Framework for Cloud Computing Zibin Zheng, Yilei Zhang, and Michael R. Lyu Department of Computer Science and Engineering The Chinese University of Hong Kong Hong Kong, China {zbzheng,ylzhang,lyu}@cse.cuhk.edu.hk Abstract The rising popularity of cloud computing makes building high quality cloud applications a critical and urgentlyrequired research problem. Component quality ranking approaches are crucial for making optimal component selection from a set of functionally equivalent component candidates. Moreover, quality ranking of cloud components helps the application designers detect the poor performing components in the complex cloud applications, which usually include huge number of distributed components. To provide personalized cloud component ranking for different designers of cloud applications, this paper proposes a QoS-driven component ranking framework for cloud applications by taking advantage of the past component usage experiences of different component users. Our approach requires no additional invocations of the cloud components on behalf of the application designers. The extensive experimental results show that our approach outperforms the competing approaches.
1. Introduction Cloud computing [1, 8] is Internet-based computing, whereby shared resources, software and information are provided to computers and other devices on-demand, like a public utility. Strongly promoted by the leading industrial companies (e.g., Microsoft, Google, IBM, Amazon, etc.), cloud computing is quickly becoming popular in recent years. Cloud applications, which involve a number of distributed cloud components, are usually large-scale and very complex. With the rising popularity of cloud computing, building high-quality cloud applications becomes an urgently-required and critical research problem. Similar to the component-based systems [7, 21], cloud applications are also composed of a number of components.
In traditional component-based systems, the components are usually invoked locally, while in the cloud environment, cloud components are typically invoked remotely by communication links. Performance of the cloud applications is greatly influenced by the unpredictable communication links as well as a lot of other factors, such as service request provisioning, management, and so on. In addition, the cloud components are usually reusable by a lot of different cloud applications. Influenced by the unpredictable communication links, different cloud applications will receive different levels of quality for the same cloud component. Personalized component quality ranking is thus a crucial task for building high-quality cloud applications. Non-functional performance of cloud components are usually described by Quality-of-Service (QoS). There are usually a lot of redundant components in the cloud. When making cloud component selection from a set of alternative components, QoS-driven component quality ranking provides valuable information to assist the decision making of cloud application designers. Moreover, for the functionally non-equivalent components within a cloud application, component quality ranking helps cloud application designers effectively detect poor-performing components. By replacing or improving these low quality components, the overall quality of cloud applications can be improved. The major challenge for making QoS-driven component quality ranking is that the component quality ranking of a user (i.e., designer of the cloud application) cannot be transferred directly to another user, since the locations of the cloud applications are quite different. Personalized component quality ranking is therefore required for different cloud applications. The most straightforward approach of personalized cloud component ranking is to evaluate all the components at the user-side and rank the components based on the observed QoS performance. However, this approach is impractical in reality, since conducting component evaluation is time consuming and resource consuming. Moreover,
Application Designer Functional Equivalent Components
Cloud Application 1
Cloud Component a1 Cloud Component a2
Customer
Cloud Component am
Cloud Application 2
Internet
it is difficult for the cloud application designers to evaluate all the cloud components themselves, since there may exist a huge number of components in the cloud. To attack this critical challenge, we propose a collaborative QoS-driven ranking framework to predict the quality ranking of cloud components without requiring additional real-world component invocations from the intended user. Our approach takes advantage of the past usage experiences of other users for making ranking prediction for the current user. The contribution of this paper is two-fold:
Functional Equivalent Components Cloud Component b1 Cloud Component b2
• This paper identifies the critical problem of personalized component quality ranking for cloud applications and proposes a collaborative QoS-driven quality ranking framework (named CloudRank) to achieve personalized component quality ranking. To the best of our knowledge, CloudRank is the first collaborative ranking framework for cloud components. • Extensive real-world experiments are conducted to study the ranking performance of our CloudRank algorithm compared with other competing algorithms. The experimental results show the effectiveness of our approach. Comprehensive investigations on the impact of the algorithm parameters are also provided. The rest of this paper is organized as follows: Section 2 introduces a motivating example and the idea of component usage experiences sharing between users. Section 3 describes our collaborative component ranking framework. Section 4 presents experiments. Section 5 discusses related work and Section 6 concludes the paper.
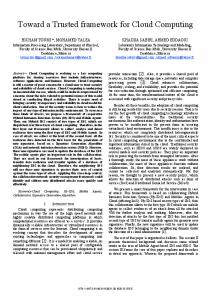
2. Preliminaries 2.1. Motivating Example We begin by using a motivating example to show the research problem of this paper. Figure 1 shows the system architecture. As shown in Figure 1, there are a number of distributed and reusable components in the cloud. These cloud components are employed by application designers to implement various cloud applications. The designers of cloud applications are named component users, since the cloud components are used by these designers to implement their cloud applications. Since the cloud components are invoked by the cloud applications, the servers running the components are the server-side and the servers running the cloud applications are the client-side in this paper. The end-users of the cloud applications are called customers. Since cloud applications are deployed in different geographic locations and Internet is employed for invoking the cloud components, different cloud applications may observe different levels of component quality. The following
Cloud Component bm
Cloud Application n
Figure 1. System Architecture are two scenarios to show why personalized cloud component quality ranking is needed: • When designing a cloud application (e.g., cloud application 1 shown in Fig. 1), the application designer wants to select the optimal cloud component from a set of functionally equivalent component candidates (i.e., a1, .., am). The optimal component highly relies on the locations of the cloud applications. Personalized quality ranking of the functionally equivalent cloud components is required for the application designer to make an optimal component selection. • For the components within a cloud application, the application designer wants to identify the poor performing components. By improving these performance bottlenecks, the overall performance of the cloud application can be improved. In this case, personalized quality ranking of the functionally inequivalent cloud components provides valuable information for detecting lowquality components. These two scenarios show that personalized component quality ranking of the cloud components is important in building high quality cloud applications. To provide effective QoS-driven component quality ranking approach, we introduce the idea of cloud component usage experiences sharing in Section 2.2 and propose a collaborative quality ranking framework in Section 3.
2.2. Component Usage Experience Sharing Quality-of-Service (QoS) can be measured at the serverside and the client-side. While the server-side QoS properties of cloud components provide good indications of the
component capacities, client-side QoS properties provide more realistic measurements of the performance experienced by the component users. The commonly-used clientside QoS properties include response-time, throughput, failure probability, user-rating, etc. In our previous work [28], a user-collaborative mechanism is proposed for collecting performance information of Web service components from different service users. The observed Web service QoS values can be contributed by the users by running a client-side Web service evaluation application [26] or employing a client-side middleware [25]. Different from service-oriented applications, the component usage experiences of the cloud components are much easier to obtain in the cloud environment, since the cloud applications are typically running on the same cloud. These cloud applications invoke and record the client-side QoS performance of the invoked cloud components. The cloud provider can collect these component QoS values from different cloud applications easily as long as the application owners agree. Based on the collected cloud component QoS values from different cloud applications, we propose a collaborative quality ranking framework for the new cloud applications in the next section.
3. Collaborative Quality Ranking Framework This section presents our collaborative component quality ranking framework, which is designed as a four-phase process. In Phase 1, we calculate the similarity of the users with the current user based on their rankings on the commonly-invoked components. Then, in Phase 2, a set of similar users are identified. After that, in Phase 3, a preference function is defined to present the quality priority of two components. Finally, in Phase 4, a greedy order algorithm is proposed to rank the employed components as well as the unemployed components based on the preference function and making use of the past usage experiences of other similar users. Details of these phases are presented at Section 3.1 to Section 3.4, respectively.
3.1. Ranking Similarity Computation In our approach, the ranking similarity between users is determined by comparing their personalized cloud component quality rankings on the commonly-invoked components. Suppose we have a set of three components, on which two users have observed response-times (seconds) of {1, 2, 4} and {2, 4, 5}, respectively. The response-time values on these components by the two users are clearly different; nevertheless their rankings are very close as the components are ordered in the same way, based on the response-time values. Given two rankings on the same set of components,
the Kendall rank correlation coefficient (KRCC) [15] evaluates the degree of similarity by considering the number of inversions of component pairs which would be needed to transform one rank order into the other. The KRCC value of user a and user u can be calculated by : C −D , (1) N (N − 1)/2 where N is the number of components, C is the number of concordant pairs between two lists, and D is the number of discordant pairs. Since C = N (N − 1)/2 − D, 4D Eq. (1) is equal to Sim(u, v) = 1 − N (N −1) . Employing Kendall rank correlation coefficient, the similarity between two component rankings can be calculated by: ∑ ˜ u,i − qu,j ) (qv,i − qv,j )) 4× I((q Sim(u, v) =
Sim(u, v) = 1−
i,j∈Iu ∩Iv
,
|Iu ∩ Iv | × (|Iu ∩ Iv | − 1)
(2) where Iu ∩ Iv is the subset of cloud components commonly invoked by user u and user v, qu,i is the QoS value (e.g., response-time, throughput, etc.) of component i observed ˜ is an indicator function defined as: by user u, and I(x) { 1 if x < 0 ˜ I(x) = . (3) 0 otherwise From above definition, the ranking similarity between two rankings, Sim(u, v), is in the interval of [-1,1], where -1 is obtained when the order of user u is the exact reverse of user v, and 1 is obtained when order of user u is equal to the order of user v. Since KRCC compares component pairs, the intersection between two users has to be at least 2 (|Iu ∩ Iv | ≥ 2) for the similarity computation.
3.2. Find Similar Users By calculating the KRCC similarity values between the current user and other users, the users similar to the current user can be identified. Previous ranking approaches [13, 22] usually employ information of all the users for making ranking prediction for the current user, which may include dissimilar users. However, employing QoS values of dissimilar users will greatly influence the prediction accuracy for the current user. To address this problem, our approach employs only the top-K similar users for making ranking prediction and excludes the users with negative correlations (negative KRCC values). In our approach, a set of similar users S(u) is identified for the current user u by: N (u) = {v|v ∈ Tu , Sim(u, v) > 0, v ̸= u},
(4)
where Tu is a set of the top-K similar users to the user u and Sim(u, v) > 0 excludes the dissimilar users with negative KRCC values. The value of Sim(u, v) in Eq. (4) can be calculated by Eq. (2).
3.3. Preference Function A user’s preference on a pair of components can be modeled in the form of Ψ : I × I → R [13], where Ψ(i, j) > 0 means that quality of component i is higher than component j and is thus more preferable for the user and vice versa. The value of the preference function Ψ(i, j) indicates the strength of preference and a value of zero means that there is no preference between the two components. The preference function Ψ(i, j) is anti-symmetric, i.e. Ψ(i, j) = −Ψ(j, i). We set Ψ(i, i) = 0 for all i ∈ I. Given the user-observed QoS values on two cloud components, the preference between these two components can be easily derived by comparing the QoS values, where Ψ(i, j) = qi − qj . To obtain preference information regarding the pairs of components that have not been invoked/observed by the current user, the QoS values of similar users S(u) is employed. The basic idea is that the more often the similar users in S(u) observe component i as higher quality than component j, the stronger the evidence for Ψ(i, j) > 0 and Ψ(j, i) < 0 for the current user. This leads to the following formula for estimating the value of the preference function Ψ(i, j), where component i and component j are not explicitly observed by the current user u: ∑ Ψ(i, j) = wv (qv,i − qv,j ), (5) v∈N (u)ij
where v is a similar user of the current u, N (u)ij is a subset of similar users, who obtain QoS values of both component i and j, and wv is a weigh factor which can be calculated by: Sim(u, v) wv = ∑ . (6) v∈N (u)ij Sim(u, v) wv makes sure that a similar user with higher similarity has greater impact on the preference value prediction for the current user u. By Eq. (5) and Eq. (6), the preference value between a pair of components can be obtained by taking advantage of the past usage experiences of the similar users. Assuming there are n components to be ranked and user u already obtains QoS values of a components, the total number of component pairs that can be derived explicitly is a(a−1)/2, and the total number of pairs that needs to be predicted from similar users is: n(n − 1)/2 − a(a − 1)/2.
3.4. Greedy Order Algorithm Given a preference function Ψ which assigns a score to every pair of components i, j ∈ I, we want to choose a quality ranking of components in I that agrees with the pairwise preferences as much as possible. Let ρ be a ranking of components in I such that ρ(i) > ρ(j) if and only if i is
ranked higher than j in the ranking ρ. We can define a value function V Ψ (ρ) as follows that measures the consistency of the ranking ρ with the preference function: ∑ V Ψ (ρ) = Ψ(i, j). (7) i,j:ρ(i)>ρ(j)
Our goal is to produce a ranking ρ∗ that maximizes the above objective value function. One possible approach to solve the component ranking problem is to search through the possible rankings and select the optimal ranking ρ∗ that maximizes the value function defined in Eq. (7). However, there are n! possible rankings for n components. It is impossible to search all the rankings when the value of n is large. Cohen et al. [6] have showed that finding the optimal ranking ρ∗ is an NP-Complete problem. To enhance the calculation efficiently, we propose a greedy order algorithm in Algorithm 1 (named as CloudRank) for finding an approximately optimal ranking: Algorithm 1: Greedy Order Algorithm: CloudRank Input: an employed component set E, a full component set I, a preference function Ψ Output: a component ranking ρˆ 1 F = E; 2 while F ̸= ∅ do 3 t = arg maxi∈F qi ; 4 ρe (t) = |E| − |F | + 1; 5 F = F − {t}; 6 end 7 foreach i ∈ I do ∑ π(i) = j∈I Ψ(i, j); 8 9 end 10 n = |I|; 11 while I ̸= ∅ do 12 t = arg maxi∈I π(i); 13 ρˆ(t) = n − |I| + 1; 14 I = I − {t}; 15 foreach i ∈ I do 16 π(i) = π(i) − Ψ(i, t) 17 end 18 end 19 while E ̸= ∅ do 20 e = arg mini∈E ρe i; 21 index = mini∈E ρˆ(i); 22 ρˆ(e) = index; 23 E = E − {e}; 24 end Algorithm 1 includes the following steps: • Step 1 (lines 1 - 6): Rank the employed cloud components in E based on the observed QoS values. ρe (t)
stores the ranking, where t is a component and the function ρe (t) returns the corresponding order of this component. The values of ρe (t) are in the range of [1, |E|], where a smaller value indicates higher quality. • Step 2 (lines 7 - 9): For each component in the full component set I, calculate the sum of preference values with all other components by π(i) = ∑ j∈I Ψ(i, j). As introduced in Section 3.3, Ψ(i, i) = 0. Therefore, including Ψ(i, i) in the calculation does not influence the results. Larger π(i) value indicates more components are less preferred than i (i.e., Ψ(i, j) > 0). In other word, component i should be ranked in higher position. • Step 3 (lines 10 - 18): Components are ranked from the highest position to the lowest position by picking the component t that has the maximum π(t) value. The selected component is assigned a rank equal to n−|I|+1 so that it will be ranked above all the other remaining components in I. The ranks are in the range of [1, n] where n is the number of components and a smaller value indicates higher quality. The selected component t is then deleted from I and the preference sum values Ψ(i) of the remaining components are updated to remove the effects of the selected component t. • Step 4 (lines 19 - 24): Step 3 treats the employed components in E and the non-employed component in I − E identically which may incorrectly rank the employed components. In this step, the initial comˆ is updated by correcting the rankponent ranking ρ(i) ings of the employed components in E. By replacing ˆ with the corresponding corthe ranking results in ρi rect ranking of ρe (t), our approach makes sure that the employed components in E are correctly ranked. Algorithm 1 has a time complexity of O(n2 ), where n is the number of components. Compared with the other greedy algorithm [6], our approach guarantee that the employed components are correctly ranked. As will be shown in the experiments of Section 4, our approach provides better ranking accuracy more consistently than the greedy algorithm in [6].
4. Experiments 4.1. Dataset Description We evaluate the ranking algorithms using our WSDREAM1 Web service QoS dataset [28]. The WS-DREAM dataset includes QoS performance of about 1.5 million realworld Web service invocations of 100 publicly available 1 http://www.wsdream.net
Table 1. WS-DREAM Dataset Descriptions Statistics Values Num. of Web service invocations 1,542,884 Num. of service users 150 Num. of Web services 100 Num. of user countries 24 Num. of Web service countries 22 Minimum response-time value 0.009 s Maximum response-time value 28.96 s Mean of response-time 1.73 s Standard deviation of response-time 3.65 s Minimum throughput value 0.03 kBps Maximum throughput value 643.36 kBps Mean of throughput 4.10 kBps Standard deviation of throughput 12.17 kBps
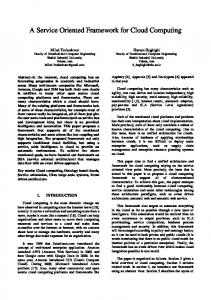
Web services observed by 150 distributed users. In our experiments, a Web service presents a cloud component, while a cloud application is composed by a set of service components. The QoS values of the 100 Web services observed by the 150 service users can be presented as a 150 × 100 user-item matrix, where each entry in the matrix is a vector including values of different QoS properties. In the experiment, the response-time and throughput QoS values are employed independently to rank the components. Responsetime is the time duration between the user sending out a request to a component and receiving a response. Throughput represents the data transfer rate over the network. Table 1 shows descriptions of the WS-DREAM dataset. As shown in Table 1, the minimum and maximum values of response-time are 0.009 seconds and 28.96 seconds, respectively. The mean and standard deviation of all the 15,000 response-time values in the user-item matrix observed by 150 users on 100 Web services are 1.73 and 3.65 seconds, respectively, indicating that the response-time values of different Web services observed by different users exhibit a great variation. The mean and standard deviation values of throughput are 4.1 kilo-Byte per second (kBps) and 12.17 kBps. The throughput values also exhibit a great variation. The distributions of the response-time and throughput values of the user-item matrix are shown in Fig. 2(a) and Fig. 2(b), respectively. Figure 2 shows that a large part of response-time values are between 0.2 seconds and 1.6 seconds, while most throughput values are between 0.4 kBps (kilo-Byte per second) and 3.2 kBps.
4.2. Evaluation Metric To evaluate the component ranking performance, we employ the Normalized Discounted Cumulative Gain(NDCG) [2] metric, which is popular metric for evalu-
4500
4000
4000
3500
3500
3000
3000
Numbes
Numbes
4500
2500 2000
2500 2000
1500
1500
1000
1000
500 0
Vector similarity (VS) views each user as a vector in a high dimensional vector space based on his/her QoS values. The cosine of the angle between the two corresponding vectors is used to measure the similarity between user a and user u: ∑ qa,i qu,i
500 0
3.2
Values of Response−Time (seconds)
i∈I ∩Iu
6.4
Sim(a, u) = √ ∑ a
Values of Throughput (kBps)
(a)
(b)
2 qa,i
ating ranked results in information retrieval. Given an ideal descending component ranking and a predicted descending component ranking, the NDCG performance of the top-K ranked components can be calculated by: N DCGk =
DCGk , IDCGk
(8)
where DCGk and IDCGk are the discounted cumulative gain (DCG) values of the top-K components of the predicted component ranking and ideal component ranking, respectively. The value of DCGk can be calculated by: DCGk = rel1 +
k ∑ reli , log2 i i=2
(9)
where reli is the graded relevance (QoS value) of the component at position i in the ranking. The premise of DCG is that high quality component appearing lower in a the ranking list should be penalized as the graded relevance value is reduced logarithmically proportional to the position of the result. The DCG value is accumulated cumulatively from the top of the result list to the bottom with the gain of each result discounted at lower ranks. The ideal rank achieves the highest gain among all different rankings. The N DCGk value is on the interval of 0.0 to 1.0, where larger value stands for better ranking accuracy since the predicted ranking is more near the ideal ranking. The value of k is on the interval of 1 to number of components.
4.3. User-based and Item-based Models Before conducting performance comparison of our approach with other approaches, we first briefly introduce some well-known neighbor-hood based collaborative filtering approaches in this section. Assume that there are m users, n components, and the relationship between users and Web services is denoted by an m × n user-item matrix. Each entry qa,i in the matrix represents the QoS value of component i observed by user a. qa,i = null if user a did not invoke component i previously.
,
(10)
2 qu,i
i∈Ia ∩Iu
i∈Ia ∩Iu
Figure 2. Value Distribution of User-Item Matrix
∑
where Ia ∩ Iu is a set of commonly invoked components by both user a and user u, qa,i is the QoS value of component i observed by the user a. Pearson Correlation Coefficient (PCC), another popular similarity computation approach, employs the following equation to compute the similarity between service user a and service user u based on their commonly invoked components: ∑ (qa,i − qa )(qu,i − qu ) i∈Ia ∩Iu
Sim(a, u) = √ ∑
i∈Ia ∩Iu
(qa,i − qa
)2
√ ∑
, (qu,i − qu
)2
i∈Ia ∩Iu
(11) where q a is the average QoS value of all the components invoked by user a. The PCC similarity Sim(a, u) of two users is in the interval of -1 and 1, where a larger value indicates higher similarity. Employing the similar users, the user-based collaborative filtering approaches [4, 19] predict a missing value qu,i in the matrix by the following equation: ∑ a∈S(u) Sim(a, u)(qa,i − qa ) ∑ qu,i = qu + , (12) a∈S(u) Sim(a, u) where Sim(a, u) can be calculated by VS or PCC, and qu and qa are the average QoS values of different components observed by user u and a, respectively. Similar to the user-base approaches, Eq.(10) and Eq.(11) (VS and PCC) can also be employed to calculate the similarity between two items (components). The item-based approaches [16] predict the missing value employing the similar items. The user-based and item-based approaches can be combined for making missing value prediction [28]: 1 2 qu,i = λqu,i + (1 − λ)qu,i , 1 qu,i
(13)
2 where is predicted by the user-based approach and qu,i is predicted by the item-based approach. These above collaborative filtering approaches are rating-oriented, since they first predict the missing values in the matrix before making component ranking. Different from these rating-oriented approaches, our approach rank the items directly without predicting the missing values in the matrix.
Table 2. NDCG Comparison of Response Time (Larger value indicates better ranking accuracy) Methods UVS: UPCC: IVS: IPCC: UIVS: UIPCC: Greedy CloudRank
Matrix Density = 10% NDCG3 NDCG10 NDCG100 0.9491 0.9104 0.9514 0.9347 0.8968 0.9414 0.9710 0.9308 0.9637 0.9737 0.9359 0.9656 0.9719 0.9304 0.9639 0.9730 0.9354 0.9653 0.9789 0.9523 0.9755 0.9792 0.9532 0.9763 0.63% 1.85% 1.11%
Methods UVS: UPCC: IVS: IPCC: UIVS: UIPCC: Greedy CloudRank
Matrix Density = 10% NDCG3 NDCG10 NDCG100 0.8588 0.8644 0.9096 0.8473 0.8547 0.9010 0.8752 0.8778 0.9193 0.8731 0.8736 0.9185 0.8793 0.8800 0.9219 0.8789 0.8772 0.9217 0.8951 0.9002 0.9325 0.8984 0.9020 0.9341 2.17% 2.49% 1.33%
Matrix Density = 30% NDCG3 NDCG10 NDCG100 0.9689 0.9476 0.9726 0.9696 0.9489 0.9729 0.9689 0.9442 0.9690 0.9688 0.9466 0.9702 0.9689 0.9441 0.9696 0.9691 0.9477 0.9711 0.9816 0.9728 0.9860 0.9854 0.9760 0.9888 1.63% 2.85% 1.63%
Matrix Density = 50% NDCG3 NDCG10 NDCG100 0.9547 0.9408 0.9663 0.9541 0.9417 0.9666 0.9548 0.9417 0.9661 0.9588 0.9484 0.9695 0.9553 0.9423 0.9663 0.9584 0.9482 0.9695 0.9939 0.9843 0.9921 0.9959 0.9864 0.9947 3.87% 4.01% 2.60%
Table 3. NDCG Performance Comparison of Throughput Matrix Density = 30% NDCG3 NDCG10 NDCG100 0.9164 0.9075 0.9431 0.9173 0.9141 0.9456 0.9173 0.9112 0.9454 0.9163 0.9207 0.9482 0.9184 0.9100 0.9453 0.9176 0.9215 0.9487 0.9109 0.9274 0.9493 0.9198 0.9351 0.9551 0.15% 1.48% 0.68%
4.4. Performance Comparison To study the personalized component ranking performance, we compare our ranking approach (named as CloudRank) with seven other approaches:
Matrix Density = 50% NDCG3 NDCG10 NDCG100 0.9061 0.9165 0.9447 0.9152 0.9241 0.9504 0.9133 0.9288 0.9522 0.9249 0.9438 0.9603 0.9100 0.9236 0.9492 0.9227 0.9406 0.9583 0.9229 0.9411 0.9596 0.9411 0.9528 0.9689 1.75% 0.95% 0.90%
• UIVS (User-based and item-based Collaborative filtering using Vector Similarity): This method combines the user-based and item-based collaborative filtering approaches and employs the vector similarity for the similarity computation for users and items.
• UVS (User-based collaborative filtering method using Vector Similarity): This method employs vector similarity for calculating the user similarities and uses the similar users for the QoS value prediction.
• UIPCC (User-based and item-based Collaborative filtering using Pearson Correlation Coefficient): This method combines the user-based and item-based collaborative filtering approaches and employs PCC for the similarity computation [28].
• UPCC (User-based collaborative filtering method using Pearson Correlation Coefficient): This is a very classical method. It employs PCC for calculating the user similarities and employs the similar users for the QoS value prediction [4, 19].
• Greedy: This method is proposed for ranking a set of items, which treats the explicitly rated items and the unrated items equally [6]. It doesn’t guarantee that the explicitly rated items will be ranked correctly.
• IVS (Item-based collaborative filtering method using Vector Similarity): This method employs vector similarity for computing the item (components) similarity when making QoS value prediction. • IPCC (Item-based collaborative filtering method using Pearson Correlation Coefficient): This method is widely used in industry company like Amazon. In this paper, it employs similar items (components) for the QoS value prediction [16].
In real-world, the user-item matrices are usually very sparse since a user usually only employs a small number of components. In order to conduct our experiments realistically, we randomly remove entries from the user-item matrix to make the matrix sparser with different density. Matrix density (i.e. proportion of nonzero entries) 10%, for example, means that we randomly select 10% of the QoS entries to predict the quality rankings of the users. The rankings based on the original full matrix are employed as ideal rankings to study the ranking performance. The above
seven methods together with our CloudRank method are employed for making quality components rankings based on the incomplete information. We set top-K=10 in our CloudRank method in the experiments. Detailed investigations of the parameter settings (e.g., top-K values) will be conducted in Section 4.5. The experimental results are shown in Table 2 and Table 3. Table 2 and Table 3 show the NDCG performance of response-time and throughput, respectively employing 10%, 30% and 50% density user-item matrices. In the second row of the table, NDCG3 indicates that the ranking accuracy of the top 3 items is investigated. The value of NDCG3 can be calculated by Eq. (8). The first six methods in the table are rating-oriented methods, while the last two methods are ranking-oriented methods. For each column in the Tables, we have highlighted the best performer among all methods and the best performer among all the ratingbased methods. The values shown in the bottom row are the performance improvements achieved by the best methods over the best rating-oriented methods. Table 2 and Table 3 show that: • Among all the ranking methods, our CloudRank approach obtains better prediction accuracy (larger NDCG values) for both response-time and throughput under all the experimental settings consistently.
4.5. Impact of Parameters 4.5.1
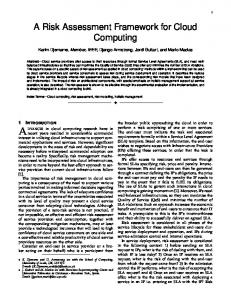
The Top-K value determines the number of similar users employed in our CloudRank method. To study the impact of the parameter Top-K on the ranking results, we vary the values of Top-K from 1 to 10 with a step value of 1. We set matrix density=20% in this experiment. Two CloudRank versions are implemented, where the first one employs the enhanced Top-K algorithm proposed in Section 3.2 and the second one employs traditional Top-K algorithm without excluding dissimilar users. Figure 3(a) and Figure 3(b) show the NDCG5 and NDCG100 results of response-time, while Figure 3(c) and Figure 3(d) show the NDCG5 and NDCG100 results of throughput. Figure 3 shows that the NDCG performance of traditional Top-K algorithm of both response-time and throughput decreases when the Top-K value is increased from 1 to 10. This is because large Top-K value will introduce noise and include dissimilar users, which will hurt the ranking accuracy. In all the four figures from Figure 3(a) to Figure 3(d), our enhanced Top-K algorithm obtains stable NDCG performance and outperform the traditional Top-K algorithm consistently. 4.5.2
• The improvements on NDCG3, NDCG5 and NDCG100 of the best method over the best rating oriented method are 1.92%, 2.27% and 1.38% on average. • Compared with the Greedy approach, our CloudRank method consistently achieves better ranking performance on NDCG3, NDCG10 and NDCG100. As introduced in Section 3.4, our CloudRank approach makes sure that the employed components are correctly ranked. • When the density of the user-item matrix is increased from 10% to 50%, the ranking accuracy (NDCG values) is also enhanced, since denser user-item matrix provides more information for the missing value prediction. • The approaches that combine user-based and itembased approaches (UIVS and UIPCC) outperform the user-based approaches (UVS and UPCC) and itembased approaches (IVS and IPCC) under most experimental settings. This observation indicates that by combining the user-based and item-based approaches, better component ranking performance can be achieved.
Impact of Top-K
Impact of Matrix Density
The ranking accuracy is influenced by the matrix density. To study the impact of the matrix density on the ranking results, we change the matrix density from 5% to 50% with a step value of 5%. We set Top-K=10 in this experiment. Two ranking-based methods (i.e., CloudRank and Greedy) are compared in this experiment. Figure 4 shows the experimental results, where Figure 4(a) and Figure 4(b) are the NDCG5 and NDCG100 results of response-time, and Figure 4(c) and Figure 4(d) are the NDCG5 and NDCG100 results of throughput. Figure 4 shows that when the matrix density is increased from 5% to 50%, the ranking accuracies of both the CloudRank and Greedy methods are significantly enhanced. This observation indicates that the prediction accuracy can be greatly enhanced by collecting more QoS values to make the matrix denser, especially when the matrix is very sparse. In all the figures from Figure 4(a) to Figure 4(d), our CloudRank method outperforms the Greedy method consistently.
5. Related Work and Discussion Quality-of-Service (QoS) have been widely employed for presenting the non-functional characteristics of the software systems and components [17, 23, 27]. The nonfunctional QoS performance of cloud components can be
Response−time
1
0.8
0.8
0.4
0
2
4
6
Values of Top−K
8
0.4
0.4
0.2
Enhanced Top−K Algorithm Traditional Top−K Algorithm
0.6
0.6
0.4
0.2
0.8
NDCG5
0.6
0.2
0.2 Enhanced Top−K Algorithm Traditional Top−K Algorithm
0
10
2
4
6
8
Values of Top−K
(a)
Throughput
1
0.8
NDCG100
NDCG5
0.6
Throughput
1
NDCG100
Response−time
1
Enhanced Top−K Algorithm Traditional Top−K Algorithm
Enhanced Top−K Algorithm Traditional Top−K Algorithm
10
0
2
4
6
8
Values of Top−K
(b)
10
0
2
4
6
8
Values of Top−K
(c)
10
(d)
Figure 3. Impact of Top-K Response−time
Throughput
Response−time CloudRank Greedy
0.995
NSCG5
NSCG100
NSCG5
0.98
10
20
30
Matrix Density
(a)
40
50
0.98
0.94 0.92 0.9
0.96 0.94 0.92
0.975
0.88
0.9
0.97
0.86
0.88
10
20
30
40
Matrix Density
(b)
50
10
20
CloudRank Greedy
0.98
0.96
0.99
0.985
0.985
1 CloudRank Greedy
0.98
0.995
0.99
Throughput
1
1 CloudRank Greedy
NSCG100
1
30
Matrix Density
40
50
10
20
30
40
50
Matrix Density
(c)
(d)
Figure 4. Impact of Matrix Density measured from either the user’s perspective (e.g., responsetime, throughput, etc.) or the component provider’s perspective (e.g., price, availability, etc.). Based on the component QoS performance, various approaches have been proposed for component selection [3, 23, 24], which enables optimal software component to be identified from a set of functionally similar or equivalent candidates. To enable optimal cloud component selection, in this paper, we focus on components quality ranking by collaborative filtering approach. Collaborative filtering methods are widely adopted in recommender systems [5, 14, 16]. neighborhood-based is one type of the most widely studied collaborative filtering approaches. The most analyzed examples of neighborhood-based collaborative filtering include userbased approaches [4, 10, 11], item-based approaches [9, 12, 18], and their fusion [14, 20, 28]. User-based and item-based approaches often use the vector similarity algorithm [4] and the PCC algorithm [16] as the similarity computation methods. Compared with vector similarity, PCC considers the differences in the user rating style when calculating the similarity. The neighborhood-based collaborative filtering approaches usually try to predict the missing values in the user-item matrix as accurately as possible. However, in the ranking-oriented scenarios, accurate missing value predic-
tion may not lead to accuracy ranking. Therefore, rankingoriented collaborative filtering approaches are becoming more and more attractive. Liu et al. [13] propose a rankingoriented collaborative filtering approach to rank movies. Yang et al. [22] propose another ranking-oriented approach for ranking books in digital libraries. Different from these previous work [13, 22], our work provides a comprehensive study of how to provide accurate component quality ranking for cloud applications, which is a new and urgent-required research problem.
6. Conclusion and Future Work In this paper, we propose a QoS-driven collaborative quality ranking framework for cloud components, which requires additional invocations of the cloud components. By taking advantage of the past usage experiences of other users, our ranking approach identifies and aggregates the preferences between pair of components to produce a ranking of components. We propose a greedy method for computing the component ranking based on the component preferences. Experimental results show that our approach outperforms existing rating-based collaborative filtering approaches and the traditional greedy method. For future work, we would like to investigate different techniques proposed for improving the ranking accuracy
(e.g., data smoothing, random walk, matrix factorization, utilizing content information, etc.). We will also conduct more investigations on the correlations and combinations of different QoS properties (our current approach ranks different QoS properties independently).
Acknowledgement The work described in this paper was fully supported by a grant (Project No. CUHK4154/09E) from the Research Grants Council of the Hong Kong Special Administrative Region, China.
References [1] M. Armbrust, A. Fox, R. Griffith, A. D. Joseph, R. H. Katz, A. Konwinski, G. Lee, D. A. Patterson, A. Rabkin, I. Stoica, and M. Zaharia. Above the clouds: A berkeley view of cloud computing. Technical Report, EECS-2009-28, University of California, Berkeley, 2009. [2] K. J. arvelin and J. Kekalainen. Cumulated gain-based evaluation of ir techniques. ACM Transactions on Information Systems, 20(4):422–446, 2002. [3] P. A. Bonatti and P. Festa. On optimal service selection. In Proc. 14th Int’l Conf. World Wide Web (WWW’05), pages 530–538, 2005. [4] J. S. Breese, D. Heckerman, and C. Kadie. Empirical analysis of predictive algorithms for collaborative filtering. In Proc. 14th Annual Conf. Uncertainty in Artificial Intelligence (UAI’98), pages 43–52, 1998. [5] R. Burke. Hybrid recommender systems: Survey and experiments. User Modeling and User-Adapted Interaction, 12(4):331–370, 2002. [6] W. W. Cohen, R. E. Schapire, and Y. Singer. Learning to order things. Journal of Artificial Intelligent Research, 10(1):243–270, 1999. [7] V. Cortellessa and V. Grassi. A modeling approach to analyze the impact of error propagation on reliability of component-based systems. In Proc. 10th Int’l Symp. Component-Based Software Eng., pages 140–156, 2007. [8] M. Creeger. Cloud computing: An overview. ACM Queue, 7(5), June 2009. [9] M. Deshpande and G. Karypis. Item-based top-n recommendation. ACM Trans. Information System, 22(1):143–177, 2004. [10] J. L. Herlocker, J. A. Konstan, A. Borchers, and J. Riedl. An algorithmic framework for performing collaborative filtering. In Proc. 22nd Int’l ACM SIGIR Conf. on Research and Development in Information Retrieval (SIGIR’99), pages 230–237, 1999. [11] R. Jin, J. Y. Chai, and L. Si. An automatic weighting scheme for collaborative filtering. In Proc. 27th Int’l ACM SIGIR Conf. on Research and Development in Information Retrieval (SIGIR’04), pages 337–344, 2004. [12] G. Linden, B. Smith, and J. York. Amazon.com recommendations: Item-to-item collaborative filtering. IEEE Internet Computing, 7(1):76–80, 2003.
[13] N. N. Liu and Q. Yang. Eigenrank: a ranking-oriented approach to collaborative filtering. In Proc. 31st Int’l ACM SIGIR Conf. on Research and Development in Information Retrieval (SIGIR’08), pages 83–90, 2008. [14] H. Ma, I. King, and M. R. Lyu. Effective missing data prediction for collaborative filtering. In Proc. 30th Int’l ACM SIGIR Conf. on Research and Development in Information Retrieval (SIGIR’07), pages 39–46, 2007. [15] J. Marden. Analyzing and Modeling Ranking Data. Chapman & Hall, New York, 1995. [16] P. Resnick, N. Iacovou, M. Suchak, P. Bergstrom, and J. Riedl. Grouplens: An open architecture for collaborative filtering of netnews. In Proc. of ACM Conf. Computer Supported Cooperative Work, pages 175–186, 1994. [17] S. Rosario, A. Benveniste, S. Haar, and C. Jard. Probabilistic qos and soft contracts for transaction-based web services orchestrations. IEEE Trans. Services Computing, 1(4):187– 200, 2008. [18] B. Sarwar, G. Karypis, J. Konstan, and J. Riedl. Item-based collaborative filtering recommendation algorithms. In Proc. 10th Int’l Conf. World Wide Web (WWW’01), pages 285– 295, 2001. [19] L. Shao, J. Zhang, Y. Wei, J. Zhao, B. Xie, and H. Mei. Personalized qos prediction for web services via collaborative filtering. In Proc. 5th Int’l Conf. Web Services (ICWS’07), pages 439–446, 2007. [20] J. Wang, A. P. de Vries, and M. J. Reinders. Unifying userbased and item-based collaborative filtering approaches by similarity fusion. In Proc. 29th Int’l ACM SIGIR Conf. on Research and Development in Information Retrieval (SIGIR’06), pages 501–508, 2006. [21] S. M. Yacoub, B. Cukic, and H. H. Ammar. Scenario-based reliability analysis of component-based software. In Proc. Int’l Symp. Software Reliability Engineering (ISSRE’99), pages 22–31, 1999. [22] C. Yang, B. Wei, J. Wu, Y. Zhang, and L. Zhang. Cares: a ranking-oriented cadal recommender system. In Proc. 9th ACM/IEEE-CS joint conference on Digital libraries (JCDL’09), pages 203–212, 2009. [23] T. Yu, Y. Zhang, and K.-J. Lin. Efficient algorithms for web services selection with end-to-end qos constraints. ACM Trans. the Web, 1(1):1–26, 2007. [24] L. Zeng, B. Benatallah, A. H. Ngu, M. Dumas, J. Kalagnanam, and H. Chang. Qos-aware middleware for web services composition. IEEE Trans. Software Engeering, 30(5):311–327, 2004. [25] Z. Zheng and M. R. Lyu. A qos-aware middleware for fault tolerant web services. In Proc. Int’l Symp. Software Reliability Engineering (ISSRE’08), pages 97–106, 2008. [26] Z. Zheng and M. R. Lyu. Ws-dream: A distributed reliability assessment mechanism for web services. In Proc. 38th Int’l Conf. Dependable Systems and Networks (DSN’08), pages 392–397, 2008. [27] Z. Zheng and M. R. Lyu. A qos-aware fault tolerant middleware for dependable service composition. In Proc. 39th Int’l Conf. Dependable Systems and Networks (DSN’09), pages 239–248, 2009. [28] Z. Zheng and M. R. Lyu. Collaborative reliability prediction for service-oriented systems. In Proc. IEEE/ACM 32nd Int’l Conf. Software Engineering (ICSE’10), pages 35–44, 2010.