A Quantitative Stock Prediction System based on Financial News Robert P. Schumaker1 and Hsinchun Chen2 1
Hagan School of Business, Information Systems Department Iona College, New Rochelle, New York 10801, USA
[email protected]
2
Artificial Intelligence Lab, Department of Management Information Systems The University of Arizona, Tucson, Arizona 85721, USA
[email protected]
Word Count: 7984
Abstract We examine the problem of discrete stock price prediction using a synthesis of linguistic, financial and statistical techniques to create the Arizona Financial Text System (AZFinText). The research within this paper seeks to contribute to the AZFinText system by comparing AZFinText’s predictions against existing quantitative funds and human stock pricing experts. We approach this line of research using textual representation and statistical machine learning methods on financial news articles partitioned by similar industry and sector groupings. Through our research, we discovered that stocks partitioned by Sectors were most predictable in measures of Closeness, Mean Squared Error (MSE) score of 0.1954, predicted Directional Accuracy of 71.18% and a Simulated Trading return of 8.50% (compared to 5.62% for the S&P 500 index). In direct comparisons to existing market experts and quantitative mutual funds, our system’s trading return of 8.50% outperformed well-known trading experts. Our system also performed well against the top 10 quantitative mutual funds of 2005, where our system would have placed fifth. When comparing AZFinText against only those quantitative funds that monitor the same securities, AZFinText had a 2% higher return than the best performing quant fund.
Keywords: Knowledge management, prediction from textual documents, quantitative funds
1. Introduction Predicting changes in the stock market has always had a certain appeal to researchers. While numerous attempts have been made (Chan et al., 1996; Cho et al., 1999; Gidofalvi, 2001; Mittermayer, 2004; Seo et al., 2002; Wuthrich et al., 1998; Yoon & Swales, 1991), the difficulty has always centered on the behaviors of human traders within this socially constructed system. With parameters ill-defined and constantly shifting, prediction has been difficult at best. To further create confusion, there have been two diametrically opposed philosophies of stock market research: fundamental and technical analysis techniques (Technical-Analysis, 2005). Acquiring relevant textual data is an important facet of stock market prediction. While many reports and articles are written on a daily basis, information flowing from these sources must take the form of numeric data before existing applications can process it. This limitation forces open a temporal gap between when information is acquired to when it can be acted on. Information of an unexpected nature can cause a significant impact on share prices and the ability to make accurate predictions from these textual documents would be a useful decisionmaking tool. Our research helps to close this gap by creating the Arizona Financial Text System (AZFinText), which can learn from textual financial documents and make price predictions based upon the news it contains. While there have been several studies covering textual financial predictions, these studies have been limited to classifying price direction, i.e., the stock price will increase, decrease or stay the same (Cho et al., 1999; Lavrenko et al., 2000b; Mittermayer, 2004). Discrete analysis, or assigning an exact price with some degree of accuracy has not been a trivial task. In regards
2
to textual document selection, prior studies have used either all financial news articles or only those articles of a specific company(Cho et al., 1999; Gidofalvi, 2001; Lavrenko et al., 2000b; Lavrenko et al., 2000a; Mittermayer, 2004; Wuthrich et al., 1998). These studies have neglected the investigation of in-between categories, such as industry sectors in their analyses. This paper will examine the worth of using textual financial news articles divided by similar industries and groupings. Similarly, we will also measure the value of our system versus existing quantitative funds and hedge-fund managers. This paper is arranged as follows. Section 2 provides an overview of literature concerning Stock Market prediction, textual representations and machine learning techniques. Section 3 describes our research questions. Section 4 outlines the AZFinText system. Section 5 provides an overview of our experimental design. Section 6 details our experimental findings and discusses their impact on stock market prediction. Section 7 delivers our conclusions and a brief discourse on future research directions.
2. Literature Review In predicting stock market movement, two theories have had a significant impact on market research: Efficient Market Hypothesis (EMH) and Random Walk Theory. In EMH, the price of a security is a reflection of complete market information. Whenever a change in financial outlook occurs, the market will instantly adjust the security price to reflect the new information (Fama, 1964). EMH contained three different levels of information sharing: the weak form, the semi-strong and the strong form. Within weak EMH, only historical data is embedded within the current price. The semi-strong form goes farther by incorporating historical and current public information into its prices. The strong form includes historical and current public information as well as private information. From these three forms, it was
3
believed that markets behaved efficiently and that instantaneous price corrections would obviate prediction models. Random Walk Theory is slightly different in its theoretical underpinnings by focusing on an overall short-term random pattern of stock market movements (Malkiel, 1973). This random activity is believed to produce unpredictable prices and makes it impossible to consistently outperform the market. This view is similar to the Semi-Strong EMH model where all information is contained within the current price and is worthless for future prediction.
2.1 Fundamentalists and Technicians While EMH and Random Walk have served to discourage forecasting activity, the traders that persisted formed two distinctly different viewpoints on market prediction: fundamental and technical analysis. Fundamentalists are interested in the internal makeup of a security, such as numeric data on the overall economy, individual stock health ratios such as inflation, interest rates, return on assets, debt to equity and price to earnings among others. The focus of the fundamental trader is to make predictions from the current set of numeric data. As a consequence, historical or time-series data is not considered. By contrast, technicians rely heavily on time-series data and believe that market timing is crucial. Figures such as volume, volatility, support/resistance levels and charting techniques are all within the repertoires of a Technicians toolbox. However, technical analysis is considered to be more of an art form and is subject to interpretation. In a study comparing the merits of fundamental and technical trading strategies, LeBaron created an artificial stock market with simulated traders (LeBaron et al., 1999). He introduced new pieces of information into the market and varied the amount of time between when an individual trader would receive information and act upon it. It was found that traders with
4
longer-period waiting times formed fundamental strategies while those with shorter-period waits developed technical strategies. This study was more important from the standpoint that a lag was discovered between the time that information was introduced to when the market corrected itself. This apparent delay in market behavior helped to dispel the instantaneous correction notions of EMH and lent support of a weak ability to forecast the market. Subsequent research into this weak forecasting ability (Shmilovici et al., 2003) led to the discovery of a twenty minute window of opportunity before and after a financial news article is released (Gidofalvi, 2001). Within this window, weak prediction of stock price direction was found to be possible.
2.2 Financial News Articles The extent of prediction between financial news articles and their impact on stock market prices is a complex avenue to investigate. While the information contained in financial news articles can have a visible impact on a security’s price (Gidofalvi, 2001; Lavrenko et al., 2000a; Mittermayer, 2004; Wuthrich et al., 1998), sudden price movements can still occur from large unexpected trades (Camerer & Weigelt, 1991). The first challenge of textual financial prediction is to process the large amounts of textual information which exist for securities. This material not only includes required reports such as periodic SEC filings, but also a wealth of financial news articles reporting unexpected events and routine news alike. Financial news articles can be automatically capitalized on by using Natural Language Processing (NLP) and text-processing techniques to identify specific terms which can lead to dramatic share price changes. This method can be repeatedly used to forecast price fluctuations and take advantage of arbitrage opportunities faster than human counterparts.
5
The means of obtaining timely financial news articles can come from a variety of Internet sources. One source is Comtex which offers real-time financial news in a subscription format. Another source is PRNewsWire which offers free real-time and subscription-based services. By contrast, Yahoo Finance is a compilation of 45 different news sources including the Associated Press, Financial Times and PRNewsWire among others. This source provides a variety of perspectives and timely news stories regarding financial markets.
2.3 Textual Representation Once news articles have been collected they must be represented. One technique is to use a Bag of Words approach which has been extensively used in textual financial research (Gidofalvi, 2001; Lavrenko et al., 2000a). This process involves the removal of meaningless stopwords such as conjunctions and declaratives from text and using the remaining terms as the textual representation. While this method has been popular, its drawbacks include noise from seldom-used terms and scalability problems where immense computational power is required for large datasets. An improved representational system which addresses these shortcomings is Noun Phrases. This representation focuses on retaining only the nouns and noun phrases present within a document and has been found to adequately represent the important article concepts (Tolle & Chen, 2000). As a consequence of its noun-centric activity, this technique uses fewer terms and can handle article scaling better than Bag of Words. A third representational technique is Named Entities, which extends Noun Phrases by selecting the article’s proper nouns that fall within well-defined categories. This process uses a semantic lexical hierarchy (Sekine & Nobata, 2004) as well as a syntactic/semantic tagging process (McDonald et al., 2005) to assign candidate terms to categories. Categorical definitions arise from the Message Understanding Conference (MUC-7) Information Retrieval task and encompass the entities of
6
date, location, money, organization, percentage, person and time. This more abstract representational method allows for better generalization of previously unseen terms and does not possess the scalability problems associated with a semantics-only approach. A fourth representational technique is Proper Nouns which functions as an intermediary between Noun Phrases and Named Entities. This representation is a subset of Noun Phrases that names specific nouns while at the same time is a superset of Named Entities without the constraint of specific category assignment. This representation was found to be useful by removing the ambiguity associated with particular proper nouns which could either be represented by more than one named entity or fall outside one of the seven defined Named Entity categories. In a comparison study using these four representational techniques, it was found that Proper Noun representation was more effective in symbolizing financial news articles (Schumaker & Chen, 2006). Simply assigning one representational mechanism is not sufficient to address the scalability issues associated with large datasets. One way to approach this problem is to introduce a threshold of term frequency (Joachims, 1998). This method uses a term frequency cut-off to represent terms that appear more frequently. It has the dual effect of eliminating noise from lesser used terms as well as reducing the number of features represented. Following this line of research, machine learning algorithms are unable to process these raw terms and require an additional layer of representation. One method is to represent the terms in binary where the term is either present or not in a given article (Joachims, 1998). This leads to sparse matrices where the number of represented terms throughout the dataset will greatly outnumber the terms used in an individual article. Once article terms have been represented, machine learning algorithms can then be applied. One method, Support Vector Regression (SVR), a derivative of Support Vector
7
Machines (SVM) (Vapnik, 1995), is the regression equivalent of SVM but without the aspect of classification. Like SVM, SVR attempts to minimize its fitting error while maximizing its goal function by fitting a regression estimate through a multi-dimensional hyperplane. This method is also well-suited to handling textual input as binary representations and has been used in similar financial news studies (Schumaker & Chen, 2008; Tay & Cao, 2001). In a more specific study on the role of financial news articles to predict stock movement direction, Lavrenko tested the effects of training on the entire universe of news articles (Universal-training) and training based on articles for a specific company (Stock Specifictraining) (Lavrenko et al., 2000a). From this study, it was found that training a system on Stockspecific news articles led to more accurate predictions of price direction. It was reasoned that keywords specific to the company were more influential in determining price direction than the collection of terms from a universe of diverse sectors and industries. In a similar vein, it was also found that training a system on Universal keywords led to lower variances and more uniform predictions than the Stock-specific counterparts. One of the limitations of this study was the absence of evaluation for in-between company groupings along similar sector and industrial pairings.
2.4 Industry Classification In order to investigate the effect of grouping similar companies together, there are several different Industry classification standards that group companies with similar outputs. The first of which is the Standard Industrial Classification (SIC) system that was developed during the 1930’s as a way to categorize industrial production. Using a four digit numeric code, this system was a relatively flat structure without hierarchy that grouped similar industries together with somewhat close numeric codes. Replacing the SIC in the mid-90s was the North American
8
Industry Classification System (NAICS) which was designed for the industries of the United States, Canada and Mexico. This six-digit system utilized a five-level hierarchy of Sector, SubSector, Industry Group, Industry and Nationality where Sector used the first two digits and each successive level used an additional digit. A similar classification system developed by Morgan Stanley specifically for global commerce was the Global Industry Classification Standard (GICS). This system, which is used by Standard and Poors, employs an eight-digit, four-level hierarchy where each successive two digit pair indicates a deeper level in the hierarchy: Sector, Industry Group, Industry and Sub-Sector. In a comparison study of various industry classification systems, it was found that the GICS system of classification was more homogeneous and had lower variances in the calculated returns as compared to SIC and NAICS (Bhojraj et al., 2003). In a similar study of industry classification schemes versus analyst specialties, it was found that the GICS system best described the areas of expertise described by stock analysts (Boni & Womack, 2004). The homogeneity of company partitions was best matched against those industry partitions followed by professional analysts.
2.5 Prediction Experts and Quantitative Techniques Among trading professionals and the Internet, there is no shortage of stock advice. While some of this free advice may be susceptible to bias and market manipulation, subscription-based forecasts may not necessarily be better. There has also been a recent resurgence of interest in quantitative investing where computer programs are given some degree of control over financial investments. These systems can be constrained to analyze financial data and either issue recommendations or complete trades. While these entities may be less susceptible to biases, they are vulnerable to variable movement outside of defined parameters and are unable to evaluate market intangibles (Jelveh, 2006).
9
2.5.1 Prediction Experts In a study between trading professionals and laypeople, both groups were given information on two stocks and were asked to select the better performer (Torngren & Montgomery, 2004). It was found that trading professionals averaged 40% accuracy, well-below chance as compared to 58% accuracy for laypeople. The study concluded that selection errors were attributable to overconfidence and the failure to weight information uncertainty. A similar study pitted trading professionals against two groups of students in pricing a series of options (Abbink & Rockenbach, 2006). This study resulted in the student groups having an 88% and 90% payoff respectively, compared to an 80% payoff for the trading professionals. In both the laypeople and student studies, it was discovered that participants without much investing experience were employing simple heuristics to derive their answers. By contrast, trading professionals relied more on intuition than training. As for trading professionals, there are many available and across a broad spectra of media that provide free advice and are reasonably easy to web mine. One of which is Jim Cramer, host of the CNBC Mad Money television show. Cramer is a former hedge-fund manager who boasts 24% returns over his 13 year tenure. He provides a daily list of recommendations for stocks he feels should be bought and sold. Jim Jubak, Senior Markets Editor for MSN Money, is another professional advice expert. Jubak has served as editor and contributor to several print and Internet publications with a self-reported 14% annual return on his selections. He provides a list of buy recommendations three times a week. DayTraders.com is an Internet stock recommendation service with the self-reported goal of achieving 2-3% returns per week. This service provides daily buy/sell recommendations.
10
2.5.2 Quantitative Techniques The computational prediction of security markets follows two distinct paths, the first of which parallels information markets where an artificial market is constructed and predictions are made by varying system inputs (LeBaron et al., 1999; Raberto et al., 2001; Raberto et al., 2003). These inputs could be as simple as varying the time in which new information is received and acted upon (LeBaron et al., 1999) or more complex such as the modeling of an entire stock market exchange (Raberto et al., 2003). The second computational security prediction type is that of a quantitative nature. In real market predictions, quantitative systems, or quants, follow various stock parameters and are essentially automated versions of existing market strategies (e.g., look for high growth, unvalued securities, etc.) except with the ability to follow all stocks in real-time. This advantage has led quants to steadily outperform market averages by 2-3% for the past several years (Jelveh, 2006). While the exact strategies used are a closely guarded secret, some quantitative funds do disclose the parameters they track. The exact number and weights assigned to these parameters fluctuate frequently to keep pace with market conditions and to tweak model performance. Quant programs are also becoming a part of the individual investor’s toolbox as well. Wealth Lab Pro software (www.wealth-lab.com) allows individual investors to track upwards of 600 parameters through 1,000 pre-set investment strategies (Lucchetti & Lahart, 2006) and many brokerage houses are giving their investors quantitative software as a customer retention tool. The number of quant funds has increased from just a few in 2001 to over 150 by the beginning of 2006 (Burke, 2006). These funds have also branched themselves out, able to cover worldwide financial markets or focus exclusively on a select boutique of securities.
11
2.6 Research Gaps From our survey of the literature, we identified several potential gaps. First, machine learning systems have only been tested on either Universal financial news articles or on a StockSpecific basis. Training a system using a a hybrid of the two may result in more accurate results and a better-tuned prediction. Second, we are unaware of any system which has been compared against both trading professionals and existing quantitative systems. While there are several studies which pit professionals against non-professionals and some mechanized techniques against others, it would be useful to make a broad comparison as a baseline evaluation to see just how well a financial news prediction system compares. From these gaps, we have formulated a couple of research questions with which to explore. The first of which is: •
What effect does GICS partitioning of articles have on the prediction of stock price?
Following Bhojraj’s conclusion that GICS classification is superior in its homogeneity of industries (Bhojraj et al., 2003), we propose to investigate the prediction accuracy of a system that explores the in-between areas of Sector and Industry-level grouping and what impact it may have on prediction results. The second research question we pursue is: •
How effective is a discrete prediction model versus the market and human traders?
Given our system, how does its predictive ability compare to the advice given by trading professionals, quantitative funds and the overall market in general?
3. System Design The AZFinText system builds upon several fields of prior research in linguistics, textual representation, machine learning and application of itself to a problem in finance. While the AZFinText system does not add anything new to these fields themselves, its contribution is the 12
creation of the system itself which weaves together these disparate fields in the pursuit of solving a discrete prediction problem. The main goal of AZFinText is to learn what article terms are going to have an impact on stock prices, how much of an impact they will have, and then make an estimate of what the stock price is going to be 20 minutes into the future. This period of 20 minutes was derived from the prior work of Gidofalvi (Gidofalvi, 2001). The premise is that certain article terms such as “factory exploded” or “workers strike” will have a depressing effect on stock prices whereas other article terms like “earnings rose” will have an increasing effect. To properly evaluate our research questions, we designed the AZFinText system. Figure 1 illustrates the AZFinText system design.
Figure 1. AZFinText system design. In examining the AZFinText system from Figure 1, there are several major components to describe. The Textual Analysis component gathers financial news articles from Yahoo! Finance and represents them by their proper nouns. This module further limits extracted features to three or more occurrences in any document, which cuts down the noise from rarely used terms (Joachims, 1998). To identify the proper nouns we chose a modified version of the Arizona Text
13
Extractor (AzTeK) system which performs semantic/syntactic word level tagging as well as phrase-based aggregation. AzTeK works by using a syntactic tagger to identify and aggregate the document’s noun phrases and was found to have an 85% F-measure for both precision and recall, which is comparable to other tools (Tolle & Chen, 2000). Although the AzTeK system was selected due to availability, it performs adequately for proper noun extraction. However, there are many other such systems as reported in the Message Understanding Conference (McDonald et al., 2005), which can be adopted for financial news text analysis. The second major component is Stock Quotations which gathers stock price data in one minute increments. The third major component is Model Building. This component has derived from prior empirical testing and includes article term representations and the stock price at the time the news article was released. This combination of parameters was previously tested and judged to provide superior performance to all combinations tested (Schumaker & Chen, 2006). The fourth major component is the Trading Experts which gathers the daily buy/sell recommendations from a variety of trading experts. Lastly, the metrics component evaluates system output. To illustrate how the AZFinText system works, we offer a sample news article (Burns & Wutkowski, Nov. 15, 2005) and step through the logic of our system. Schwab shares fell as much as 5.3 percent in morning trading on the New York Stock Exchange but later recouped some of the loss. San Francisco-based Schwab expects fourth-quarter profit of about 14 cents per share two cents below what it reported for the third quarter citing the impact of fee waivers a new national advertising campaign and severance charges. Analysts polled by Reuters Estimates on average had forecast profit of 16 cents per share for the fourth quarter. In September Schwab said it would drop account service fees and order handling charges its seventh price cut since May 2004. Chris Dodds the company s chief financial officer in a statement said the fee waivers and ad campaign will reduce fourth-quarter pre-tax profit by $40 million while severance charges at Schwab s U.S. Trust unit for wealthy clients will cut profit by $10 million. The NYSE fined Schwab for not adequately protecting clients from investment advisers who misappropriated assets using such methods as the forging of checks and authorization letters. The improper activity took place from 1998 through the first quarter of 2003 the NYSE said. This case is a stern reminder that firms must have adequate procedures to supervise and control transfers of assets from customer accounts said Susan Merrill the Big Board s enforcement chief. It goes to the heart of customers expectations that their money is safe. Schwab also agreed to hire an outside consultant to review policies and procedures for the disbursement of customer assets and detection of possible misappropriations the NYSE said. Company spokeswoman Alison Wertheim said
14
neither Schwab nor its employees were involved in the wrongdoing which she said was largely the fault of one party. She said Schwab has implemented a state-of-the-art surveillance system and improved its controls to monitor independent investment advisers. According to the NYSE Schwab serves about 5 000 independent advisers who handle about 1.3 million accounts. Separately Schwab said October client daily average trades a closely watched indicator of customer activity rose 10 percent from September to 258 900 though total client assets fell 1 percent to $1.152 trillion. Schwab shares fell 36 cents to $15.64 in morning trading on the Big Board after earlier falling to $15.16. (Additional reporting by Dan Burns and Karey Wutkowski)
Figure 2. Example AZFinText representation. Figure 2 shows a sample run using the previous article. The extracted terms are represented in binary as either present or not. Supposing our corpus also contained the term Reuters which appeared in a different article and not in this instantiation, the term is given a zero for not being present in the current article. Terms are then filtered and only the proper nouns continue on for further analysis. For stock quotation data, we lookup what the stock price was at the time of article release ($15.65), and lookup the actual +20 minute stock price for training and later evaluation ($15.59). This data (e.g., the proper noun matrix and stock price at the time the article was released) is then taken to the Model Building stage where the various models are given their appropriate data. These models are the different categories of GICS classification. For GICS Sectors, a model of GICS Sector 10 – Energy is built using only those articles (and
15
prices at the time the article was released) of S&P 500 companies within this sector. Likewise additional models of other GICS Sectors, Industry Groups, Industries, and Sub-Industries are similarly built. The model is then given to the SVR algorithm where machine learning takes place and an estimate of the +20 minute stock price is produced ($15.645). We can see from the stock prices given in this example that Schwab’s share price dropped six cents while the model estimate figures a more conservative half penny drop. The heart of the AZFinText system is the SVR algorithm. It receives a matrix of proper noun terms, represented in binary as being present in the financial news article or not, the stock price at the time the article was released and is further restricted by the model chosen to include only the articles/terms/data within the sector, group, industry or sub-industry. The SVR algorithm then builds a hyperplane using the article terms and stock price and makes a prediction of what the price should be 20 minutes into the future for each news article. Once the predictions are made, measurements are taken to evaluate the accuracy of the results. The first metric we use is a measure of Closeness which evaluates the accuracy of the predicted discrete value to the actual future price (Cho et al., 1999). It does so by calculating the Mean Square Error (MSE) of the predicted values versus the actual +20min stock price. The second metric is Directional Accuracy. This metric simply analyzes the direction of the predicted value versus the direction of the actual +20min stock price with respect to the price at the time the article was released (Gidofalvi, 2001). The third metric we use is a Simulated Trading Engine which evaluates the potential gain/loss of our predictions. This metric examined the difference between the predicted price and the price at the time the article was released. If an absolute value was more than 1%, the system will then buy or short the stock depending upon the direction of the prediction (Lavrenko et al., 2000a). Our system differed slightly from
16
Lavrenko’s in that we invested blocks of $1,000 compared to Lavrenko’s $10,000. We then divest our holdings and take the +20min stock price to derive our potential gain/loss. Since the actual +20min stock price in our example was $15.59, our measures of Closeness for this particular example is 0.003025. With the stock price at the time the article was released at $15.65 and going in the same direction as our prediction, we pass the Directional Accuracy test for this article. Since the predicted price was less than 1% movement from the original stock price, our Simulated Trading Engine declines to make a trade based on this article.
4. Experimental Design For our experiment, we selected a consecutive period of time to serve as our experimental baseline. We selected a five-week research period of Oct. 26, 2005 to Nov. 28, 2005, which incorporates twenty-three trading days. The five-week period of study was selected because it gathered a comparable number of articles in comparison to prior studies: 6,602 for Mittermayer (Mittermayer, 2004) and 5,500 for Gidofalvi (Gidofalvi, 2001). We also observe that the fiveweek period chosen did not have unusual market conditions and would be a good testbed for our evaluation. To identify companies with more financial news, we further limited the scope of activity to focus on companies listed in the S&P 500 as of Oct. 3, 2005. Articles gathered during this period were restricted to occur between the hours of 10:30am and 3:40pm. While trading starts at 9:30am, we felt it important to reduce the impact of overnight news on stock prices and selected a period of one-hour to allow prices to adjust. The 3:40pm cut-off for news articles was selected to disallow any +20 minute stock predictions to occur after market hours. A further constraint was introduced to reduce the effects of confounding variables, where two articles on the same company cannot exist within twenty minutes of each other or both will be discarded.
17
Raw Number over study period Filtered article used by AZFinText Articles in Mittermayer's study Articles in Gidofalvi's study
# Articles 9,211 2,809 6,602 5,500
Table 1. Article collections. The above processes had filtered the 9,211 candidate news articles gathered during this period to 2,809, where the majority of discarded articles occurred outside of market hours, as shown in Table 1. Similarly, 10,259,042 per-minute stock quotations were gathered during this period. This large testbed of time-tagged articles and fine-grain stock quotations allow us to perform our evaluation systematically. For the machine learning algorithm we chose to implement the SVR Sequential Minimal Optimization (SMO) (Platt, 1999) function through Weka (Witten & Eibe, 2005). This function allows for discrete numeric prediction instead of classification. We selected a linear kernel and ten-fold cross validation. A similar prediction method was employed in the forecasting of futures contracts (Tay & Cao, 2001). To test the effects of GICS partitioning, we trained our system on keywords for all stocks, each GICS Sector, Industry Group, Industry and SubIndustry, as well as trained on articles for each specific company. Output from these models are then evaluated on a three metric platform consistent with prior research (Schumaker & Chen, 2006). To provide an overall sense of the data used throughout this experiment for the different classification models, we present Table 2 to illustrate some basic statistics on our dataset.
18
Number of GICS Categories Usable Categories Minimum Number of Firms per Category Maximum Number of Firms per Category Average Number of Firms per Category Standard Deviation of Firms per Category Minimum Number of Articles per Category Maximum Number of Articles per Category Average Number of Articles per Category Standard Deviation of Articles per Category Minimum Number of Terms per Category Maximum Number of Terms per Category Average Number of Terms per Category Standard Deviation of Terms per Category
Universal 1 1
500
2,809
3,710
Sector Industry Group 10 24 10 24 9 6 89 36 50 21 26.7 9.8 100 16 518 266 281 117 160.8 66.0 242 57 974 606 567 288 291.7 134.4
Industry 61 50 1 22 10 5.6 11 150 55 37.6 42 415 158 88.5
Sub-Industry Stock-Specific 119 500 76 71 1 16 5 3.6 10 10 139 58 34 18 28.3 9.1 23 15 377 194 105 61 67.8 30.8
Table 2. Basic statistics on the AZFinText datasets. There are several facets of the above table which deserve further explanation. The first of which is that within the categories of Industry, Sub-Industry and Stock Specific, the number of GICS categories does not equal the number of usable categories. This is because of the GICS categories having fewer than ten news articles available for training which reduces the number of categories that can be used. We examined the role of decreasing articles and terms with each increasing level of classification and found that they had little impact on the results. To test our second research question on the effectiveness of the AZFinText against Professional Traders and quantitative funds, we arbitrarily selected a group of experts and funds for comparison. The experts we chose were Jim Cramer, Jim Jubak and DayTraders.com. Selection criteria mainly focused on the availability and ease of gathering recommendations in an automated fashion. However, we were conscious to spread out experts across a variety of media sources. We then invest $1,000 into each buy/short recommendation, buying at the opening price and then selling it at the close of trading. We further assume that there is a zero transaction cost, consistent with Lavrenko (Lavrenko et al., 2000a). Table 3 shows the recommendation breakdown for each of these Trading Professionals during our period of study. Cramer 322 164 291
Number of Buy Recommendations Number of Sell Recommendations Number of Unique Companies Mentioned
Jubak DayTraders.com 13 10 0 1 13 5
Table 3. Recommendation breakdown of each Trading Professional. 19
While Jubak and DayTraders.com had few trading recommendations during our period of study, we felt that their contribution would help add depth to the overall trading professionals’ advice. Similarly, since the gathered recommendations did not provide any predicted price information, we can only compare them to AZFinText using the Directional Accuracy metric. As for comparisons against quantitative funds, we selected the top ten performing quantitative mutual funds of 2005 (Burke, 2006). Since Quant trading strategies and predictions are closed-source, we gathered the observable fund prices at the beginning and end of our research period to make performance comparisons against our system using the Simulated Trading metric.
5. Experimental Findings and Discussion 5.1 Sector-based training has the best performance: To answer our first research question “What effect does GICS partitioning of articles have on the prediction of stock price?,” we trained our system on the different GICS classification levels and evaluated them with our three aforementioned metrics. Results are presented in Table 4.
Universal Sector Group Industry Sub-Industry Stock Specific
Closeness Directional Accuracy Simulated Trading Average Std Dev. Average Std Dev. Average Std Dev. 0.1081 58.17% 0.4933 2.86% 0.1085 0.0443 0.1954 3.7102 71.18% 0.4530 0.2192 8.50% 3.3129 23.1133 66.12% 0.4734 4.57% 0.1789 16.1087 71.2319 62.37% 0.4845 2.02% 0.1572 26.1330 102.6304 57.50% 0.4944 1.09% 0.1501 1.0443 2.7615 56.92% 0.4954 1.01% 0.1295
Table 4. Three metric evaluation of the different GICS levels. The first notable result is that Universal training has the lowest average Closeness score of 0.0443. Sector-based training had the highest Directional Accuracy and Simulated Trading scores of 71.18% and 8.50% respectively (p-values < 0.05). Comparing our results to the
20
Universal versus Stock Specific research conducted by Lavrenko, our Stock Specific model should have a lower Closeness score than Universal training (Lavrenko et al., 2000a). However, we observed the opposite result where Universal keywords had a lower Closeness score of 0.0443 as compared to Stock Specific’s 1.0443. Returning to Lavrenko’s work, we should also expect to see lower variances with Universal training. Confirming this, Universal training had a standard deviation of 0.1081 as compared to 2.7615 for Stock Specific. We believe that the observed uniformity is a result of Universal’s homogenous keywords which behave similarly across all stocks. However, when we expand this work to include in-between GICS categories, Closeness scores gradually increase with each successive level and suddenly drop at Stock Specific training. Directional Accuracy and Simulated Trading appear to spike at the Sector level and then steadily decrease. We believe that this behavior is the result of small inconsistencies within the GICS categories. We further investigated whether the reduction of either the number of articles or terms were a part of this phenomenon. However, when looking at the results of Stock Specific training, which used the least number of articles and terms, its numbers were somewhat similar to Universal, leaving the GICS categories with spiking behavior. Although both Bhojraj and Boni found the GICS classification system to be superior to similar systems (Bhojraj et al., 2003; Boni & Womack, 2004), its classifications are not perfect. Analyzing model performance across all levels including those of the GICS, we found that Sector-based training performed better than similar classifications. While Sector had the best Directional Accuracy score of 71.18% and Simulated Trading of 8.50% return, Sector also had the second-lowest Closeness score of 0.1954 to Universal’s 0.0443 (p-values < 0.05). This would seem to indicate that Sector-based training was better able to forecast stock price direction
21
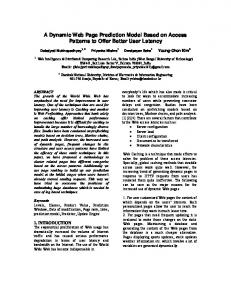
and capitalize on forecasted trades, yet was not as precise as Universal-training in obtaining a future price. To further investigate the reasons behind Sector’s predictive success, Figure 3 is a histogram of trade returns for the Sector model.
80 60 40 20 > 300
250
200
150
100
50
0
-50
0 < -100
Number of Occurrences
Histogram of Trade Returns
Trade Return ($)
Figure 3. Histogram of Trade Returns. From this figure, approximately 69% of trades had returns between -$100 and $100, however, the average is skewed towards the positive. It was also interesting to observe that 29 trades resulted in excess of $300 returns while only 5 trades lost $100 or more. This phenomenon was found to be a function of article length where longer articles contained more Proper Nouns and hence were more predictable. These returns arose from an outlay of $342,000 (i.e., 342 trades) and an excess return of $29,059. We present Table 5, which contains results for each metric and compares each to a composite index return over the five week period of study, for a deeper analysis into the components of each sector.
22
Sector Sector Name 10 Energy 15 Materials 20 Industrials 25 Consumer Discretionary 30 Consumer Staples 35 Health Care 40 Financials 45 Information Technology 50 Telecommunication Services 55 Utilities
Closeness 0.1951 3.8269 0.0206 0.0616 0.0218 0.0239 0.0189 0.0220 0.4684 0.0475
AZFinText Index Dir. Acc. Sim. Trade % Return 68.79% 17.50% 1.60% 5.50% 8.76% 63.00% 72.64% 2.10% 5.96% 70.04% 6.05% 19.40% 64.81% 2.60% 2.07% 70.15% -1.00% 4.28% 6.60% 8.25% 76.02% 72.59% 12.70% 6.47% 72.36% 0.50% 7.66% 68.24% -7.64% -4.30%
Table 5. Sector breakdown and evaluation. From this table, the Financials sector (Sector 40), had the lowest Closeness score of 0.0189, the highest Directional Accuracy, 76.02% and a Simulated Trading return of 6.60% (pvalues < 0.05). However, this trading return did not outperform the market’s composite Financials return of 8.25%. In a similar vein, the Materials sector, Sector 15, performed the worst with a Closeness score of 3.8269, Directional Accuracy of 63.00% and Simulated Trading return of 5.50% compared to the market’s Materials composite of 8.76%. Sector 25, Consumer Discretionary, had the best Simulated Trading return of 19.40% while Sector 55, Utilities, had the worst return of -4.30% but did manage to lessen the loss of the composite average at -7.64%. To answer the follow-up question of why the Consumer Discretionary sector performed better than Utilities, we further investigated the Simulated Trading results of the constituent companies within each sector. Table 6 illustrates the component companies for Consumer Discretionary while Table 7 shows the same for Utilities. While not salient from Tables 5 and 6, Consumer Discretionary had 11 trades for 9 companies with $0 gain/loss and Utilities had 2 trades for 2 companies with $0 gain/loss.
23
Consumer Discretionary Sector Simulated Trading Engine Company # Trades Gain/Loss % Return BBY 2 $2 0.20% BLI 4 -$6 -0.60% CC 1 $1 0.10% CCL 1 $1 0.10% CTB 3 -$1 -0.10% CTX 1 $10 1.00% DCN 1 $2 0.20% DDS 1 $6 0.60% DHI 2 $4 0.40% DJ 1 $6 0.60% EBAY 3 $8 0.80% EK 2 $9 0.90% F 13 -$5 -0.50% FD 1 $3 0.30% FO 2 $12 1.20% GM 4 $24 2.40% GPS 3 $8 0.80% GT 1 $11 1.10% HAS 1 $2 0.20% HOT 1 $5 0.50% HRB 1 $2 0.20% IGT 1 $6 0.60% JCP 1 $9 0.90% KSS 1 -$1 -0.10% NYT 1 $4 0.40% OMX 1 $3 0.30% TGT 2 $4 0.40% TJX 4 $37 3.70% TWX 3 -$5 -0.50% VC 2 $22 2.20% YUM 1 $1 0.10%
Table 6. Company components of the Consumer Discretionary Sector. Utilities Sector Company AES CIN CPN DTE DUK DYN KSE NI PPL TE
Simulated Trading Engine # Trades Gain/Loss % Return 1 $2 0.20% 2 $8 0.80% 6 -$50 -5.00% 1 -$1 -0.10% 1 $2 0.20% 4 -$17 -1.70% 1 $7 0.70% 1 $2 0.20% 1 $1 0.10% 1 $1 0.10%
Table 7. Company components of the Utilities sector. From these tables, Simulated Trading made trades in 40 of the 89 Consumer Discretionary companies and 12 of the 33 Utility companies. Table 6 shows that company TJX, The TJX Companies Inc., posted the largest gains with a 3.70% return on investment compared
24
to a 10.15% increase over the five week period. For the Utilities sector of Table 7, there were quite a few low return transactions and the CPN, Calpine Corporation, trade with a -5.00% return further harmed the results of this sector. It is also notable that a good portion of trades in both Sectors netted returns of $5 or less.
5.2 Sector-based training outperforms Professional Traders & Quants: To answer our second research question “How effective is a discrete prediction model versus the market and human traders?,” we measured the Directional Accuracy of our Sectorbased approach versus the Trading Professionals. Results are given in Table 8. Dir. Acc. 71.18% 57.00% 69.23% 81.82%
Sector Cramer Jubak DayTraders
Table 8. Comparison of Directional Accuracy results. From this table, our Sector-based training performed better in Directional Accuracy (71.18%) than Jim Cramer at 57.00% and Jim Jubak at 69.23%, however, our system did not perform as well against DayTraders.com at 81.82% (p-values < 0.05). Even with statistical significance we must be mindful of the sparsity of stock recommendations from both Jubak and DayTraders.com. This sparsity of recommendations, as previously shown in Table 3, would suggest that Jim Jubak and DayTraders.com may be more conservative in their selection approaches. Comparing our system against both Trading Professionals and the top 10 quant funds according to their trailing one-year returns (Burke, 2006), results in the Simulated Trading are given in Table 9. Since quant trading strategies and predictions are closed-source, we could only gather observable price movements over our trading period and make comparisons using our Simulated Trading metric.
25
AZFinText S&P 500 Trading Professionals Cramer Jubak DayTraders.com Quantitative Funds ProFunds Ultra Japan Inv (UJPIX) ProFunds Ultra Japan Svc (UJPSX) American Century Global Gold Adv (ACGGX) American Century Global Gold Inv (BGEIX) Quantitative Advisors Emerging Markets Instl (QEMAX) Quantitative Advisors Emerging Markets Shs (QFFOX) Lord Abbett Small-Cap Value Y (LRSYX) Lord Abbett Small-Cap Value A (LRSCX) Quantitative Advisors Foreign Value Instl (QFVIX) Quantitative Advisors Foreign Value Shs (QFVOX)
Simulated Trading 8.50% 5.62% 0.15% -0.14% 0.46% 24.73% 24.59% 12.96% 12.93% 8.16% 8.15% 5.22% 5.19% 4.99% 4.95%
Table 9. Simulated Trading results of Professionals and Quants. As evidenced by this table, AZFinText with its 8.50% return outperformed the overall market, 5.62% and the trading professionals (p-values < 0.05). Comparing AZFinText against the top 10 quants shows AZFinText performed well, outperforming 6 of the top 10 quant funds. It is interesting to note that the four better performing quants were trading in the Nikkei and gold markets where AZFinText was constrained to the companies in the S&P 500. In making a more direct performance comparison, Table 10 shows the trade returns of AZFinText versus several quant funds which are also operating within the S&P 500. AZFinText Vanguard Growth & Income (VQNPX) BlackRock Investment Trust Portfolio Inv A (CEIAX) RiverSource Disciplined Equity Fund (ALEIX)
Return 8.50% 6.44% 5.48% 4.69%
Table 10. Simulated Trading results of S&P 500 quants. As shown in this table, AZFinText performed better than its peer quant funds. It is worthwhile to point out that AZFinText’s success came mostly from making predictions from financial news articles and stock quotes, whereas quants used sophisticated mathematical models
26
on a large set of financial variables. We believe that our research helps identify a promising research direction in financial text mining. However, more research is critically needed.
6. Conclusions and Future Directions The contribution of this research is to examine the feasibility of a textual-based processing system that can process large amounts of financial news articles and make discrete predictions from them (AZFinText). In particular, this piece of research looked at comparing AZFinText’s predictions against existing quantitative funds and human stock pricing experts. Using a triangulation of evaluation methods which have been used mostly independently of each other, we determined that Sector-based training had the better performance of the models tested. Sector had the best Directional Accuracy at 71.18% and Simulated Trading of 8.50% return on investment. Sector also had the second lowest Closeness score, 0.1954, as compared to Universal, 0.0443. This would seem to indicate that Sector-based training was better able to forecast stock price direction and capitalize on forecasted trades, yet was not as precise as Universal training in obtaining a future price. In an analysis of the individual Sectors we found that the Financials Sector was unusually predictive with a Closeness score of 0.0189 and Directional Accuracy at 76.02%. This would mean that this sector was more sensitive to our representations than others. When comparing the Sector-based approach to trading professionals, we found that AZFinText had a Directional Accuracy of 71.18%, which was second-best to DayTraders.com’s 81.82%. However, in Simulated Trading, Sector-based training performed the best with an 8.50% return and even outperformed six of the top ten quantitative funds. We believe that our system was better able to capitalize on the Proper Nouns presented at the Sector-level. This
27
ability translated to consistently better predictions than comparable human experts while reacting to market changes faster than the history-dependent quantitative funds. We feel it would be interesting to explore other machine learning techniques which can take advantage of the historical probabilities associated with stock prices. It would also be of merit to investigate stocks outside of the S&P 500. While S&P 500 stocks are widely followed by analysts and traders alike, smaller cap stocks may be more susceptible to share price movements from unexpected financial news.
References Abbink, K. & B. Rockenbach 2006. Option Pricing by Students and Professional Traders: A Behavioural Investigation. Managerial and Decision Economics 27(6): 497-510. Bhojraj, S., C. M. C. Lee, et al. 2003. What's My Line? A Comparison of Industry Classification Schemes for Capital Market Research. Journal of Accounting Research 41(5): 745-774. Boni, L. & K. L. Womack 2004. Industries, Analysts, and Price Momentum. Tuck School of Business Working Paper No. 03-12. Dartmouth College. Burke, K. 2006. Not the Man, But the Machine. Retrieved Sept. 1, 2006. Burns, D. & K. Wutkowski Nov. 15, 2005. Schwab to miss forecast, fined by NYSE. Excerpted from: http://biz.yahoo.com/rb/051115/financial_schwab.html?.v=3. Retrieved from Yahoo! News. Camerer, C. & K. Weigelt 1991. Information Mirages in Experimental Asset Markets. Journal of Business 64(4): 463-493. Chan, L., N. Jegadeesh, et al. 1996. Momentum Strategies. The Journal of Finance 51(5): 16811713. Cho, V., B. Wuthrich, et al. 1999. Text Processing for Classification. Journal of Computational Intelligence in Finance 7(2). Fama, E. 1964. The Behavior of Stock Market Prices. Graduate School of Business. University of Chicago. Gidofalvi, G. 2001. Using News Articles to Predict Stock Price Movements. Department of Computer Science and Engineering. University of California, San Diego. Jelveh, Z. 2006. How a Computer Knows What Many Managers Don't. The New York Times. Joachims, T. 1998. Text Categorization with Support Vector Machines: Learning with Many Relevant Features. In Proceedings of the 10th European Conference on Machine Learning. Springer-Verlag, 137-142. Lavrenko, V., M. Schmill, et al. 2000b. Mining of Concurrent Text and Time Series. International Knowledge Discovery and Data Mining, Boston, MA. Lavrenko, V., M. Schmill, et al. 2000a. Language Models for Financial News Recommendation. International Conference on Information and Knowledge Management, Washington, DC. LeBaron, B., W. B. Arthur, et al. 1999. Time Series Properties of an Artificial Stock Market. Journal of Economic Dynamics and Control 23(9-10): 1487-1516.
28
Lucchetti, A. & J. Lahart 2006. Your Portfolio on AutoPilot; Brokerages Roll Out Software to Automate Trading Strategies; Risks of Becoming a 'Quant'. Wall Street Journal. New York: B1. Malkiel, B. G. 1973. A Random Walk Down Wall Street. W.W. Norton & Company Ltd., New York. McDonald, D. M., H. Chen, et al. 2005. Transforming Open-Source Documents to Terror Networks: The Arizona TerrorNet. American Association for Artificial Intelligence Conference Spring Symposia, Stanford, CA. Mittermayer, M. 2004. Forecasting Intraday Stock Price Trends with Text Mining Techniques. Hawaii International Conference on System Sciences, Kailua-Kona, HI. Platt, J. C. 1999. Fast training of support vector machines using sequential minimal optimization. In Advances in kernel methods: support vector learning. MIT Press, 185-208. Raberto, M., S. Cincotti, et al. 2001. Agent-based Simulation of a Financial Market. Physica A: Statistical Mechanics and its Applications 299(1-2): 319-327. Raberto, M., S. Cincotti, et al. 2003. Traders' Long-run Wealth in an Artificial Financial Market. Computational Economics 22(2): 255-272. Schumaker, R. P. & H. Chen 2006. Textual Analysis of Stock Market Prediction Using Financial News Articles. 12th Americas Conference on Information Systems (AMCIS-2006), Acapulco, Mexico. Schumaker, R. P. & H. Chen 2008. Evaluating a News-Aware Quantitative Trader: The Effects of Momentum and Contrarian Stock Selection Strategies. Journal of the American Society for Information Science 59(2): 247-255. Sekine, S. & C. Nobata 2004. Definition, dictionaries and tagger for Extended Named Entity Hierarchy. Proceedings of the LREC, Lisbon, Portugal. Seo, Y.-W., J. Giampapa, et al. 2002. Text Classification for Intelligent Portfolio Management. Technical Report CMU-RI-TR-02-14. Carnegie Mellon University. Shmilovici, A., Y. Alon-Brimer, et al. 2003. Using a Stochastic Complexity Measure to Check the Efficient Market Hypothesis. Computational Economics 22(2-3): 273-284. Tay, F. & L. Cao 2001. Application of Support Vector Machines in Financial Time Series Forecasting. Omega 29: 309-317. Technical-Analysis 2005. The Trader's Glossary of Technical Terms and Topics. Retrieved Mar. 15, 2005. Tolle, K. M. & H. Chen 2000. Comparing Noun Phrasing Techniques for Use with Medical Digital Library Tools. Journal of the American Society for Information Science 51(4): 352-370. Torngren, G. & H. Montgomery 2004. Worse than Chance? Performance and Confidence Among Professionals and Laypeople in the Stock Market. The Journal of Behavioral Finance 5(3): 148-153. Vapnik, V. 1995. The Nature of Statistical Learning Theory. Springer, New York. Witten, I. H. & F. Eibe 2005. Data Mining: Practical Machine Learning Tools and Techniques. Morgan Kaufmann, San Francisco. Wuthrich, B., V. Cho, et al. 1998. Daily Stock Market Forecast from Textual Web Data. IEEE International Conference on Systems, Man, and Cybernetics, San Diego, CA. Yoon, Y. & G. Swales 1991. Predicting Stock Price Performance: A Neural Network Approach. 24th Hawaii International Conference on System Sciences, Waikoloa, HI.
29