JOURNAL OF APPLIED MEASUREMENT, 6(2), 202–223 Copyright© 2005
A Rank-Ordering Method for Equating Tests by Expert Judgment Tom Bramley University of Cambridge
This paper describes a new method of comparing the raw mark scales on two tests using expert judgment. The two tests do not need to have any common items, nor to be taken by common groups of candidates. This study used scripts (i.e. the complete work of a candidate on the test) from England’s National Curriculum Test for Reading at Key Stage 3 (14-year olds) in 2003 and 2004. Each member of a panel of 12 experts was given four packs each containing ten scripts—five scripts from each year’s test. Marks and annotations from these scripts had been removed. Their task was to put the ten scripts into a single rank order, based on a holistic judgment of the level of performance exhibited in each. Because the design of the study linked scripts across judges and packs it was possible to construct a single latent trait of judged quality of performance. This was done using two different analytical methods: the Rasch formulation of Thurstone paired comparisons, and the Rasch Partial Credit model. Relating the two raw mark scales to the single latent scale allowed the two years’ tests to be equated. The merits of using this standard-maintaining method as opposed to a standard-setting method in this particular context are discussed.
Requests for reprints should be sent to Tom Bramley, Assessment Directorate—Evaluation & Validation Unit, University of Cambridge Local Examinations Syndicate, 1 Hills Road, Cambridge, CB1 2EU, United Kingdom e-mail:
[email protected].
A RANK-ORDERING METHOD FOR EQUATING TESTS 203
Introduction The National Curriculum (NC) tests at Key Stage 3 (KS3) for pupils in England are summative tests of attainment for pupils aged 14. The results are used both to monitor national standards and to compile ‘league tables’ of school performance. Each pupil taking a KS3 test will achieve a ‘level’ from 3 to 7. The cut-off points on the raw score scale of the test marking the transition from one level to the next may change from year to year to allow for differences in the difficulty of the test from year to year. It is therefore important to ensure that these cut-scores do in fact represent the same standard of attainment from one year to the next. Several exercises designed to maintain the standard of the test are carried out. These are listed below: 1. Statistical equating using pre-test data. This involves one or more of several well-known equating designs, most often the equivalentgroups design or the Anchor-test - non-equivalent-groups design (Petersen et al. 1989). 2. Judgmental exercises using practising teachers. A variety of methods (outlined briefly below) are used here depending on the subject area of the test. The rank-ordering method described in this paper is a new example of one of these methods. 3. Scrutiny of ‘live’ scripts by panels of senior markers. This exercise takes place after the test has been marked, but before the cut-scores have been finally confirmed. 4. ‘Impact data’ using the live test raw score distribution from a sample of around 20 000 pupils—this gives a very good indication of the consequences of each set of proposed cut-scores on the proportion of pupils who will achieve each level. The KS3 English test is a 100-mark test assessing two separate elements—Reading and Writing, each 50 marks. Since 2003, pupils have been awarded a level for each of these elements separately, as well as an overall level. The cutscores for each element are derived separately, then added together to give the overall cut-scores.
The rank-ordering exercise described in this paper was carried out on the Reading element of the test, which comprises a 32-mark element made up of short-answer reading comprehension questions to three different texts, and a single longer piece of writing (worth 18 marks) assessing understanding of scenes from a Shakespeare play which pupils have been studying in their schools. The word ‘script’ is used to refer to the complete work of a single pupil on the Reading element of the test. (‘Reading’ will be capitalised throughout this paper to indicate the latent trait of Reading ability defined by the particular combination of test questions, pupil performance and scoring rubric which combine to generate the raw scores on the test). Judgmental standard-setting exercises For tests comprising short-answer questions the most common standard-setting method used (in the NC KS3 tests) has been the modified Angoff method (Angoff, 1971). In recent years this has been replaced by the Bookmark method (Lewis et al., 1999; Mitzel et al., 2001). Both these methods are based on expert judgment of the hypothetical performance of pupils on test items and do not require scripts to be available. The Bookmark method requires the items to have been calibrated with the Rasch model or an IRT model. For tests comprising questions which require an extended written response from the candidate, two methods have been commonly used in the NC KS3 context: •
A ‘Draft Script Scrutiny’ where panels of senior markers (or teachers) make judgments about the quality of work on pre-test scripts and decide which marks on the raw score scale represent the transition between adjacent levels;
•
The ‘Script Placement’ method developed by the National Foundation for Educational Research (NFER) where panels of judges are given packs of scripts in ascending order of raw score (but from which the mark totals and annotations have been removed). The
204
BRAMLEY
judgmental task is to pick the script in the pack which best represents threshold performance between two adjacent levels. The median mark on this script across judges and packs represents the cut-score for that particular level boundary. The present research was motivated by a desire to avoid the requirement in both the above methods for judges to use an abstract internalised standard to make their judgments. There is plenty of evidence from psychology that humans are much better at making comparative judgments than absolute judgments (e.g. Nunnally, 1967; Laming, 2004). Laming (op. cit.) even goes as far as to say that “There is no absolute judgment. All judgments are comparisons of one thing with another.” If judges have internalised different standards (i.e. if some are ‘severe’ or ‘lenient’ in terms of conventional rater studies (e.g. Myford and Wolfe, 2003)) then the outcome of an exercise requiring absolute judgments will depend on the particular internal standards of those judges. However, if the judgment involves a comparison between concrete objects then it is possible for the internal standard of the judge to ‘cancel out’ in the same way that item difficulties cancel out when estimating the difference in abilities between persons using the simple dichotomous Rasch model (Rasch, 1960; Wright, 1977). Furthermore, given that one main aim is to maintain standards year-on-year, it seemed that involving the previous year’s scripts in the judgmental exercise would be a considerable advantage. The issue of standard setting versus standard maintaining is explored further in the discussion. Thurstone paired comparisons The most obvious experimental procedure involving concrete comparisons is Thurstone’s paired comparison method (Thurstone, 1927). In this method, pairs of objects are compared with respect to a single attribute which is conceived as being represented in the judge’s mind as a psychological latent trait. In the context of this paper, the objects are scripts and the latent trait is ‘judged quality of performance’. According to
Thurstone’s model, the further apart each pair of objects on the latent trait, the greater the probability that the object at the higher position will be judged the ‘winner’ of the comparison (how the comparison is phrased depends on the relevant attribute). Different assumptions lead to different statistical formulations of the model— one of the simplest and most computationally tractable is a Rasch formulation (Andrich, 1978) where the parameters representing ‘judge effects’ are eliminated. The paired comparisons method has become popular in the UK in research exercises comparing the standard of qualifications awarded by different awarding bodies in the same academic subject (e.g., Elliott and Greatorex, 2002; Fearnley, 2000; Forster and Gray, 2000). However, a couple of studies carried out in the late 1990s (Bell et al., 1998; Bramley et al., 1998) had encouraged a search for a valid alternative to the Thurstone method. The experience of administering those studies showed that the repetition and sheer number of judgments required by this method made the task extremely tedious for the judge panel involved. Also, it is questionable whether one of the fundamental assumptions of the Thurstone method, namely that each paired comparison is independent of previous comparisons, is tenable when the objects being compared are as complex as pupils’ scripts. This is because it is very likely that each script will be remembered by the judges when they encounter it on future comparisons—far more so than (say) in psychophysical experiments where the objects are compared in relation to a simple trait such as perceived brightness or weight. Rank-ordering A method based on rank-ordering seemed the most promising alternative. Placing objects into rank order is a familiar task and one which has been shown to be valid in terms of the correlation between teacher rankings and student test performance (e.g. Hopkins et al., 1985). The question is how best to analyse the resulting data. Linacre (1992) developed a full Rasch model for rank-ordered data, based on extending the paired comparison model to include comparison of
A RANK-ORDERING METHOD FOR EQUATING TESTS 205
multiple objects whilst allowing for the constraints imposed by a ranking (see below). The Rasch formulation of the Thurstone model is a special case of this more general model. However, this general model is difficult to apply since it requires large computational resources, even with modern computers. Two possible Raschbased approximations are: 1. To derive paired comparison data from the rank orderings—for example a rank ordering of 10 objects would yield 45 paired comparisons (1 beats 2, 1 beats 3 etc). 2. To treat each separate rank-ordering as a partial credit item. Each score category on the ‘item’ is occupied by a single object. The data can then be analysed using the Partial Credit model (Wright and Masters, 1982). The first approximation has been described by Linacre (1994). One obvious disadvantage is that the ranking severely constrains the possible paired comparison outcomes—in other words the assumption of local independence is violated. For example, if A is ranked above B and B is ranked above C then this will yield the paired comparisons: A beats B, B beats C, and A beats C. It is not possible for C to beat A, whereas this sort of inconsistent triad is possible when using the proper paired comparison method. One consequence of using this approximation is that the statistical separation of the objects on the latent trait will be over-estimated. The second approximation has also been suggested by Linacre (Linacre, 1992; Linacre and Wright, 1994; personal communication, 2003) as an acceptable method for modelling rank-ordered data. One disadvantage of this method is that judge fit statistics are not as readily available because each ranking, rather than each judge, forms the second measured facet.
Methodology Script selection The 2003 scripts were a set of 40 photocopied scripts obtained from the marking of the 2003 live test. These scripts covered a range of mark totals from 10 to 46 (out of a maximum of 50).
One of the photocopies was illegible due to the faintness of the photocopy and could not be used in the study. The 2004 scripts were selected from those used in the pre-test of the 2004 test. Originally 40 scripts were selected covering a range of marks from 6 to 45 with the aim of having one script on each mark where possible. Fourteen of these scripts had been used either for marker training or for exemplar material so could not be used. Eight suitable replacements were found, leaving a total of 34 scripts from 2004 in the exercise. Each script was given a 4-character identifier which began S3** or S4** according to whether the script was from 2003 or 2004. The final two digits were random selections from 01 to 40, without replacement. The script ID therefore did indicate which year the script came from (which would have been obvious anyway from the content) but did not indicate what mark it had obtained. The script IDs and corresponding mark totals are shown in Table A1 in the appendix. All mark totals were removed from the scripts, and the individual marks were removed from the two five-mark questions on the Reading paper, and the Shakespeare task. This was to ensure that all judgments were based on holistic features of performance, and not based on simply adding up the marks. Procedure A panel of twelve judges, all practising teachers of KS3 English, were invited to take part in the exercise. Before the exercise the judges were sent copies of the 2003 test and its mark scheme, and were asked to familiarise themselves with them. They were also asked to make a list of features of performance in Reading they would expect from pupils at different levels, based on their own classroom experience. The morning was used to allow the judges to familiarise themselves with the 2004 test (which could not be sent out in advance for security reasons, since the study took place before the live administration of the 2004 test), and to discuss their lists of features of performance. This discussion was led by the Lead Chief Marker for
206
BRAMLEY
KS3 English. The afternoon session was used for the actual rank-ordering exercise.
limited amount of time available for the exercise, given the amount of reading of scripts required.
For the rank-ordering, each judge was given four packs, each containing ten scripts. They were told that the first pack contained scripts with higher marks (in general) and that packs two to four contained scripts with successively lower marks (in general). However, they were warned that there was overlap between the quality of scripts in the different packs.
The final data set consisted of 4801 records: 12 judges × 4 packs × 10 scripts per pack. The rank order of the script within its pack was the datum collected for each record.
Five scripts in each pack were from 2003, and five were from 2004. The judges were told not to make any assumptions about the ‘correct’ ordering of the scripts in their pack—e.g. it was possible that all five scripts from one year might be better than all five from the other year, or that the scripts from one year might be much more spread out than the scripts from the other year. The design of the script allocation was fairly complex, and is shown in full in Table A2 in the appendix. The aim was to ensure a good linking of scripts across judges and packs, and to ensure that different combinations of balance (equal, 2003 with higher marks, 2004 with higher marks) and spread (both years narrower, both years wider, one of each) were employed. Finally the allocation was adjusted to minimise the number of times that a particular judge had to look at the same script across two packs. The judgmental task was simply to put the ten scripts in each pack into rank order, from best to worst, based on a holistic judgment of the level of performance exhibited in each. Tied ranks were allowed, but judges were encouraged to avoid these as much as possible. They were also reminded of the relative weight of the Reading paper (32 marks) and the Shakespeare task (18 marks) and asked to take this into account when making their judgments. The judges worked independently, without conferring with their colleagues.
Results and analysis The judges seemed to have no difficulty in understanding the instructions and carrying out the task. Only four tied rankings were awarded in total. The only constraining factor was the
Deriving a single scale of judged performance Because of the overlap of scripts across judges and packs, it was possible to create a single scale of judged performance out of these rankings. This was done in two ways, first by rearranging the data to represent a series of Thurstone paired comparisons, and second by treating each separate ranking as a Partial Credit test item. For the Thurstone analysis, the model fitted was: ln [Pij / (1-Pij)] = Bi - Bj where Pij = the probability that script i beats script j in a paired comparison, or, here, the probability that script i is ranked above script j by any judge in any pack; Bi = the measure for script i (higher measures correspond to ‘better’ scripts); Bj = the measure for script j. For the Partial Credit analysis, the model fitted was: ln [Pirk / Pir(k+1)] = Bi - Drk where Pirk = the probability that script i is ranked at position k in ranking r; Pir(k+1)= the probability that script i is ranked at position k+1 in ranking r; Bi
= the measure for script i (higher measures correspond to ‘better’ scripts);
Drk = the difficulty of scale category k relative to category k+1 in ranking r. Note that the scale categories are in reverse order compared with a normal Partial Credit scale because a lower number for rank position corresponds to a better script.
A RANK-ORDERING METHOD FOR EQUATING TESTS 207
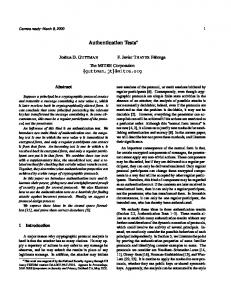
Both analyses were carried out using the FACETS program (Linacre, 1999). For the Thurstone pairs method, the four tied rankings were dropped from the analysis. This would not have had any effect since they constituted such a small proportion (< 0.2%) of all the paired comparisons. The FACETS output from both analyses is included in the appendix. Reassuringly, the two methods gave virtually identical results for the measures for scripts from both years, shown in Figure 1. The only difference is a scaling factor in the logit scale created by the analysis software, where, as expected, the Thurstone method appeared to create
a longer (more discriminating) scale due to the lack of independence between paired comparisons within a ranking. The outlier in Figure 1 is a script which was ranked first in each pack in which it appeared and its measure is therefore an estimate for an ‘extreme’ value. Since the two methods gave substantively the same results, we chose to use the Thurstone pairs analysis as the basis for presenting the results. This was for two reasons: first Thurstone pairs methodology is an established method for investigating year-on-year comparability in public examining in the UK, and second it allowed a detailed investigation of individual judge
Partial Credit 5 4 3 2 1 0 -1 -2 -3 -6
-5
-4
-3
-2
-1
0
1 2 3 Thurstone 2003 2004
4
5
6
7
8
9
Figure 1. Logit measures obtained from the Thurstone and Partial Credit analyses. Mark 50 S307
40
30
20
10
0 -6
-5
-4
-3
-2
-1
0
1 2 Measure
3
4
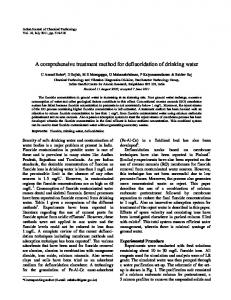
Figure 2. Plot of mark against judged measure for the 2003 scripts.
5
6
7
8
9
208
BRAMLEY
discrepancies to be carried out more easily than the Partial Credit method.
axes and comparing the distance between the two best fit lines, as in Figure 4.
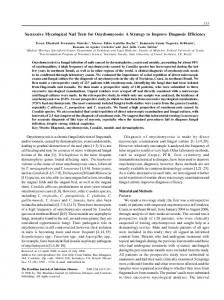
Figures 2 and 3 show that there was a good linear relationship between measure and mark for the scripts in both years (correlation for 2003 = 0.92, correlation for 2004 = 0.95). The 2003 script S307 clearly had a big discrepancy between its measure and its mark—the correlation for 2003 scripts increased to 0.95 when this script was removed.
Three scripts were excluded from the plot in Figure 4—the outlier S307 mentioned above, and the two scripts from 2003 with the highest judged measures. It was thought justifiable to exclude these two scripts since we were most interested in comparing the mark scales at the cut-scores, which were not at the extremes of the scale.
This good linear relationship means that the results can be meaningfully used to compare the 2003 and 2004 mark scales. This can be done by plotting the graphs for both years on the same
The best fit lines are approximately parallel, with regression equations: 2003 mark = 23.540 + 2.957 × measure
(1)
2004 mark = 26.485 + 3.058 × measure.
(2)
Mark 50
40
30
20
10
0 -6
-5
-4
-3
-2
-1 0 Measure
1
2
3
4
5
Figure 3. Plot of mark against judged measure for the 2004 scripts. Mark 50
40
30
20
10
0 -6
-5
-4
-3
-2
-1 2003
0 Measure
1
2
3
4
2004
Figure 4. Plot of mark against judged measure for the 2003 and the 2004 scripts.
5
6
A RANK-ORDERING METHOD FOR EQUATING TESTS 209
The difference between the regression constants, ≈3 marks, is therefore the difference between the two mark scales at all points. In other words, for a given mark on the 2003 scale, the equivalent mark on the 2004 scale is 3 higher, suggesting that the 2004 test is easier than the 2003 test. The cut-scores for the different levels in 2004 are therefore estimated to be 3 marks higher at all levels than the equivalent cut-scores in 2003. Note that if the slopes had not been parallel then the equivalent mark at each level could easily have been determined either by reading off the graph, or by inserting the 2003 cut-score into equation (1) to determine the corresponding measure, then inserting that measure into equation (2) in order to determine the equivalent 2004 cutscore for that level. The result agreed well with that obtained by the statistical equating—a completely independent method which had arrived at cut-scores on the 2004 test which were about 2 marks higher at each level than the 2003 test. Judge agreement It is possible to investigate the extent to which the individual judges’ rank-orderings agreed with the marks on the scripts. Since this was the first time this exercise had been carried out, we did not have anything to compare these figures with, but they may be of interest for research purposes and future comparisons. The judges can be compared both to the extent that
their rankings agreed with the mark on the script, and to the extent that their rankings of the scripts agreed with those of the other judges. 1) Agreement of ranking with mark on script Table 1 below shows the ‘gamma’ statistic (Goodman and Kruskal, 1979) for each judge averaged across four packs for each year separately. The gamma statistic can be interpreted as follows: given that a pair of scripts chosen at random from within a year within a pack are not tied in rank or mark, gamma is the probability that they have the same order for rank and mark minus the probability they have a different order. Since the judges gave a lower rank to the better scripts, better agreement of rank with mark is indicated by negative values of gamma. Table 1 shows that all judges had an average gamma that was negative, in both 2003 and 2004, so we can conclude that overall their rankings were in good agreement with the marks on the scripts. Within each pack, however, there was more variability, with some judges’ ‘worst’ ranking (shown in the ‘max’ column) containing values that were positive. If we use a criterion of having all values of gamma negative in both years, then the ‘best’ judges were 5, 7, 10, 11 and 12. 2) Agreement with the other judges The extent to which a judge’s rankings disagreed with those of the other judges can be assessed by analysing the judge misfit to the
Table 1 Average agreement (across 4 packs) of rank with mark by judge and year - gamma statistic. 2003 scripts Judge 1 2 3 4 5 6 7 8 9 10 11 12
Mean -0.47 -0.30 -0.45 -0.39 -0.70 -0.53 -0.68 -0.42 -0.25 -0.55 -0.54 -0.53
2004 scripts
Min
Max
-0.80 -0.40 -0.80 -0.78 -0.80 -1.00 -1.00 -1.00 -0.60 -0.60 -0.80 -0.80
0.20 0.00 0.00 -0.20 -0.40 -0.11 -0.33 0.00 0.00 -0.40 -0.20 -0.11
Mean -0.55 -0.20 -0.60 -0.25 -0.70 -0.15 -0.60 -0.55 -0.25 -0.38 -0.50 -0.60
Min
Max
-1.00 -0.60 -1.00 -0.80 -0.80 -0.60 -0.60 -0.60 -1.00 -0.60 -0.80 -0.80
-0.20 0.20 -0.40 0.40 -0.60 0.40 -0.60 -0.40 0.40 -0.20 -0.20 -0.40
210
BRAMLEY
Thurstone model, which placed all the scripts onto a single scale of rated level of performance. Misfit to the Thurstone model can be assessed by counting the number of individual judgments with a large standardised residual (here a z-statistic of absolute value > 2.5), or by comparing the global misfit statistic (here the ‘infit mean square’, (Wright and Masters, 1982)) averaged over all judgments. As might be expected, the two indicators are in close agreement, as shown in Table 2 below. Table 2 Judge misfit to the Thurstone model Judge
# misfitting judgments
Misfit statistic
1 2 3 4 5 6 7 8 9 10 11 12
7 8 4 4 8 4 1 6 7 5 1 0
1.2 1.2 0.9 0.8 1.2 0.9 0.8 1.1 1.2 1.2 0.8 0.8
By the criterion of agreeing with the overall pattern of judgments, judges 4, 7, 11 and 12 appear to be the ‘best’.
Discussion Construct validity As far as this exercise is concerned the validity of the latent trait of Reading ability is assumed. Further assumptions are that increasing raw scores on the test reflect increasing levels of Reading ability, and that scripts with the same raw score are at the same location on the latent trait. Of course, these are assumptions which are open to challenge, but to do so is not the aim of this paper. The analysis of the ranking data from the exercise effectively creates a second latent trait— ‘judged quality of performance’. The extent to
which there is a relationship between each script’s location on this latent trait and each script’s location on the Reading ability trait (as indicated by its raw score) is the extent to which it is valid to use expert judgment to compare the two raw score scales using this method. This method is therefore more risky and also stronger scientifically than some other methods because it can potentially be invalidated (falsified) in more ways. Methods such as the Bookmark or Script Placement method which effectively provide the judges with the ‘correct’ rank-ordering of the objects in advance can only be invalidated by disagreement amongst the judges. With the rankordering method it is possible for the judges both to disagree with each other (i.e. fail to construct a meaningful trait) and also to construct a trait which does not correlate with the Reading ability trait. Standard setting v standard maintaining In carrying out exercises to set cut-scores in this particular context, namely National Curriculum testing in England, there is an ambiguity about whether the purpose is one of standard setting, or of standard maintaining. This is perhaps inevitable given the political desirability of involving various stakeholder groups in the standard-setting/standard-maintaining exercises. Methods which compare pass-rates from one year to the next, or which attempt to equate statistically the current year’s test to a previous year’s test, are implicitly standard maintaining exercises, because the known cut-scores from a previous year’s test are mapped onto the raw mark scale of the current year’s test following the rationale and procedures of whichever method is chosen. Many of the judgmental methods used, however, could more accurately be described as standard setting exercises, which would ideally only be applied the first time a test is created. The Angoff method and the Bookmark method would certainly fall into this category. It is now recognised that standard setting inescapably involves human value judgments and that the process is not analogous to estimating the value of a
A RANK-ORDERING METHOD FOR EQUATING TESTS 211
population parameter (Zieky, 2001). There is no ‘true’ value of the cut-score waiting to be discovered. What is more important is that relevantly qualified experts are allowed to express the judgments that they are most competent to make in a defensible and sound way. Of course, this creates plenty of scope for debate about which kind of judgments the experts are most competent to make—for instance whether they should be judging the holistic quality of performances on the test or the difficulty of the items, whether they are competent to judge probabilities or should be confined to ‘yes’ / ’no’ decisions, whether they are capable of conceiving of a population of minimally competent candidates, etc.—not to mention which statistical procedures are most appropriate for turning these judgments into cut-scores! A recent review of the latest concepts and methods can be found in Cizek (2001). Using expert judgment-based standard setting methods each year therefore creates a tension between standard setting and standard maintaining, a tension which needs to be resolved. The blurring of the two can be seen both in test-centred standard setting methods (based on judgments about test items) and examinee-centred methods (based on judgments about test performances). For instance, in the instructions to the judge panel in Angoff and Bookmark-type exercises, judges are asked to make a judgment about how pupils at the relevant level ‘would’ perform on the item in question rather than ‘should’ perform. (This is of course not an inherent feature of these methods, just how they have tended to be used in the England NC testing context). This means that in this respect their judgments are based on their experiences of pupils who have been classified at these levels in previous years, and hence depend on the year-on-year consistency of the standards which have been set, creating an unwelcome circularity in the process. Furthermore, the training of the judge panel usually involves exposure to test performances from pupils in the previous year (known as ‘archive scripts’), to help them ‘fix’ the correct standard in their minds. On the other hand, a major part of the judge training focuses on the unchanging performance descrip-
tors for each level set out in the National Curriculum. The implicit assumption is that the two sources of training evidence will be in perfect agreement, although this of course need not be the case. Similarly, examinee-centred methods can also blur the distinction between ‘would’ and ‘should’. The judges are trained to understand the performance descriptors for each level, which tell them what pupils at each level should be able to achieve, but are then exposed to archive scripts from previous years which show them what the minimal performance actually required to obtain each level was. The judgmental task can therefore be confused as to whether it is what level certain performances on this year’s test should be awarded, or what level they would be awarded if the same standards as last year were applied. Rank-ordering as standard maintaining The rank-ordering method described in this paper is clearly a standard maintaining method and not a standard setting method. This is because pupil performances from two years are directly compared and the known cut-scores from one year are mapped onto equivalent cut-scores from the other year via the latent trait constructed by the rank-ordering exercise. The rank-ordering method therefore contrasts with Rasch or IRT-based standard-setting methods such as the Bookmark method or the ‘Objective Standard Setting’ method (Stone, 2001). In Stone’s method the decisions are separated into components relating to core content, performance and precision; in the Bookmark method the judges are given the item locations on the latent trait and make a single decision about where to locate the standard. In both these methods judges’ decisions are explicitly focused at the point on the latent trait where the standard is to be set. However, in the rank-ordering method the judges do not at any stage have to make a decision about where the standard lies, or which scripts meet the standard for each cut-score. Although the judges consider the fixed performance descriptors for each level in their training, the impact of this (we hope) is that they form a shared
212
BRAMLEY
understanding of what makes a performance better or worse. In Rasch measurement terms this means that the purpose of their training is to ensure as much as possible that their judgments lie on the same unidimensional latent trait of perceived quality. It is on this latent trait constructed in the minds of the judges that the standard resides. Relating the latent trait to the raw mark scale in different years is how the standard can be transferred from one test to another. The final decision about which set of cutscores should be adopted is based on evidence from different sources, as described in the introduction. This decision is made much more difficult if the different sources of evidence disagree. Human values and judgment then enter the process a second time at a meta-level in determining the relative weight to be given to each source of evidence. It is arguable that the strand of evidence from judgmental methods involving expert judges is the ‘odd one out’ in that it is currently based on standard-setting methodologies rather than standard-maintaining methodologies. The training the judges receive and the instructions they are given blurs this distinction, but does not remove the standard-setting element. The rankordering method, in contrast, is explicitly a standard-maintaining exercise. It would seem therefore more likely to produce results which agree with the other strands of evidence and thus make the final decision-making process easier. Evaluation of the rank-ordering method From the judges’ point of view, the method is easy to understand and use, and is certainly less time-consuming than the equivalent ‘proper’ Thurstone method. We obtained the equivalent of 45 paired comparisons per judge in 50 minutes, whereas experience of using the Thurstone method in many studies has shown that even the fastest judges are working at the rate of about 15-20 comparisons per hour. In terms of experimental design, the method is very flexible in that objects (scripts) from more than two years can be used, the number of judges can vary, as can the number of scripts per pack, the number of packs, and the amount of overlap
needed to link objects within an unambiguous frame of reference. Clearly there is scope for further research to determine the optimum values for these variables in a given context. The fact that the judges work independently without conferring means that inter-judge interactions caused by group dynamics do not affect the data, in contrast to methods which involve several rounds of group discussion of decisions. In terms of administration / logistics the method is fairly laborious in the requirement for ‘cleaning’ of scripts (i.e. removing marks and annotations from them) and of photocopying. However, this work can all be planned and carried out well in advance of the exercise taking place. We can expect that as the technology of examining improves and electronic scripts become the norm (e.g. Roan, 2003) that both of these administrative burdens will be significantly reduced. In terms of analytical method, both of the Rasch-based methods described here worked well (and agreed with each other). However, it should be noted that there is no absolute requirement to use a parametric method since the main purpose is to relate two (ordinal) mark scales to each other. Thus any non-parametric method capable of forming an overall rank order from a series of partial rankings would be applicable. That said, there are several advantages of using the Rasch model which make it an obvious choice until there is evidence that a better analytical method is available: •
A single latent trait is constructed on which the standard corresponding to each cut-score is located. All objects (scripts) are also located on this trait and the distance between any two objects depends only on the judged quality of the two objects (when the data fit the model);
•
The individual standards of the participating judges cancel out so no assumptions need to be made about the distribution of those standards in the sample of judges involved;
•
The analysis yields quality control fit statistics allowing evaluation of individual judge rankings;
A RANK-ORDERING METHOD FOR EQUATING TESTS 213
•
The model can easily handle complex data collection designs with missing data;
ing. Applied Psychological Measurement, 2, 449-460.
•
High-quality user-friendly software already exists for performing the analyses.
Angoff, W. H. (1971). Scales, norms and equivalent scores. In R. L. Thorndike (Ed.), Educational measurement (2nd ed.). Washington, DC: American Council on Education.
On the face of it, the method would appear to be more suitable for tests requiring extended constructed responses, where (in general) the total score is an aggregate of a small number of holistic judgments, in contrast to tests consisting of shortanswer questions or selected response questions where the total score is effectively an aggregation of many micro-judgments. Future studies could confirm whether this impression is correct.
Conclusions The rank-ordering method worked well as a method for comparing the raw mark scales across years. There was a good linear relationship between the measures obtained from the judges’ rankings and the marks which the scripts had obtained. There was a clear indication that for a given mark on the 2003 mark scale for Reading, the equivalent mark on the 2004 scale was 3 marks higher. This agreed well with independent evidence from statistical equating. We have argued that the rank-ordering method is best considered as a standard maintaining method, rather than (yet) another addition to the list of standard setting methods. In the particular context of maintaining year-on-year standards in National Curriculum tests in England this should be seen as an advantage, which ought to bring the strand of judgmental evidence into line with the other strands of evidence used in making the final decision about where to locate the cut-scores, thus making that decision easier and more defensible.
Footnotes In fact there were 479 records since one script was missing from one of the packs due to an administrative error. 1
References Andrich, D. (1978). Relationships between the Thurstone and Rasch approaches to item scal-
Bell, J. F., Bramley, T., and Raikes, N. (1998). Investigating A-level mathematics standards over time. British Journal of Curriculum and Assessment, 8(2) 7-11. Bramley, T., Bell, J. F., and Pollitt, A. (1998). Assessing changes in standards over time using Thurstone paired comparisons. Education Research and Perspectives, 25(2) 1-23. Cizek, G. J. (Ed.) (2001). Setting performance standards: Concepts, methods and perspectives. Mahwah, NJ: Lawrence Erlbaum. Elliott, G., and Greatorex, J. (2002) A fair comparison? The evolution of methods of comparability in national assessment, Educational Studies, 28(3) 253-264. Fearnley, A. J. (2000). A comparability study in GCSE mathematics: A review of the examination requirements and a report on the cross moderation exercise. Manchester, England: AQA. Forster, M., and Gray, E. (2000, September) Impact of independent judges in comparability studies conducted by awarding bodies. Paper presented at the British Educational Research Association Annual Conference, Cardiff University. Goodman, L. A., and Kruskal, W. H. (1979). Measures of association for cross-classifications. New York: Springer-Verlag. Hopkins, K. D., George, L. A., and Williams, D. D. (1985). The concurrent validity of standardised achievement tests by content area using teachers’ ratings as criteria. Journal of Educational Measurement, 22(3), 177-182. Laming, D. (2004). Human judgment: The eye of the beholder. London: Thomson Lewis, D. M., Mitzel, H. C., Green, D. R., and Patz, R.J. (1999). The bookmark standard setting procedure. Monterey, CA: McGraw-Hill.
214
BRAMLEY
Linacre, J. M. (1992). Objective measurement of rank-ordered objects. In Mark Wilson (Ed.) Objective measurement: Theory into practice, Volume 1. Norwood, NJ: Ablex. Linacre, J. M. (1994). Many-facet Rasch measurement (2nd ed.), Chicago: MESA Press Linacre, J. M., and Wright, B. D. (1994). A user’s guide to FACETS: Rasch measurement computer program. Chicago: MESA Press. Linacre, J. M. (1999). FACETS [Computer program, version 3.22]. Chicago: MESA Press. Mitzel, H. C., Lewis, D. M., Patz, R. J., and Green, D. R. (2001). The Bookmark procedure: psychological perspectives. In G. J. Cizek (Ed). Setting performance standards: Concepts, methods and perspectives. Mahwah, NJ: Lawrence Erlbaum. Myford, C. M., and Wolfe, E. W. (2003). Detecting and measuring rater effects using manyfacet Rasch measurement: Part 1. Journal of Applied Measurement, 4, 386-422. Nunnally, J. C. (1967). Psychometric Theory. New York: McGraw-Hill. Petersen, N. S., Kolen, M. J., and Hoover, H. D. (1989). Scaling, norming and equating. In R. L. Linn (Ed.), Educational Measurement (3rd ed.), Phoenix, AZ: The Oryx Press.
Rasch, G. (1960). Probabilistic models for some intelligence and attainment tests. Copenhagen, Denmark: Danish Institute for Educational Research. (Expanded edition, 1980. Chicago: University of Chicago Press.) Roan, M. (2003). Changes in marking UK examinations—are we ready yet? International Association for Educational Assessment, 29th annual conference, Manchester, UK. [Available at http://www.aqa.org.uk/support/iaea/ papers/roan.pdf]. Stone, G. E. (2001). Objective standard setting (or truth in advertising). Journal of Applied Measurement, 2, 187-201. Thurstone, L. L. (1927). A law of comparative judgment. Psychological Review, 3, 273-286. Wright, B. D. (1977). Solving measurement problems with the Rasch model. Journal of Educational Measurement, 14(2), 97-116. Wright, B. D., and Masters, G. N. (1982). Rating scale analysis. Chicago: MESA Press. Zieky, M. J. (2001). So much has changed: how the setting of cut-scores has evolved since the 1980s. In G. J. Cizek (Ed.) Setting performance standards: Concepts, methods and perspectives.Mahwah, NJ: Lawrence Erlbaum.
A RANK-ORDERING METHOD FOR EQUATING TESTS 215
Appendix Table A1 Scripts used in the rank-ordering study 2003 scripts
2004 scripts
Script
Mark
Script
Mark
S307 S339 S340 S303 S301 S310 S302 S328 S318 S319 S304 S338 S315 S314 S335 S321 S331 S312 S311 S326 S332 S316 S327 S324 S336 S317 S320 S322 S329 S337 S309 S305 S325 S333 S334 S323 S306 S308 S330
46 46 45 44 42 39 38 36 35 35 35 34 33 31 30 29 28 28 28 27 25 25 24 23 22 22 21 20 19 16 16 15 14 13 13 12 11 11 10
S404 S429 S431 S403 S417 S415 S411 S436 S423 S408 S407 S413 S432 S439 S427 S428 S402 S418 S435 S419 S424 S406 S438 S421 S440 S410 S409 S425 S433 S420 S437 S422 S426 S414
43 41 40 39 37 36 35 33 32 31 30 29 28 27 26 25 24 23 22 21 20 19 18 17 16 15 14 13 12 11 10 10 8 7
216
BRAMLEY
Table A2 (continued)
Table A2
Allocation of scripts to judges
Allocation of scripts to judges Judge Pack 1 1 1 1 1 1 1 1 1 1 1 2 1 2 1 2 1 2 1 2 1 3 1 3 1 3 1 3 1 3 1 4 1 4 1 4 1 4 1 4 2 1 2 1 2 1 2 1 2 1 2 2 2 2 2 2 2 2 2 2 2 3 2 3 2 3 2 3 2 3 2 4 2 4 2 4 2 4 2 4 3 1 3 1 3 1 3 1 3 1 3 2 3 2 3 2 3 2 3 2 3 3
2003 Script S307 S340 S301 S310 S328 S318 S338 S335 S312 S332 S316 S324 S317 S322 S337 S317 S329 S305 S334 S308 S339 S303 S310 S302 S318 S328 S304 S314 S331 S326 S326 S316 S324 S317 S322 S320 S337 S325 S323 S330 S340 S301 S310 S328 S319 S302 S319 S315 S321 S311 S332
Mark 46 45 42 39 36 35 34 30 28 25 25 23 22 20 16 22 19 15 13 11 46 44 39 38 35 36 35 31 28 27 27 25 23 22 20 21 16 14 12 10 45 42 39 36 35 38 35 33 29 28 25
2004 Script S404 S429 S403 S417 S411 S436 S407 S439 S402 S419 S427 S418 S424 S421 S409 S435 S406 S440 S425 S437 S404 S429 S403 S411 S423 S411 S423 S413 S427 S418 S418 S419 S406 S421 S410 S438 S440 S409 S433 S437 S411 S404 S429 S403 S417 S436 S408 S413 S439 S428 S428
Mark 43 41 39 37 35 33 30 27 24 21 26 23 20 17 14 22 19 16 13 10 43 41 39 35 32 35 32 29 26 23 23 21 19 17 15 18 16 14 12 10 35 43 41 39 37 33 31 29 27 25 25
Judge Pack 3 3 3 3 3 3 3 3 3 4 3 4 3 4 3 4 3 4 4 1 4 1 4 1 4 1 4 1 4 2 4 2 4 2 4 2 4 2 4 3 4 3 4 3 4 3 4 3 4 4 4 4 4 4 4 4 4 4 5 1 5 1 5 1 5 1 5 1 5 2 5 2 5 2 5 2 5 2 5 3 5 3 5 3 5 3 5 3 5 4 5 4 5 4 5 4 5 4 6 1 6 1
2003 Script S327 S336 S320 S329 S336 S322 S309 S333 S306 S303 S310 S302 S318 S304 S338 S335 S312 S332 S324 S331 S326 S327 S317 S329 S320 S329 S309 S325 S334 S301 S310 S328 S319 S338 S304 S314 S331 S326 S327 S335 S312 S332 S324 S320 S322 S337 S305 S333 S323 S310 S302
Mark 24 22 21 19 22 20 16 13 11 44 39 38 35 35 34 30 28 25 23 28 27 24 22 19 21 19 16 14 13 42 39 36 35 34 35 31 28 27 24 30 28 25 23 21 20 16 15 13 12 39 38
2004 Script S418 S419 S406 S421 S419 S438 S410 S433 S422 S431 S417 S411 S408 S432 S415 S436 S407 S439 S402 S413 S427 S418 S424 S421 S440 S409 S433 S437 S426 S429 S403 S417 S411 S436 S431 S411 S423 S413 S427 S427 S402 S435 S424 S438 S406 S440 S425 S437 S414 S429 S403
Mark 23 21 19 17 21 18 15 12 10 40 37 35 31 28 36 33 30 27 24 29 26 23 20 17 16 14 12 10 8 41 39 37 35 33 40 35 32 29 26 26 24 22 20 18 19 16 13 10 7 41 39
(Table A2 continued on next page)
A RANK-ORDERING METHOD FOR EQUATING TESTS 217
Table A2 (continued)
Table A2 (continued)
Allocation of scripts to judges Judge Pack 6 6 6 6 6 6 6 6 6 6 6 6 6 6 6 6 6 6 7 7 7 7 7 7 7 7 7 7 7 7 7 7 7 7 7 7 7 7 8 8 8 8 8 8 8 8 8 8 8 8 8
1 1 1 2 2 2 2 2 3 3 3 3 3 4 4 4 4 4 1 1 1 1 1 2 2 2 2 2 3 3 3 3 3 4 4 4 4 4 1 1 1 1 1 2 2 2 2 2 3 3 3
2003 Script S318 S304 S315 S315 S335 S331 S311 S332 S321 S311 S316 S336 S322 S317 S322 S337 S305 S333 S307 S303 S310 S318 S338 S319 S338 S314 S321 S312 S326 S327 S317 S329 S305 S337 S305 S333 S323 S308 S339 S301 S302 S319 S315 S318 S304 S315 S335 S331 S312 S332 S324
Allocation of scripts to judges
Mark
2004 Script
Mark
35 35 33 33 30 28 28 25 29 28 25 22 20 22 20 16 15 13 46 44 39 35 34 35 34 31 29 28 27 24 22 19 15 16 15 13 12 11 46 42 38 35 33 35 35 33 30 28 28 25 23
S415 S436 S407 S415 S411 S423 S407 S432 S432 S427 S402 S435 S424 S409 S433 S437 S426 S414 S404 S431 S417 S436 S408 S423 S407 S432 S427 S402 S402 S435 S424 S438 S440 S406 S421 S410 S425 S420 S404 S429 S431 S403 S415 S411 S423 S407 S432 S427 S428 S435 S406
36 33 30 36 35 32 30 28 28 26 24 22 20 14 12 10 8 7 43 40 37 33 31 32 30 28 26 24 24 22 20 18 16 19 17 15 13 11 43 41 40 39 36 35 32 30 28 26 25 22 19
Judge Pack 8 8 8 8 8 8 8 9 9 9 9 9 9 9 9 9 9 9 9 9 9 9 9 9 9 9 9 10 10 10 10 10 10 10 10 10 10 10 10 10 10 10 10 10 10 10 10 11 11 11 11
3 3 4 4 4 4 4 1 1 1 1 1 2 2 2 2 2 3 3 3 3 3 4 4 4 4 4 1 1 1 1 1 2 2 2 2 2 3 3 3 3 3 4 4 4 4 4 1 1 1 1
2003 Script
Mark
2004 Script
Mark
S320 S337 S309 S325 S334 S306 S330 S340 S310 S328 S304 S314 S328 S319 S338 S314 S321 S311 S316 S336 S322 S309 S329 S309 S325 S334 S306 S303 S310 S318 S338 S335 S319 S315 S321 S311 S316 S311 S332 S327 S336 S320 S327 S317 S329 S305 S334 S301 S302 S319 S315
21 16 16 14 13 11 10 45 39 36 35 31 36 35 34 31 29 28 25 22 20 16 19 16 14 13 11 44 39 35 34 30 35 33 29 28 25 28 25 24 22 21 24 22 19 15 13 42 38 35 33
S440 S425 S418 S424 S421 S409 S420 S404 S429 S403 S415 S436 S411 S408 S432 S428 S435 S439 S402 S419 S438 S410 S421 S410 S425 S420 S422 S431 S417 S415 S436 S423 S411 S417 S408 S413 S439 S439 S428 S418 S419 S406 S424 S421 S409 S420 S426 S429 S403 S411 S423
16 13 23 20 17 14 11 43 41 39 36 33 35 31 28 25 22 27 24 21 18 15 17 15 13 11 10 40 37 36 33 32 35 37 31 29 27 27 25 23 21 19 20 17 14 11 8 41 39 35 32
(Table A2 continued on next page)
218
BRAMLEY
Table A2 (continued) Allocation of scripts to judges Judge Pack 11 11 11 11 11 11 11 11 11 11 11 11 11 11 11 11 12 12 12 12 12 12 12 12 12 12 12 12 12 12 12 12 12 12 12 12
1 2 2 2 2 2 3 3 3 3 3 4 4 4 4 4 1 1 1 1 1 2 2 2 2 2 3 3 3 3 3 4 4 4 4 4
2003 Script
Mark
2004 Script
Mark
S321 S338 S314 S321 S312 S326 S331 S311 S332 S327 S336 S324 S320 S337 S325 S323 S310 S328 S304 S314 S331 S304 S315 S335 S331 S311 S312 S326 S316 S324 S317 S316 S336 S322 S309 S333
29 34 31 29 28 27 28 28 25 24 22 23 21 16 14 12 39 36 35 31 28 35 33 30 28 28 28 27 25 23 22 25 22 20 16 13
S413 S417 S411 S436 S408 S413 S432 S428 S435 S406 S440 S410 S425 S420 S422 S414 S429 S431 S403 S415 S436 S417 S411 S408 S432 S428 S407 S439 S402 S419 S438 S438 S410 S433 S422 S426
29 37 35 33 31 29 28 25 22 19 16 15 13 11 10 7 41 40 39 36 33 37 35 31 28 25 30 27 24 21 18 18 15 12 10 8
A RANK-ORDERING METHOD FOR EQUATING TESTS 219
FACETS output from Thurstone pairs analysis Rankings, Thurstone model (ignore ties) Table 7.1.1 Judge Measurement Report (arranged by mN). -------------------------------------------------------------------------------------------| Obsvd Obsvd Obsvd Fair-M| Model | Infit Outfit | | | Score Count Average Avrage|Measure S.E. |MnSq ZStd MnSq ZStd | Nu Judge | -------------------------------------------------------------------------------------------| 86 171 0.5 0.50| .00 .23 | 1.2 1 1.6 0 | 1 | | 90 180 0.5 0.50| .00 .20 | 1.2 2 1.2 0 | 2 | | 86 171 0.5 0.50| .00 .21 | 0.9 -1 0.7 -1 | 3 | | 90 180 0.5 0.50| .00 .21 | 0.8 -1 0.6 0 | 4 | | 90 179 0.5 0.50| .00 .20 | 1.2 1 1.3 0 | 5 | | 90 180 0.5 0.50| .00 .20 | 0.9 -1 0.7 -1 | 6 | | 90 180 0.5 0.50| .00 .21 | 0.8 -2 0.5 0 | 7 | | 89 178 0.5 0.50| .00 .21 | 1.1 1 1.3 0 | 8 | | 86 171 0.5 0.50| .00 .21 | 1.2 1 1.2 0 | 9 | | 86 171 0.5 0.50| .00 .22 | 1.2 1 0.9 0 | 10 | | 90 180 0.5 0.50| .00 .21 | 0.8 -1 0.5 -1 | 11 | | 90 180 0.5 0.50| .00 .22 | 0.8 -2 0.5 -1 | 12 | -------------------------------------------------------------------------------------------| 88.4 176.8 0.5 0.50| .00 .21 | 1.0 -0.1 0.9 -0.3| Mean (Count: 12) | | 2.1 4.1 0.0 0.00| .00 .01 | 0.2 1.8 0.4 0.8| S.D. | -------------------------------------------------------------------------------------------RMSE (Model) .21 Adj S.D. .00 Separation .00 Reliability 603. Fixed (all same) chi-square: .0 d.f.: 11 significance: 1.00
Rankings, Thurstone model (ignore ties) Table 7.3.1 Script Measurement Report (arranged by mN). -----------------------------------------------------------------------------------------| Obsvd Obsvd Obsvd Fair-M| Model | Infit Outfit | | | Score Count Average Avrage|Measure S.E. |MnSq ZStd MnSq ZStd | Nu Script | -----------------------------------------------------------------------------------------| 14 27 |( 8.73 1.85)|Maximum | 39 S340 (mark 45) | | 18 36 0.5 1.00| 7.54 1.03 | 1.0 0 0.4 0 | 3 S303 (mark 44) | | 21 42 0.5 1.00| 5.87 .50 | 1.1 0 1.0 0 | 1 S301 (mark 42) | | 44 87 0.5 0.99| 5.00 .31 | 0.9 0 0.7 0 | 10 S310 (mark 39) | | 9 17 0.5 0.99| 4.98 .60 | 0.9 0 0.7 0 | 38 S339 (mark 46) | | 27 54 0.5 0.99| 4.93 .41 | 1.1 0 0.9 0 | 65 S431 (mark 40) | | 36 72 0.5 0.99| 4.90 .42 | 0.9 0 0.7 0 | 37 S338 (mark 34) | | 39 78 0.5 0.99| 4.77 .30 | 0.9 0 1.0 0 | 64 S429 (mark 41) | | 27 54 0.5 0.98| 4.08 .35 | 0.9 0 0.7 0 | 2 S302 (mark 38) | | 36 71 0.5 0.98| 4.02 .33 | 0.8 0 0.5 -1 | 14 S315 (mark 33) | | 39 78 0.5 0.98| 3.83 .27 | 1.3 2 1.3 1 | 41 S403 (mark 39) | | 35 70 0.5 0.98| 3.79 .32 | 1.0 0 0.9 0 | 18 S319 (mark 35) | | 26 51 0.5 0.96| 3.16 .34 | 1.2 0 1.3 0 | 42 S404 (mark 43) | | 39 78 0.5 0.96| 3.08 .29 | 0.8 -1 0.7 -1 | 52 S417 (mark 37) | | 62 123 0.5 0.95| 3.02 .23 | 1.0 0 0.9 0 | 48 S411 (mark 35) | | 31 62 0.5 0.95| 3.01 .33 | 1.4 2 1.8 0 | 17 S318 (mark 35) | | 31 62 0.5 0.94| 2.80 .40 | 0.9 0 1.2 0 | 25 S326 (mark 27) | | 32 63 0.5 0.94| 2.74 .38 | 1.3 1 1.2 0 | 12 S312 (mark 28) | | 36 71 0.5 0.91| 2.31 .34 | 0.9 0 0.7 0 | 11 S311 (mark 28) | | 30 60 0.5 0.91| 2.31 .33 | 1.1 0 1.0 0 | 27 S328 (mark 36) | | 45 89 0.5 0.89| 2.12 .27 | 1.0 0 0.9 0 | 69 S436 (mark 33) | | 31 62 0.5 0.89| 2.08 .32 | 1.4 2 1.7 1 | 13 S314 (mark 31) | | 36 71 0.5 0.89| 2.07 .29 | 0.8 -1 0.6 -1 | 4 S304 (mark 35) | | 31 62 0.5 0.88| 2.02 .32 | 0.9 0 0.9 0 | 51 S415 (mark 36) | | 32 63 0.5 0.87| 1.94 .32 | 0.9 0 0.8 0 | 34 S335 (mark 30) | | 31 62 0.5 0.86| 1.85 .40 | 1.1 0 0.7 0 | 15 S316 (mark 25) | | 32 63 0.5 0.84| 1.65 .32 | 1.0 0 0.7 0 | 44 S407 (mark 30) | | 9 17 0.5 0.84| 1.63 .75 | 0.6 -1 0.3 0 | 7 S307 (mark 46) | | 36 72 0.5 0.83| 1.59 .31 | 1.0 0 0.8 0 | 58 S423 (mark 32) | | 32 63 0.5 0.77| 1.21 .38 | 1.0 0 0.8 0 | 23 S324 (mark 23) | | 36 72 0.5 0.75| 1.08 .30 | 0.8 -1 0.6 0 | 30 S331 (mark 28) | | 36 71 0.5 0.74| 1.04 .31 | 1.0 0 1.1 0 | 66 S432 (mark 28) | | 27 54 0.5 0.72| .93 .37 | 1.4 1 1.2 0 | 72 S439 (mark 27) | | 31 61 0.5 0.66| .65 .35 | 1.2 1 1.0 0 | 49 S413 (mark 29) | | 31 62 0.5 0.64| .58 .35 | 1.0 0 0.7 0 | 20 S321 (mark 29) | | 32 63 0.5 0.61| .45 .34 | 0.8 -1 0.5 0 | 59 S424 (mark 20) | | 32 63 0.5 0.53| .14 .33 | 0.9 0 0.6 0 | 26 S327 (mark 24) | | 36 72 0.5 0.53| .13 .38 | 0.8 0 0.4 0 | 21 S322 (mark 20) | | 32 63 0.5 0.52| .10 .34 | 1.0 0 0.9 0 | 68 S435 (mark 22) | | 36 72 0.5 0.50| .02 .35 | 0.9 0 1.7 0 | 16 S317 (mark 22) | | 31 62 0.5 0.48| -.06 .42 | 0.9 0 0.6 0 | 45 S408 (mark 31) | | 32 63 0.5 0.46| -.17 .34 | 0.8 -1 0.5 -1 | 63 S428 (mark 25) |
(Continued on next page)
220
BRAMLEY
Rankings, Thurstone model (ignore ties) Table 7.3.1 Script Measurement Report (arranged by mN). -----------------------------------------------------------------------------------------| Obsvd Obsvd Obsvd Fair-M| Model | Infit Outfit | | | Score Count Average Avrage|Measure S.E. |MnSq ZStd MnSq ZStd | Nu Script | -----------------------------------------------------------------------------------------| 32 63 0.5 0.40| -.42 .37 | 0.9 0 0.7 0 | 28 S329 (mark 19) | | 27 54 0.5 0.38| -.49 .47 | 1.2 0 2.1 1 | 9 S309 (mark 16) | | 36 72 0.5 0.37| -.53 .33 | 1.2 1 1.7 1 | 31 S332 (mark 25) | | 32 63 0.5 0.34| -.66 .34 | 1.1 0 1.0 0 | 53 S418 (mark 23) | | 32 63 0.5 0.27| -.99 .37 | 1.2 1 1.1 0 | 19 S320 (mark 21) | | 36 72 0.5 0.26| -1.03 .36 | 0.8 0 0.5 -1 | 40 S402 (mark 24) | | 36 72 0.5 0.25| -1.09 .36 | 1.3 1 1.7 0 | 62 S427 (mark 26) | | 32 63 0.5 0.21| -1.34 .36 | 0.8 0 0.7 0 | 35 S336 (mark 22) | | 32 63 0.5 0.09| -2.37 .37 | 1.1 0 0.9 0 | 36 S337 (mark 16) | | 27 54 0.5 0.08| -2.45 .40 | 1.0 0 0.7 0 | 5 S305 (mark 15) | | 36 72 0.5 0.07| -2.64 .34 | 1.1 0 1.0 0 | 56 S421 (mark 17) | | 23 45 0.5 0.05| -2.92 .41 | 1.0 0 0.9 0 | 33 S334 (mark 13) | | 32 63 0.5 0.05| -3.02 .40 | 0.9 0 0.6 0 | 71 S438 (mark 18) | | 14 27 0.5 0.04| -3.12 .49 | 1.3 1 1.5 0 | 6 S306 (mark 11) | | 23 45 0.5 0.04| -3.23 .40 | 1.1 0 1.0 0 | 67 S433 (mark 12) | | 18 36 0.5 0.03| -3.38 .40 | 1.0 0 1.1 0 | 22 S323 (mark 12) | | 32 63 0.5 0.03| -3.41 .34 | 0.6 -2 0.4 -1 | 47 S410 (mark 15) | | 36 72 0.5 0.02| -3.67 .36 | 0.9 0 0.5 0 | 43 S406 (mark 19) | | 32 63 0.5 0.02| -3.69 .47 | 0.7 -1 0.2 0 | 54 S419 (mark 21) | | 23 45 0.5 0.02| -3.95 .38 | 1.1 0 1.5 0 | 55 S420 (mark 11) | | 23 45 0.5 0.02| -4.14 .38 | 0.9 0 0.7 0 | 24 S325 (mark 14) | | 23 45 0.5 0.01| -4.47 .38 | 1.2 1 1.2 0 | 70 S437 (mark 10) | | 27 54 0.5 0.01| -4.48 .36 | 1.2 1 2.6 1 | 60 S425 (mark 13) | | 9 18 0.5 0.01| -4.52 .61 | 1.6 1 4.2 1 | 29 S330 (mark 10) | | 23 45 0.5 0.01| -4.67 .40 | 0.9 0 0.6 0 | 32 S333 (mark 13) | | 14 27 0.5 0.01| -5.13 .52 | 0.9 0 0.7 0 | 50 S414 (mark 7) | | 27 54 0.5 0.01| -5.22 .44 | 1.0 0 0.6 0 | 46 S409 (mark 14) | | 32 63 0.5 0.01| -5.27 .43 | 1.1 0 0.5 0 | 73 S440 (mark 16) | | 18 36 0.5 0.00| -5.51 .54 | 1.0 0 0.8 0 | 61 S426 (mark 8) | | 18 36 0.5 0.00| -5.58 .57 | 0.7 0 0.3 0 | 57 S422 (mark 10) | | 9 18 0.5 0.00| -5.77 .79 | 0.8 0 0.4 0 | 8 S308 (mark 11) | -----------------------------------------------------------------------------------------| Obsvd Obsvd Obsvd Fair-M| Model | Infit Outfit | | | Score Count Average Avrage|Measure S.E. |MnSq ZStd MnSq ZStd | Nu Script | -----------------------------------------------------------------------------------------| 29.2 58.5 0.5 0.52| .00 .40 | 1.0 -0.0 0.9 -0.2| Mean (Count: 73) | | 8.9 17.9 0.0 0.39| 3.29 .12 | 0.2 1.0 0.6 0.7| S.D. | -----------------------------------------------------------------------------------------RMSE (Model) .41 Adj S.D. 3.26 Separation 7.88 Reliability .98 Fixed (all same) chi-square: 4660.0 d.f.: 71 significance: .00 Random (normal) chi-squ®are: 70.4 d.f.: 70 significance: .46
A RANK-ORDERING METHOD FOR EQUATING TESTS 221
Facets output from Partial Credit analysis Rankings, Partial Credit Model Table 7.2.1 Ranking Measurement Report (arranged by mN). -----------------------------------------------------------------------------------------| Obsvd Obsvd Obsvd Fair-M| Model | Infit Outfit | | | Score Count Average Avrage|Measure S.E. |MnSq ZStd MnSq ZStd | Nu Ranking | -----------------------------------------------------------------------------------------| 45 10 4.5 0.41| 1.81 .17 | 1.6 1 1.9 1 | 8 Judge 2 Pack 4 | | 45 10 4.5 0.31| 1.80 .15 | 0.5 -1 0.5 -1 | 28 Judge 7 Pack 4 | | 45 10 4.5 0.53| 1.78 .17 | 1.5 0 1.4 0 | 20 Judge 5 Pack 4 | | 45 10 4.5 0.92| 1.64 .20 | 1.2 0 1.0 0 | 24 Judge 6 Pack 4 | | 45 10 4.5 0.94| 1.61 .21 | 0.3 -2 0.3 -2 | 16 Judge 4 Pack 4 | | 45 10 4.5 0.84| 1.61 .18 | 0.5 -1 0.6 -1 | 44 Judge 11 Pack 4 | | 45 10 4.5 0.73| 1.53 .18 | 0.9 0 1.1 0 | 36 Judge 9 Pack 4 | | 45 10 4.5 1.24| 1.44 .21 | 1.6 1 1.4 0 | 4 Judge 1 Pack 4 | | 45 10 4.5 0.98| 1.41 .19 | 0.6 -1 0.6 -1 | 12 Judge 3 Pack 4 | | 45 10 4.5 1.15| 1.33 .20 | 2.5 2 2.4 2 | 32 Judge 8 Pack 4 | | 45 10 4.5 1.67| 1.25 .23 | 0.3 -2 0.3 -1 | 48 Judge 12 Pack 4 | | 45 10 4.5 1.83| 1.08 .22 | 1.1 0 1.1 0 | 40 Judge 10 Pack 4 | | 45 10 4.5 3.01| .63 .23 | 0.8 0 0.8 0 | 31 Judge 8 Pack 3 | | 45 10 4.5 2.23| .62 .17 | 0.5 -1 0.5 -1 | 11 Judge 3 Pack 3 | | 45 10 4.5 3.69| .39 .23 | 1.2 0 1.2 0 | 7 Judge 2 Pack 3 | | 45 10 4.5 3.52| .38 .20 | 0.5 -1 0.5 -1 | 27 Judge 7 Pack 3 | | 45 10 4.5 3.56| .36 .22 | 0.7 0 0.7 0 | 35 Judge 9 Pack 3 | | 45 10 4.5 3.64| .35 .20 | 0.6 -1 0.6 0 | 3 Judge 1 Pack 3 | | 45 10 4.5 3.42| .33 .19 | 1.3 0 1.3 0 | 39 Judge 10 Pack 3 | | 45 10 4.5 4.27| .22 .19 | 0.7 0 0.7 0 | 43 Judge 11 Pack 3 | | 45 10 4.5 4.54| -.02 .18 | 1.6 1 1.3 0 | 19 Judge 5 Pack 3 | | 45 10 4.5 4.84| -.06 .17 | 0.9 0 0.9 0 | 15 Judge 4 Pack 3 | | 45 10 4.5 5.41| -.19 .17 | 1.0 0 1.1 0 | 23 Judge 6 Pack 3 | | 45 10 4.5 5.71| -.22 .20 | 0.4 -1 0.4 -1 | 47 Judge 12 Pack 3 | | 45 10 4.5 6.62| -.62 .20 | 2.3 2 2.1 1 | 2 Judge 1 Pack 2 | | 45 10 4.5 7.30| -.71 .17 | 1.6 1 1.6 1 | 6 Judge 2 Pack 2 | | 45 10 4.5 7.39| -.78 .17 | 0.8 0 0.9 0 | 14 Judge 4 Pack 2 | | 45 10 4.5 7.15| -.79 .19 | 1.1 0 1.0 0 | 26 Judge 7 Pack 2 | | 45 10 4.5 7.24| -.83 .19 | 1.7 1 1.5 0 | 34 Judge 9 Pack 2 | | 45 10 4.5 7.38| -.87 .19 | 1.2 0 1.4 0 | 10 Judge 3 Pack 2 | | 45 10 4.5 7.66| -.88 .17 | 0.7 0 0.7 0 | 46 Judge 12 Pack 2 | | 45 10 4.5 7.88| -.89 .15 | 0.5 -1 0.5 -1 | 22 Judge 6 Pack 2 | | 43 10 4.3 6.79| -.91 .19 | 1.4 0 1.5 0 | 18 Judge 5 Pack 2 | | 41 10 4.1 6.71| -.91 .18 | 0.8 0 0.7 0 | 30 Judge 8 Pack 2 | | 36 9 4.0 6.92| -1.03 .20 | 1.3 0 1.1 0 | 38 Judge 10 Pack 2 | | 45 10 4.5 7.91| -1.06 .17 | 0.5 -1 0.5 -1 | 42 Judge 11 Pack 2 | | 45 9 5.0 8.50| -1.39 .18 | 2.0 1 2.0 1 | 33 Judge 9 Pack 1 | | 45 10 4.5 8.38| -1.39 .17 | 1.0 0 0.9 0 | 45 Judge 12 Pack 1 | | 45 10 4.5 8.49| -1.50 .17 | 1.0 0 1.0 0 | 21 Judge 6 Pack 1 | | 45 10 4.5 8.28| -1.51 .18 | 0.8 0 0.8 0 | 41 Judge 11 Pack 1 | | 45 10 4.5 8.24| -1.61 .20 | 0.6 -1 0.6 -1 | 13 Judge 4 Pack 1 | | 45 9 5.0 8.59| -1.66 .19 | 0.7 0 0.7 0 | 1 Judge 1 Pack 1 | | 45 10 4.5 8.31| -1.70 .20 | 0.5 -1 0.7 0 | 25 Judge 7 Pack 1 | | 45 10 4.5 8.47| -1.72 .19 | 1.0 0 0.9 0 | 37 Judge 10 Pack 1 | | 45 9 5.0 8.69| -1.76 .18 | 1.2 0 1.1 0 | 9 Judge 3 Pack 1 | | 36 10 3.6 7.72| -1.77 .15 | 0.9 0 0.9 0 | 29 Judge 8 Pack 1 | | 45 10 4.5 8.64| -1.78 .17 | 1.4 0 1.4 0 | 17 Judge 5 Pack 1 | | 45 10 4.5 8.65| -1.91 .17 | 0.8 0 0.9 0 | 5 Judge 2 Pack 1 | -----------------------------------------------------------------------------------------| Obsvd Obsvd Obsvd Fair-M| Model | Infit Outfit | | | Score Count Average Avrage|Measure S.E. |MnSq ZStd MnSq ZStd | Nu Ranking | -----------------------------------------------------------------------------------------| 44.5 9.9 4.5 5.15| -.19 .19 | 1.0 -0.2 1.0 -0.2| Mean (Count: 48) | | 1.9 0.3 0.2 2.97| 1.21 .02 | 0.5 1.1 0.5 1.0| S.D. | -----------------------------------------------------------------------------------------RMSE (Model) .19 Adj S.D. 1.19 Separation 6.36 Reliability .98 Fixed (all same) chi-square: 2115.7 d.f.: 47 significance: .00 Random (normal) chi-square: 47.0 d.f.: 46 significance: .43
222
BRAMLEY
Rankings, Partial Credit Model Table 7.1.1 Script Measurement Report
(arranged by mN).
-----------------------------------------------------------------------------------------| Obsvd Obsvd Obsvd Fair-M| Model | Infit Outfit | | | Score Count Average Avrage|Measure S.E. |MnSq ZStd MnSq ZStd | Nu Script | -----------------------------------------------------------------------------------------| 1 4 0.3 0.06| 4.72 1.03 | 0.8 0 0.8 0 | 3 S303 (mark 44) | | 7 5 1.4 0.55| 2.68 .36 | 0.5 0 0.5 0 | 1 S301 (mark 42) | | 10 8 1.3 0.38| 2.35 .29 | 1.2 0 1.1 0 | 37 S338 (mark 34) | | 23 10 2.3 0.69| 2.26 .20 | 0.3 -2 0.3 -2 | 10 S310 (mark 39) | | 11 6 1.8 0.43| 2.26 .27 | 1.4 0 1.5 0 | 65 S431 (mark 40) | | 5 2 2.5 0.33| 2.18 .36 | 1.1 0 1.1 0 | 38 S339 (mark 46) | | 23 9 2.6 0.65| 2.13 .18 | 1.0 0 0.9 0 | 64 S429 (mark 41) | | 19 6 3.2 0.55| 1.85 .20 | 0.6 0 0.7 0 | 2 S302 (mark 38) | | 16 8 2.0 0.42| 1.85 .21 | 0.9 0 0.7 0 | 14 S315 (mark 33) | | 24 8 3.0 0.67| 1.75 .19 | 0.6 -1 0.6 -1 | 18 S319 (mark 35) | | 37 9 4.1 0.84| 1.74 .16 | 1.7 1 1.7 1 | 41 S403 (mark 39) | | 33 6 5.5 1.25| 1.49 .20 | 1.5 0 1.4 0 | 42 S404 (mark 43) | | 41 9 4.6 1.14| 1.44 .17 | 0.5 -1 0.5 -1 | 52 S417 (mark 37) | | 31 7 4.4 1.09| 1.41 .19 | 1.8 1 1.9 1 | 17 S318 (mark 35) | | 54 14 3.9 1.00| 1.40 .14 | 0.9 0 1.0 0 | 48 S411 (mark 35) | | 11 7 1.6 1.11| 1.37 .25 | 1.9 1 1.5 0 | 25 S326 (mark 27) | | 14 7 2.0 1.30| 1.30 .23 | 1.7 0 1.4 0 | 12 S312 (mark 28) | | 18 8 2.3 1.44| 1.11 .21 | 0.9 0 0.8 0 | 11 S311 (mark 28) | | 40 7 5.7 1.67| 1.10 .20 | 1.0 0 1.1 0 | 27 S328 (mark 36) | | 55 10 5.5 1.68| 1.02 .16 | 1.0 0 1.0 0 | 69 S436 (mark 33) | | 41 8 5.1 1.61| 1.00 .18 | 0.6 -1 0.6 -1 | 4 S304 (mark 35) | | 32 7 4.6 1.68| 1.00 .18 | 1.6 1 1.5 1 | 13 S314 (mark 31) | | 41 7 5.9 1.58| .98 .20 | 1.4 0 1.4 0 | 51 S415 (mark 36) | | 13 7 1.9 2.21| .94 .26 | 0.9 0 0.9 0 | 15 S316 (mark 25) | | 29 7 4.1 1.79| .92 .19 | 1.0 0 1.0 0 | 34 S335 (mark 30) | | 45 8 5.6 1.98| .82 .19 | 0.4 -1 0.6 -1 | 58 S423 (mark 32) | | 33 7 4.7 2.19| .81 .19 | 1.1 0 1.0 0 | 44 S407 (mark 30) | | 15 2 7.5 2.62| .77 .50 | 0.0 -1 0.0 -1 | 7 S307 (mark 46) | | 17 7 2.4 3.13| .62 .24 | 0.3 -1 0.3 -1 | 23 S324 (mark 23) | | 40 8 5.0 2.76| .59 .19 | 0.4 -1 0.5 -1 | 30 S331 (mark 28) | | 41 8 5.1 2.95| .56 .19 | 0.8 0 0.8 0 | 66 S432 (mark 28) | | 25 6 4.2 3.54| .50 .23 | 1.7 1 2.0 1 | 72 S439 (mark 27) | | 42 7 6.0 3.45| .42 .22 | 2.1 1 1.9 1 | 49 S413 (mark 29) | | 44 7 6.3 3.79| .34 .22 | 0.8 0 0.8 0 | 20 S321 (mark 29) | | 19 7 2.7 4.34| .24 .21 | 0.3 -1 0.3 -2 | 59 S424 (mark 20) | | 18 8 2.3 4.59| .13 .24 | 0.4 -1 0.4 -1 | 21 S322 (mark 20) | | 24 7 3.4 4.96| .12 .21 | 0.6 0 0.7 0 | 26 S327 (mark 24) | | 27 7 3.9 4.93| .09 .21 | 0.9 0 0.8 0 | 68 S435 (mark 22) | | 24 8 3.0 4.99| .06 .21 | 1.1 0 1.1 0 | 16 S317 (mark 22) | | 54 7 7.7 5.21| -.03 .30 | 2.3 1 1.8 0 | 45 S408 (mark 31) | | 36 7 5.1 5.51| -.04 .22 | 0.9 0 0.8 0 | 63 S428 (mark 25) | | 18 7 2.6 5.67| -.15 .23 | 0.5 -1 1.0 0 | 28 S329 (mark 19) | | 44 8 5.5 6.12| -.19 .20 | 1.7 1 1.7 1 | 31 S332 (mark 25) | | 11 6 1.8 5.62| -.21 .32 | 1.6 0 1.9 1 | 9 S309 (mark 16) | | 32 7 4.6 6.21| -.26 .21 | 1.0 0 1.2 0 | 53 S418 (mark 23) | | 53 8 6.6 6.66| -.41 .23 | 0.6 0 0.6 0 | 40 S402 (mark 24) | | 23 7 3.3 6.59| -.42 .23 | 0.7 0 1.3 0 | 19 S320 (mark 21) | | 57 8 7.1 6.93| -.51 .25 | 2.2 1 1.8 1 | 62 S427 (mark 26) | | 34 7 4.9 6.97| -.58 .23 | 1.1 0 1.1 0 | 35 S336 (mark 22) | | 25 7 3.6 8.15| -1.23 .24 | 1.1 0 1.1 0 | 36 S337 (mark 16) | | 23 6 3.8 8.12| -1.26 .25 | 0.5 -1 0.5 0 | 5 S305 (mark 15) | | 44 8 5.5 8.17| -1.31 .22 | 1.0 0 1.1 0 | 56 S421 (mark 17) | | 22 5 4.4 8.29| -1.46 .25 | 0.8 0 0.8 0 | 33 S334 (mark 13) | | 44 7 6.3 8.28| -1.52 .25 | 0.1 -2 0.1 -2 | 71 S438 (mark 18) | | 14 3 4.7 8.49| -1.55 .29 | 2.0 1 2.1 1 | 6 S306 (mark 11) | | 22 5 4.4 8.46| -1.63 .24 | 1.5 0 1.4 0 | 67 S433 (mark 12) | | 39 7 5.6 8.46| -1.69 .20 | 0.2 -2 0.2 -2 | 47 S410 (mark 15) | | 16 4 4.0 8.66| -1.70 .23 | 1.0 0 1.0 0 | 22 S323 (mark 12) | | 53 8 6.6 8.47| -1.81 .22 | 0.8 0 0.8 0 | 43 S406 (mark 19) | | 29 5 5.8 8.64| -1.89 .22 | 1.7 1 1.8 1 | 55 S420 (mark 11) | | 55 7 7.9 8.48| -1.90 .33 | 0.8 0 0.6 0 | 54 S419 (mark 21) | | 29 5 5.8 8.71| -1.99 .22 | 0.6 0 0.5 -1 | 24 S325 (mark 14) | | 39 6 6.5 8.71| -2.13 .22 | 1.7 1 1.9 1 | 60 S425 (mark 13) | | 13 2 6.5 8.77| -2.15 .37 | 2.5 1 2.6 1 | 29 S330 (mark 10) | | 30 5 6.0 8.74| -2.15 .23 | 1.9 1 1.9 1 | 70 S437 (mark 10) | | 33 5 6.6 8.76| -2.22 .25 | 0.8 0 0.8 0 | 32 S333 (mark 13) | | 21 3 7.0 8.83| -2.44 .33 | 0.8 0 0.8 0 | 50 S414 (mark 7) | | 46 6 7.7 8.80| -2.56 .30 | 0.5 0 0.5 0 | 46 S409 (mark 14) | | 55 7 7.9 8.78| -2.61 .30 | 1.0 0 0.8 0 | 73 S440 (mark 16) | | 31 4 7.8 8.82| -2.73 .39 | 0.5 0 0.6 0 | 61 S426 (mark 8) | | 32 4 8.0 8.86| -2.76 .43 | 0.3 -1 0.3 -1 | 57 S422 (mark 10) |
(Continued on next page)
A RANK-ORDERING METHOD FOR EQUATING TESTS 223
Rankings, Partial Credit Model Table 7.1.1 Script Measurement Report
(arranged by mN).
-----------------------------------------------------------------------------------------| Obsvd Obsvd Obsvd Fair-M| Model | Infit Outfit | | | Score Count Average Avrage|Measure S.E. |MnSq ZStd MnSq ZStd | Nu Script | -----------------------------------------------------------------------------------------| 16 2 8.0 8.88| -2.83 .60 | 0.6 0 0.6 0 | 8 S308 (mark 11) | | 0 0 | |Unmeasurable | 39 S340 (mark 45) | -----------------------------------------------------------------------------------------| Obsvd Obsvd Obsvd Fair-M| Model | Infit Outfit | | | Score Count Average Avrage|Measure S.E. |MnSq ZStd MnSq ZStd | Nu Script | -----------------------------------------------------------------------------------------| 29.3 6.5 4.6 4.59| .00 .26 | 1.0 -0.2 1.0 -0.2| Mean (Count: 73) | | 14.3 2.1 2.0 3.24| 1.61 .12 | 0.6 1.0 0.6 1.0| S.D. | -----------------------------------------------------------------------------------------RMSE (Model) .28 Adj S.D. 1.59 Separation 5.61 Reliability .97 Fixed (all same) chi-square: 2665.8 d.f.: 71 significance: .00 Random (normal) chi-square: 68.5 d.f.: 70 significance: .53 ------------------------------------------------------------------------------------------