A Replication of the Use of Regression Towards the Mean (R2M) as an Adjustment to Effort Estimation Models Martin Shepperd Brunel University, UK
[email protected]
Michelle Cartwright Brunel University, UK
[email protected]
Abstract
the phenomenon of regression to (towards) the mean, originally described by Sir Francis Galton as “regression towards mediocrity” [4]. Galton related the height of children to the average height of their parents, but found that the children of parents with an extreme value for average height tended towards the overall mean height of children, and vice versa for those where the average parental height was low. The Jørgensen et al. [10] work not only proposed an improvement to the existing method of estimation by analogy but then went on to validate their ideas on five different data sets and reported considerable empirical support for their proposal. The aim of this paper is to perform an external replication of the Jørgensen et al. study. We were motivated both by the seeming effectiveness of the technique and by its simplicity. To accomplish this we use two other small industrial data sets and compare accuracy levels with and without this adjustment. We were also aware of the growing demand for meta analyses and growing bodies of evidence in empirical software engineering [15, 20, 21]. Replication of an empirical study, to lend support to conclusions or otherwise to question conclusions or method, is a relatively uncommon research activity in software engineering, despite its accepted importance in scientific research in general [22, 26]. Indeed, outside of the area of software inspection techniques, explicit replication, particularly external replication is rare. The results of a search for papers describing replications is summarised in Table 1 below. A keyword search on “replication” was conducted across seven journals (CACM, TSE, TOSEM, IST, JSS, SPE, IS) using the ISI Web of Science, and across all years indexed. Of the 65 documents retrieved, the vast majority use the term replication to mean something other than replication of empirical studies. They refer to replication in some “systems” sense, for instance, data replication, server replication, object replication and so on. Whilst this search was limited in its coverage, and conference proceedings were not included, in the absence of any reason to believe these particular journals are disinterested in publishing reports of
OBJECTIVE - the aim of this investigation is to perform an independent replication of the Jørgensen et al. study that advocates exploiting a phenomenon known as regression to the mean for software project productivity when predicting software project effort. METHOD - we used two further industrial data sets in which we compare accuracy levels with and without this adjustment. RESULTS - our results were broadly consistent with those from the Jørgensen study. Using the R2M resulted in a small increase in predictive accuracy. For one data set it was necessary to first partition it into more homogeneous subsets. Also when there was very weak correlation between predicted and actual productivity using the sample mean was the least bad strategy. CONCLUSIONS - we believe that independent validation of results is an important activity. Specifically our results add further support for the R2M approach in that there is a small, but positive, effect upon prediction accuracy. By combining results from both studies we observe a consistency across all 7 data sets. Keywords: project management, software project effort estimation, estimation by analogy, regression towards the mean, replication, empirical analysis.
1. Introduction Improving the accuracy of predictions used in software development, such as estimation of the effort needed for a new project, is of interest to researchers and practitioners alike. For one method of estimation, estimation by analogy, Jørgensen et al. [10] have proposed exploiting a phenomenon known as regression to the mean. That is when selected projects (on which the estimates for the new project will be based) deviate from the mean, either high or low, we should adjust those figures to bring them closer to the average value for the projects in the case base. This is based on 1
Topic replication method not relevant inappropriate actual replication: inspections metrics validation maintenance/oo reuse/components selection Total
Frequency 3 54 1
from some baseline, most likely the sample mean, are later observed to hold less extreme values. This could be a repeated measurement taken over time, or for a prediction based on some initial measurement. Since in experiments and trials, measurements tend to be taken pre and post test, it is easy to see why a researcher might attribute a change in the observed value to the intervention carried out. In particular, they are likely to be carrying out research to demonstrate the effectiveness of some technique, so this is what the investigator is hoping to observe. This is sometimes known as the regression fallacy. Similarly this may also occur where a subject is included in a study because of an extreme measurement, only to find that subsequent measurements are less extreme. Such longitudinal studies occur in software engineering research, for example assessing the affects of a measurement program in a target organization. An apparent improvement may also occur when an attribute is measured in different ways pre and post test. It is considered to be a result of the failure to understand variation in measurement [16]. Some of the extreme observations will be truly high (or low) whereas others will merely appear to be because of some random variation, or measurement error, despite having less extreme underlying values. It is the latter that will tend to move toward the mean. Those observations that have very high pre test values, will according to the regression effect, show the greatest decrease in their values, and vice versa for those observations with very low pre test values. The problems with regression to the mean can be alleviated by randomization and by use of control groups. The latter may prove problematic for empirical studies in software engineering, for reasons of cost, if using paid volunteers, and reasons of ethics, if using students as part of their program of study. Mitchell [18] asserts that regression to the mean is dependent on the assumptions that, during the period of study, the underlying conditions do indeed remain the same (ceteris paribus) and that there is an absence of autocorrelation. Autocorrelation is the dependency between residuals and is positive – positive (or negative) residuals tend to occur together – or negative – positive residuals are followed by negative residuals or vice versa. Thus negative correlation can be mistaken for regression to the mean. Kahneman and Tversky [11] argue that despite regression to the mean being a common phenomenon, people tend to look first for other explanations, however unlikely. They suggest that this is due to a belief that a predicted outcome should be representative of the input, such that this outcome variable is as extreme as the input variable. This may lead us to place too much emphasis on the power of an explanatary variable as input to some prediction, despite the acceptance that there are complex and often uncapturable interactions
3 1 2 1 65
Table 1. Replication Studies in Software Engineering Journals
replications, we may consider it representative. Thus, we believe this paper serves two purposes. First, and obviously, we are seeking independent and additional evidence for a promising technique. Second, we wish to consider some of the issues involved in conducting an external replication. One of these issues is whether or not to attempt an exact replication. Miller [17] notes that even the traditional sciences have moved on from the notion that replication must be exact. He considers the difficulties in performing an exact replication in many areas of software engineering research and summarises: “replication in software engineering is fated to be further removed from exact duplication than traditional sciences. Is this important? the short answer is no. What is important is that the replication examines the same(or a generalised or specialised version of the same) hypothesis.” This is what we intend to do, we will test the same hypothesis as Jørgenson et al., using different datasets. Miller suggests an exact replication, using the same data will set up a correlation between the studies thus reducing confirmatory evidence since the statistical independence of the studies is compromised. Moreover, concentrating on replication the exact procedure simply verifies the original design rather than supporting (or not) the original hypothesis. The rest of the paper is organised as follows. Regression to the mean in other areas is briefly discussed in Section 2. Section 3 describes the replication method and data sets, Section 4 the results and Section 5 the conclusions and implications concerning replication within software engineering.
2. Regression to the Mean The phenomenon of R2M occurs when extreme observations, i.e. those where the attribute of interest is furthest 2
within software development that will have some effect on, for example, development effort. Regression to the mean has recently received most attention in medical and sports science, where a number of articles consider it a threat. This is particularly true in observational studies or comments on such studies where there is a risk of observing apparent treatment effects which may be explained by this statistical phenomenon. In other words, the lack of awareness of regression toward the mean might lead a researcher to erroneously conclude that a treatment or intervention has an effect. In medical trials the use of control groups helps avoid this problem. However, in other studies, the use of control groups is not always possible. Subsequently researchers in sports sciences have reported the “threat” [23] or the dangers [19] of regression to the mean and solutions to the problem. A common method identifying regression to the mean is to observe a negative relationship between the difference of follow up and baseline values and the baseline values. This method is criticised by Bland and Altman [5] for producing erroneously high correlations. Lee and Smith [14] discuss regression to the mean and decision making, using gambling behaviour as an example. Imperfect correlation, i.e. any two variables meeting certain conditions may exhibit regression to the mean, these two variables may be positively and imperfectly correlated, and thus regress to the mean relative to each other. We may see an imperfect correlation between an objective and a subjective probability, and so the implication is that events with the most extreme objective probability will have less extreme subjective probabilities and vice versa [7]. Thus using objective probabilities to predict subjective ones, regression to the mean by the subjective probabilities will indicate underconfidence and using subjective probabilities to predict objective ones, the objective probabilities regressing to the mean will indicate overconfidence. This has implications for prediction in software engineering, for example using objective measures to predict an essentially subjective issue, such as project success, or some subjective expert opinion to predict an objective measure, e.g. effort. Lee and Smith argue that while the best performing sports teams will on average continue to perform above average, they will regress to the mean (performance depending upon chance as well as skill, thus there is an imperfect correlation). This may be considered analogous to characteristics such as overall project productivity, since the productivity depends on a number of hard to capture variables. To summarise, regression to the the mean is something that empirical software engineering researchers and practitioners should be aware of. For this particular study, it is a phenomenon we seek to exploit to improve the accuracy of our predictions. In much empirical research, or in practice when trying to assess cause and effect of some technique, it
is a threat. It is something about which we should be cautious in order to avoid ascribing a change in the values of our attribute of interest to some intervention we have made.
3. Method For our replication of the Jørgensen study we selected two further software project effort data sets, namely Atkinson2 and Telecom-1. The data sets were selected due to their comparative similarity in terms of size and application domain. Their relative simplicity also renders comparison with the previous study more straightforward rather than potentially allowing the study to become bogged down in the complexity of the statistical analysis. Table 2 summarises the basic characteristics of each data set which are also reproduced in full in Tables 11 and 12. Both data sets are based upon a set of maintenance or enhancement projects to a large underlying telecommunications product. For the Atkinson-2 data set size was measured using a variant of Function Points known as Realtime Function Points (RTFP) extended to include aspects of the data model. Further details may be found in [2]. The Telecom-1 data set differs slightly in that there is no FP measure available so instead we used Changes which was a simple count of the number of modifications to be implemented and therefore known at the time of making a prediction. Both data sets are smaller than those employed by the Jørgensen study. The Jørgensen study used an estimation by analogy procedure [24] which used a single nearest neighbour procedure to identify the most similar project and utilise the productivity value from the donor or analogous project for the target project. Similarity is measured using Euclidean distance in standardised feature space1 . The productivity rate from the most analogous project is then combined with size (FPs) in the case of the Jørgensen study to derive predicted effort. This differs slightly from the usual application of estimation by analogy in which effort is derived directly from the analogous projects. However, in order to replicate the previous study we followed this procedure. It is widely accepted within the machine learning community that using all available features (variables) is seldom optimal [25]. Finding some subset of features that perform better, is therefore important and is known as the feature subset selection problem (FSS). Formally, the problem is believed to be NP-hard, therefore research has concentrated upon using meta-heuristic search algorithms [1]. Elsewhere we have reported very good results using a simple greedy 1 There are a variety of feature standardisation procedures such as the use of Z-scores and assigning zero to the smallest observation and one to the largest. We adopted the latter procedure. It is unclear what approach Jørgensen et al. used, however, we doubt this would have much impact upon the final results.
3
Data Set Atkinson-2
No. of projects 16
No. of Features 12
Telecom-1
18
8
Size Metric EA-RTFP Changes
Description Enhancements to a telecommunications system at U.K. company X. Enhancements to a large telecommunications system at U.K. company Y.
Table 2. Summary of Data Sets
Accuracy Indicator MMRE MdMRE Mean Absolute Residual Bias (Mean Percentage Error)
search: a forward selection algorithm [13] which is the approach we adopted for this study. So to summarise, the basic steps for each data set were as follows. 1. Generate productivity P as an additional feature for each project i.e. S/E where S is the selected output or size metric and E is actual effort.
Analogy 99% 50% 331.6 -53.3%
R2M 84% 45% 291.6 -14.5%
Table 3. Predictive Accuracy for the Atkinson2 Data Set
2. Jack knife the entire data set to determine the optimal / a good feature subset to minimise |P Pˆ |. ˆ = 3. Jack knife the entire data set to predict effort, E Pˆ ⇤ S as the standard analogy-based prediction.
Whilst it is clear that this procedure is slightly optimistic in terms of the accuracy of the predictions, since all data is used by the jack knife, this does not detract from the possibility of making relative comparisons between the basic analogy procedure and the R2M procedure. In addition, we are following the approach of the Jørgensen study so that the results are more comparable.
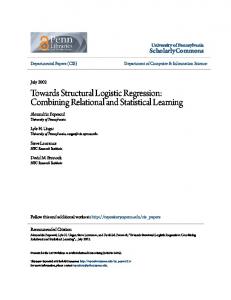
property of prediction systems which is of particular importance when dealing with a portfolio of projects. From Table 3 we see that all the accuracy indicators are modestly improved when using the R2M as opposed to the basic Analogy prediction, excepting Bias which is substantially reduced. The reason for this may be the combination of the small data set size and the affect of R2M which moves estimates to the centre from either direction. However, given the relatively small effect size and small number of data points (16 projects) it is not surprising that a one-tailed, 2-sample t-Test was unable to reject the null hypothesis of no difference between the absolute residuals (p=0.188). Figure 1 shows the distributions of the absolute residuals as boxplots. Although the median for R2M is lower it can be seen the 95% confidence limits overlap confirming the t-Test result.
4. Results
4.2. Telecom-1 Data Set Results
4.1. Atkinson-2 Data Set Results
Our basic results are summarised in Table 4. Here the results differ somewhat from Atkinson-2 because the R2M leads to poorer results for all accuracy indicators other than Bias. The boxplots of the prediction errors (as absolute residuals) are given in Figure 2. It is clear that not only does the R2M approach have a greater median error than the basic analogy but also we see the presence of an extreme outlier. As might be expected, a paired t-Test rejects the hypothesis that R2M is more accurate than Analogy (p=0.970) and indeed there is evidence for the opposite, that Analogy is more accurate than R2M (p=0.030). For interest’s sake we repeated the procedure predicting effort directly, however, this resulted in equally poor predictions for the R2M ap-
4. Adjust the analogy-based prediction using the R2M ˆR2M = Pˆ +(P Pˆ )⇤(1 c) where equation such that E P is mean actual productivity and c is the correlation coefficient between actual and predicted productivity. We used a Pearson product moment correlation.
Our basic results are summarised in Table 3. Elsewhere, we and others [12, 8] have argued that the Mean Magnitude of Relative Error (MMRE) is not always a reliable accuracy indicator since, amongst other problems, it is asymmetric. It is included, however, since it is easy to interpret, widely used and in this case consistent with the safer mean absolute residual measure. The Median Magnitude of Relative Error (MdMRE) highlights the influence of a few extreme outliers. Note we use absolute residuals since we are indifferent to the direction of the error. Finally we include Mean Percentage Error in order to show whether the prediction system is biased. We believe this is a somewhat overlooked 4
Figure 2. Side by Side Boxplots of the Absolute Residuals for the Telecom-1 Data Set Figure 1. Side by Side Boxplots of the Absolute Residuals for the Atkinson-2 Data Set
Project Type Architectural Interface Business
Frequency 11 3 4
Table 5. Project Type Frequency in the Telecom-1 Data Set
Accuracy Indicator MMRE MdMRE Mean Absolute Residual Bias (Mean Percentage Error)
Analogy 33.1% 25.9% 95.2 -33.0%
proach with R2M generating poorer results for all accuracy indicators. One possible explanation for these poor results is that the projects are not entirely homogeneous and therefore there is more than one mean value to which we should be regressing. In fact there is a categorical feature Project Type with three values (see Table 5). Using this feature we split the data set into three smaller groups and compute a separate mean and repeat the procedure given in Section 3 for each data subset. Note that two of the groups are extremely small which represents a challenge for any prediction method. An unanticipated finding with the two very small subsets (Interface and Business) was that we obtained negative correlations. In other words it was not possible to discover an effective way of predicting productivity when jack knifing only 3 or 4 projects. In such circumstances we merely
R2M 65.3% 37.7% 113.9 -21.4%
Table 4. Predictive Accuracy for the Telecom1 Data Set
5
Accuracy Indicator ARCHITECTURE n=11 MMRE MdMRE Mean Absolute Residual Bias (Mean Percentage Error) INTERFACE n=3 MMRE MdMRE Mean Absolute Residual Bias (Mean Percentage Error) BUSINESS n=4 MMRE MdMRE Mean Absolute Residual Bias (Mean Percentage Error)
Analogy
R2M
38.2% 36.3% 63.1 -24.9%
35.3% 22.9% 62.6 -29.3%
20.6% 20.5% 16.6 113.9%
9.1% 9.7% 6.0 11.0%
239.9% 81.2% 86.5 -24.9%
85.7% 70.4% 42.3 -29.3%
Table 6. Predictive Accuracy for the Architecture Projects from the Telecom-1 Data Set
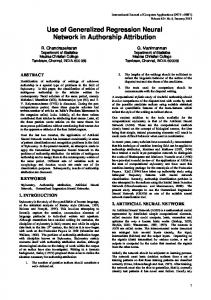
used the sample mean, P . Indeed, this would be our general recommendation for situations where there is a negative correlation between predicted and actual values. Table 6 summarises the relative performance of simple Analogy and R2M after splitting the projects into three groups and therefore regressing to three different productivity means. We see all three accuracy indicators (MMRE, MdMMRE and Mean Absolute Residual) behaving in a consistent fashion in terms of direction. Thus it would seem that R2M has a small but useful effect in reducing effort prediction errors for Telecom-1 once it is split. Having said this, there is the danger of over interpreting results with very few data points and the difference for either method in accuracy between Interface and Business projects is quite striking. We are unable to detect any clear pattern regarding Bias. Finally, all residuals may be found in Tables 8 - 10 at the end of the paper.
Figure 3. Side by Side Boxplots of the Absolute Residuals for the Architecture Projects from the Telecom-1 Data Set
4.3. Comparing Results Having presented our findings for two new data sets we combine both our and Jørgensen et al.’s results into a single table (see Table 7) in order to make an overall assessment of the value of the R2M procedure. Note that significance values refer to the probability that the null hypothesis can be rejected in favour of the alternate hypothesis that the R2M technique results in smaller prediction errors (absolute residuals) than simple Analogy. In all cases a paired t-Test is employed. For the final two splits of Telecom-1 no values are given since with 3 and 4 projects respectively 6
Study J J J J J C C C C
Data Set Jeffery & Stathis Jørgensen-97 Desharnais Finnish Mermaid Atkinson-2 Telecom-1 A Telecom-1 I Telecom-1 B
Analogy 39% 44% 42% 154% 234% 99% 38% 21% 240%
R2M 31% 39% 39% 106% 150% 84% 35% 9% 86%
Sig. 0.07 0.09 0.05 0.12 0.01 0.19 0.47 n.a. n.a.
• For more heterogeneous data sets it has to be considered whether it is better to partition the projects into smaller, homogeneous subsets so that the procedure regresses to a local productivity mean. We found this necessary for the data set Telecom-1 as also did the Jørgensen study for the Jørgensen-97 data set. Failure to do this can lead to a worsening in accuracy.
Table 7. Summary of Analogy vs R2M MMRE Results. J = Jørgensen et al. study and C = Cartwright and Shepperd study.
• The R2M adjustment procedure leads to unintuitive behaviour when the correlation between predicted and actual productivity is negative. We made a slight modification to the procedure such that we just used the sample mean.
• We found no clear pattern regarding the impact of R2M upon bias and unfortunately Jørgensen et al. did not report this information.
The tabulation of all results indicates a consistency across all seven data sets, so therefore we feel able to cautiously recommend the R2M modification to the Analogybased estimation. However, further confirmation of these results would be welcome. Reflecting upon the process of conducting a software engineering replication study in a non-experimental paradigm we would make the following observations:
such a test would be meaningless. As stated earlier, we believe Mean Absolute Residual to be safer accuracy indicator than MMRE, however, where we have the information the two measures are consistent and it does enable comparison of all the results. Whilst the absolute levels of accuracy in Table 7 are quite varied, if we consider the question of relative improvement, then there is a straightforward pattern of generally small (but given the problem domain, useful) improvements in accuracy. The pattern in terms of significance is less clear. In general, the Jørgensen study finds more significant results, i.e. with lower p-values, than we do. Obviously, looking for a relatively small effect with small data sets will make significance testing more challenging. There is, however, the wider question as to how useful significance tests are. Our difficulty is that the data sets are a far from random sample and we have an undefined population. Thus, though we have reported the results of t-Tests, we consider the direction of the effect and consistency of results to be more telling.
• A difficult judgement is how faithful must a replication be in order to permit comparison of results? In our case we used different data sets, since our primary purpose was to discover whether the same results could be found for different data sets. We used the same validation procedure, and believe this to be quite important since it is well known that different validation procedures (e.g. jack knife, bootstrap, n-fold validation) can have a marked impact upon the results. On the other hand, we differed slightly in our use of Analogy since we applied a feature subset selection search prior to locating analogies. Miller [17] asserts that the value of replication lies in analysing the results in conjunction with the original experiment – if the results are compatible, they can be considered additive, increasing confidence in the original hypothesis. An interesting question for further research is how sensitive are replication results to minor changes in procedure.
5. Conclusions In this study we have conducted an external replication of the study by Jørgensen et al. [10]. In their study they proposed a simple but useful modification to Analogy-based effort estimation by exploiting a phenomenon known as regression towards the mean. They evaluated this idea empirically using 5 data sets and reported supportive results. We repeated their analysis using two additional data sets. From this study we note the following:
• Our replication was facilitated by the detailed description of the procedure in [10]. In addition the first author kindly answered some further questions. However, as a community it would help if we publish sufficiently detailed accounts of the method to enable easy replication. (We take this as a challenge to ourselves, as well as to others!)
• Our results are in broad agreement with the Jørgensen study thus for all seven data sets we observe some relative improvement in accuracy as a result of using the R2M adjustment to productivity.
• Publication of raw results is important. If we had had access to the residuals we could have computed other 7
statistics from the Jørgensen study such as Bias and Mean Absolute Residual. It might also facilitate metaanalysis where the results from the study are combined [9].
The role of error in judgement processes.” Psychological Review, vol. 101, pp. 519-527, 1994. [8] T. Foss, E. Stensrud, B. Kitchenham, and I. Myrtveit, “A simulation study of the model evaluation criterion MMRE,” IEEE Transactions on Software Engineering, vol. 29, pp. 985-995, 2003.
Overall, we are encouraged by our results, which although minor in their own right, when combined with other results point much more strongly to the value of performing a regression towards the mean adjustment to Analogybased effort estimation. This is particularly important when identifying relatively small effects. Finally, external replications, are a useful guard against unintentional bias upon the part of the originators of a new idea; they add credibility to useful software engineering techniques and hopefully facilitate take up by industry.
[9] W. Hayes, “Research synthesis in software engineering: a case for meta-analysis”, presented at 6th IEEE International Softw. Metrics Symp., Boca Raton, Fl, 1999. [10] M. Jørgensen, U. Indahl, and D. I. K. Sjøberg, “Software effort estimation by analogy and ‘regression toward the mean’,” J. of Systems & Software, vol. 68, pp. 253-262, 2003.
Acknowledgments
[11] D. Kahneman and A. Tversky, “On the psychology of prediction,” Psychological Review, vol. 80, pp. 237251, 1973.
This work was funded by the UK Engineering and Physical Sciences Research Council under grants GR/S45119 and GR/S55347.
[12] B. A. Kitchenham, S. G. MacDonell, L. Pickard, and M. J. Shepperd, “What accuracy statistics really measure,” IEE Proceedings - Software Engineering, vol. 148, pp. 81-85, 2001.
References [1] D. W. Aha and R. L. Bankert, “A comparative evaluation of sequential feature selection algorithms,” in Artificial Intelligence and Statistics V., D. Fisher and J.-H. Lenz, Eds. New York: Springer-Verlag, 1996.
[13] C. Kirsopp, M. J. Shepperd, and J. Hart, “Search heuristics, case-based reasoning and software project effort prediction,” Proc. GECCO 2002: Genetic and Evolutionary Computation Conf., New York, 2002.
[2] K. Atkinson and M.J. Shepperd, “The Use of Function Points to Find Cost Analogies, Proc. European Software Cost Modelling Meeting (ESCOM 94), Ivrea, Italy, 1994.
[14] M. Lee and G. Smith, “Regression to the mean and football wagers.” Journal of Behavioral Decision Making, vol. 15 pp. 329-342 , 2002. [15] C. Mair and M. Shepperd, “Making Software Cost Data Available for Meta-Analysis,” presented at EASE 2004, Edinburgh, 2004.
[3] V. R. Basili, F. Shull, and F. Lanubile, “Building Knowledge through Families of Experiments,” IEEE Transactions on Software Engineering, vol. 25, pp. 456-473, 1999.
[16] T.P. Marshall, “Understanding variation”, British Medical J.,Rapid Response, 16 May, 2003.
[4] M.J. Bland, and G. Altman, “Statistics Notes: Regression towards the mean,” British Medical J., vol. 308, p. 780, 1994.
[17] J. Miller, “Replicating software engineering experiments: a poisoned chalice or the Holy Grail?”, Information & Software Technology, vol. 47 pp. 233-244, 2005.
[5] M.J. Bland and G. Altman, G. “Comparing methods of measurement: why plotting difference against standard method is misleading.” The Lancet vol. 346(8982) pp. 1085-1087, 1995.
[18] D. P. Mitchell, “Concerning regression to the mean,” British Medical J.,Rapid Response, 27 May, 2003. [19] A. Nevill, R. Holder, G. Atkinson, and J. Copas, “The dangers of reporting spurious regression to the mean,” Journal of Sports Sciences, vol. 22, pp. 800-802, 2004.
[6] L. Briand and I. Wieczorek, “Resource Modeling in Software Engineering,” in Encyclopedia of Software Engineering, J.J. Marciniak, Ed., 2nd ed. New York: John Wiley, 2002.
[20] S. L. Pfleeger, “The role of evidential force in empirical software engineering,” IEEE Software, vol. 22, pp. 66-73, 2005.
[7] I. Erev, T.S. Wallsten and D.V. Budescu,“Simulataneous over- and underconfidence: 8
Analogy Residuals -503.91 390.91 -828.1 4.68 -514.25 -730.38 -243.91 -577.2 -346.88 -11.19 60.95 289.2 400.91 -79.87 91.89 -231.98
R2M Residuals -249.67 419.34 -855.09 190.11 -197.67 -275.53 -95.15 -522.41 -280.55 27.26 130.01 383.33 443.57 130.06 270.29 -195.42
Analogy Residuals -34.25 159.14 -327.48 74.36 53.23 -4.87 334.81 7.77 284.22 27.98 -98.43 62.76 -8.55 135.47 -114.57 -16.79 14 11.61
Table 8. Residuals for Atkinson-2
[21] L. M. Pickard, B. A. Kitchenham, and P. W. Jones, “Combining empirical results in software engineering,” Information & Software Technology, vol. 40, pp. 811-821, 1998.
R2M Residuals -59.6 102.72 -113.26 85.58 44.46 15.16 347.13 32.43 305.59 1.65 -62.97 39.5 23.3 118.83 -164.72 1.34 19.03 20.67
Table 9. Residuals for Complete Telecom-1
[22] K. Popper, The Logic of Scientific Discovery. Routledge: Reprint edition, 1992. [23] R. J. Shepherd, “Regression to the mean: a threat to exercise science?” Sports Medicine, vol. 33, pp. 575584, 2003.
Analogy Residuals -34.25 -169.44 52.19 88.61 -100.87 -11.18 80.08 27.98 -98.43 -19.3 11.61 172.08 34.3 -92.54 353.36 278.28 -905 21.13
[24] M. J. Shepperd and C. Schofield, “Estimating software project effort using analogies,” IEEE Transactions on Software Engineering, vol. 23, pp. 736-743, 1997. [25] D. B. Skalak, “Prototype and feature selection by sampling and random mutation hill climbing algorithms,” presented at 11th Intl. Machine Learning Conf. (ICML-94), 1994. [26] G. Smith, “The problems of reduction and replication in the practice of the scientific method,” New York Academy of Sciences, vol. 406 pp. 1-4, 1983.
R2M Residuals -63.73 -224.42 47.36 90.4 -82.04 4.16 74.21 0.57 -75.22 7.78 18.93 43.58 16.23 -48.78 420.74 114.24 -210.79 16.21
Table 10. Residuals for Split Telecom-1
9
Name 1 2 3 4 5 6 8 8 10 11 12 13 14 15 16 18
Act Effort 670 912 218 595 267 344 229 190 869 109 289 616 557 416 578 438
Est Effort 691 902 274 479 308 301 234 171 333 159 238 373 308 558 861 423
Est Dur 9.5 12 9 7 6 11 3.4 2 5 5.2 6 4.7 5.2 29 23 5
EA-RTFP 27 21 59 10 10 13 8 29 49 2 4 6 3 6 7 27
IMT 0 0 1 2 2 1 1 2 2 1 3 2 1 0 0 0
IAT 0 0 2 8 8 1 5 10 2 1 3 4 2 0 0 0
IT 0 0 3 10 10 2 6 12 4 2 4 6 3 0 0 0
OMT 4 1 14 0 0 1 0 2 9 0 0 0 0 0 0 1
OAT 4 3 21 0 0 2 0 2 18 0 0 0 0 0 0 2
OT 8 4 35 0 0 3 0 4 27 0 0 0 0 0 0 3
ER 7 8 9 0 0 4 1 4 6 0 0 0 0 2 3 9
EA 12 9 12 0 0 4 1 9 12 0 0 0 0 4 4 15
ERA 19 17 21 0 0 8 2 13 18 0 0 0 0 6 7 24
Changes 218 357 136 25 263 39 377 48 118 178 59 200 53 143 257 6 5 3
Files 105 237 98 24 197 39 284 37 53 116 38 180 43 84 257 6 5 3
Development Type ARCHITECTURAL ARCHITECTURAL ARCHITECTURAL ARCHITECTURAL ARCHITECTURAL ARCHITECTURAL INTERFACE ARCHITECTURAL BUSINESS ARCHITECTURAL ARCHITECTURAL BUSINESS INTERFACE INTERFACE BUSINESS BUSINESS ARCHITECTURAL ARCHITECTURAL
Table 11. Atkinson-2 Data Set
Case Name 361 367 373 379 390 323-02 328 361-04 362-01 371-04 379-02 393 395 398 404 1114 1119 1143
EstTotal 304 274 589 480 648 186 777 136 709 333 91 446 159 342 198 30 30 34
ActTotal 305 330 334 150 545 118 1116 159 574 277 97 374 167 358 123 24 34 32
ActDevEffort 250 225 177 115 357 72 833 130 372 233 69 276 101 281 88 16 28 24
ActTestEffort 55 105 157 36 187 46 267 28 202 44 29 99 66 77 35 7 7 8
Table 12. Telecom-1 Data Set
10
UA-RTFP 15 12 47 10 10 9 7 20 37 2 4 6 3 2 3 12