A Robust Algorithm for Fiber-Bundle Atlas Construction Ulas Ziyan1 , Mert R. Sabuncu1 , W. Eric. L. Grimson1 , and Carl-Fredrik Westin1,2 1
MIT Computer Science and Artificial Intelligence Lab, Cambridge MA, USA {ulas,msabuncu,welg}@csail.mit.edu 2
Laboratory of Mathematics in Imaging, Brigham and Women’s Hospital, Harvard Medical School, Boston MA, USA
[email protected]
Abstract In this paper, we demonstrate an integrated registration and clustering algorithm to compute an atlas of fiberbundles from a set of multi-subject diffusion weighted MR images. We formulate a maximum likelihood problem which the proposed method solves using a generalized Expectation Maximization (EM) framework. Additionally, the algorithm employs an outlier rejection and denoising strategy to produce sharp probabilistic maps of certain bundles of interest. This map is potentially useful for making diffusion measurements in a common coordinate system to identify pathology related changes or developmental trends.
1. Introduction Diffusion tensor imaging (DTI) is a relatively new imaging modality that measures free water diffusion, i.e. Brownian motion, of the endogenous water in tissue. In the human brain tissue, this water diffusion is not the same in all directions, since it is obstructed by structural elements such as cell membrane or myelin. When this obstruction constrains the water diffusion in a coherent direction, such as within the cerebral white matter, the resulting water diffusion tensor becomes anisotropic, containing information about the directionality of the axon bundles. Thus, quantification of water diffusion in tissue through DTI provides a unique way to look into white matter organization of the brain. Even though DTI provides information about the water diffusion for each voxel in the brain, it does not directly image the underlying axons. Therefore, tractography is used as a common post-processing technique for DTI which attempts to reconstruct fibers from the tensor field [2]. The method works by tracing the principal diffusion direction in small steps. The resulting tracts can be grouped together into bundles. Even though the resolution of DTI is too low
to measure any individual axons, these bundles show compelling similarity to anatomical structures and suggest that at the bundle level, we are able to capture structural information [9, 10, 11]. One popular way to construct fiber bundles is to manually trace a region of interest (ROI) that is thought to correspond to a certain anatomical structure, and initialize the tractography algorithm from the set of voxels within this ROI [3]. The resulting tracts are then grouped together into a fiber bundle. A slightly more advanced variant of this technique involves seeding at every voxel in the brain that is thought to belong to the white matter, and grouping all the fibers that pass through the previously traced ROI into a bundle [15]. It is also possible to use multiple ROI’s and it has been reported that this approach improves consistency between subjects [8]. ROI based methods are popular for their flexibility but could be subject to user bias since ROI’s are manually traced. Therefore several methods have been proposed to identify anatomically meaningful regions from the DTI data without dependence on manually traced ROIs. One class of methods automatically group tractography results, which were seeded everywhere in the brain, into bundles through clustering algorithms, e.g. [9, 10, 11]. Even though resulting fiber bundles from the aforementioned algorithms, in general, match well with the known anatomy, the quality of the results suffer from low SNR and low resolution of diffusion images. These issues lead to at least two types of artifacts in tractography: early termination of fibers and deviation of fibers from one bundle to another [15]. In an attempt to reduce such errors in tractography, there have been some studies that repeat the same analysis on several individual subjects and average the results to create group maps of white matter tracts [15, 4]. By cross-subject averaging, the goal is to compensate for multiple sources of inconsistency: noise in tractography, inter-subject anatom-
ical variability and registration errors. These methods involve single subject ROI drawing, followed by bundling of tracts that pass through these ROI’s. This yields a binary image for each bundle in each subject, that represents whether a fiber from the bundle of interest is present or not in that voxel. The next step is to employ an “off-the shelf”, nonDTI registration algorithm that co-registers subjects into a common coordinate frame. This is followed by a simple averaging of the binary images. In this paper, we present a more integrated and principled method to identify corresponding regions in a group of subjects where cross-subject variability is small. We start with a group-wise clustering to identify fiber bundles in individual subjects. That is followed by a novel learning algorithm, which is optimized using the generalized Expectation Maximization (EM) algorithm [6]. This algorithm performs labeling, de-noising, outlier rejection, and group-wise registration in an iterative, integrated scheme and results in a spatial map that represent the most common structures in a group of subjects. The possible uses for such an algorithm is multi-fold. It could be used to compute a spatial atlas that retains only the most reproducible tracts. This atlas would represent consistently present white matter tract regions in a group of subjects. Knowing what is normal also provides a way to identify what is not, which is useful for pathology identification. Also of interest is a statistical framework for the comparison of different sub-populations, to identify disease-related or developmental changes.
2. Data Preprocessing In this section, the tools used for preprocessing the DTI data are introduced. These tools include diffusion tractography and the creation of a high dimensional atlas through spectral clustering of the tractography results.
2.1. Tractography Diffusion tensor imaging models microscopic diffusion in the brain tissue as a Gaussian diffusion process and encodes this information in a 3×3 diffusion tensor that is analogous to the covariance matrix of a 3-dimensional Gaussian random variable. The principal eigenvector of this tensor is aligned with the most likely direction of diffusion and that is the direction a streamline tractography algorithm aims to follow. In this work, tractography was performed using a Runge-Kutta order two integration of the underlying tensor field. The algorithm is initiated in every voxel in the brain with a CL value exceeding 0.25, since having a high CL value is an indicator of coherent diffusion [14]. The quantity CL is defined as √ λ21 −λ22 2 , where λ1 , λ2 , λ3 λ1 +λ2 +λ3
are the eigenvalues of the diffusion tensor sorted in descending order [14]. Tractography is performed at a step size of
0.5 mm until the trajectory comes to the edge of the white matter, defined by a threshold of CL = 0.15.
2.2. Initial Registration A spatial normalization is necessary to obtain a groupwise clustering of the resulting fibers. This normalization is performed using a group-wise, template-free affine registration algorithm [16], known as “congealing”, on the Fractional Anisotropy (FA) images generated for each subject. This initial normalization aims to remove gross differences across subjects due to global head size and orientation. It is thus limited to a 9 parameter affine transformation that accounts for scaling, rotation and translation. The resulting transformations are then applied to each of the computed fibers to map them into a common coordinate frame for clustering.
2.3. Fiber Clustering Fiber clustering is based on the assumption that fibers that are in the same bundle follow a similar trajectory within the tissue. To quantify this similarity, the employed algorithm uses the mean closest point distance [5]. This is defined as the average distance from each point in one tract to its nearest distance to the other tract. This distance is then symmetrized by taking the minimum of the two distances between every fiber pair. The algorithm converts this distance into an affinity measure using a Gaussian kernel. Once these affinities are calculated for every tract pair, we employed spectral clustering with normalized cuts criteria [13] to compute clusters of fibers. Once clustering is completed, an expert needs to assign anatomical labels to these clusters. This was done interactively on one of the subjects by selecting clusters one by one and assigning them anatomical labels. Since the clustering is done on a number of subjects jointly, these labels are automatically transferred to all the subjects used for the clustering stage. By clustering fibers from multiple subjects into bundles, common white matter structures are discovered in an automatic way, and the bundle models are saved with expert anatomical labels to form an atlas [12]. In the current work, we start from automatically segmented tractography results obtained through the aforementioned semi-supervised, high-dimensional atlas framework. Even though the highdimensional atlas has been shown to be useful for labeling new tracts in new subjects, the quality of a spatial atlas obtained by voxelizing a set of multi-subject images is limited (see Figure 2a). Moreover, automatic identification of consistent bundles and their localization in the common coordinate frame is not possible due to limited inter-subject alignment, cross-subject anatomical variability and tractography noise. In the following sections, we introduce several tools to discover the most consistent bundles across subjects
and obtain a very sharp atlas of these bundles. These tools include a nonlinear registration component defined on the bundles and a “tract cut” operation. We formulate the problem as maximum likelihood and solve it using a generalized EM algorithm.
L(Θ|T )
=
S X X
log
S X X
log
3. Theory
s.t.
C X
p(t, c|Θ)
c=1
s=1 t∈Ts C X
p(t, c|Θ)
c=1
s=1 t∈Ts
=
C X
q(c) q(c)
q(c) = 1,
c=1
Probabilistic atlas building as described in [15] involves a linear process of 1) registration a set of DTI images 2) labeling tracts through manually drawn ROI’s and 3) stacking the registered labels and statistical averaging, i.e. counting the number of times each voxel inherits the same label. One of the premises of such an atlas is its ability to label registered tracts. The expectation maximization algorithm we use in this work capitalizes on this premise by iteratively relabeling tracts while building the atlas. This iterative process has the advantage of ensuring that tract labels match with the atlas that is being built and therefore results in a sharper and more consistent result. (See Figure 2c). We start with a set of subjects indexed with s ∈ {1, 2, . . . , S} and a set of tracts from each subject, T = {Ts } and Ts = {t ∈ Ts }. We formulate our problem as a maximum likelihood estimation of the parameter set Θ:
Θ∗
=
arg max Θ
=
arg max Θ
=
arg max Θ
=
S Y
s=1 S X s=1
p(Ts |Θ)
for any distribution q(c), defined on the cluster labels. Now, using Jensen’s inequality: L(Θ|T )
≥ =
log p(t|Θ)
s=1 t∈Ts
arg max L(Θ|T ) Θ
The term Θ includes the parameters we wish to estimate and will be defined later to include a non-parametric spatial mixture density and registration parameters. Here we assumed the tracts are statistically independent from each other in calculating L(Θ|t), the log likelihood of the data, i.e. the observed tracts. We can then derive the Expectation Maximization update equations by marginalizing this likelihood term over a set of cluster (in this context, bundle) labels c ∈ {1, 2, . . . , C},
q(c) log p(t, c|Θ) + const(1)
s=1 t∈Ts c=1
S X X
Eq [log p(t, c|Θ)] + const.
(2)
s=1 t∈Ts
The constant term does not depend on Θ and Eq denotes expectation with respect to q. Further, the equality of Equation (1) is met if and only if q(c) = p(c|t, Θ(n) ), for a given (fixed) Θ(n) [6]. The EM algorithm maximizes this lower bound using the current estimate of the parameters, Θ(n) , in the E-step and re-estimates the parameters in the M-step. This iterative optimization is guaranteed to converge to a local optimum of the parameter set, Θ∗ . Now, let’s define the probability of a tract through a non-parametric and voxelized spatial mixture density distribution: p(t|Θ)
,
C X
πc p(t|c, Θ)
c=1
=
log p(Ts |Θ)
S X X
S X X C X
C X c=1
πc
Y
θc (⌊x⌋),
x∈Rs (t)
P where πc are the mixture weights and c πc = 1. Rs : R3 7→ R3 is a subject-specific spatial transformation and Rs (t) denotes a tract obtained by applying the spatial transformation to a tract t. x ∈ R3 are the samples along a given tract and ⌊x⌋ denotes quantization of x, i.e., the voxel that sample falls into. And, finally, θc (⌊x⌋) represents a non-parametric spatial distribution, quantifying the spatial probability of observing tracts from cluster c. Naturally, P x∈X θc (x) = 1 for all c ∈ C. Then, the parameter set we wish to estimate become, Θ = {θc (⌊x⌋)} ∪ {πc } ∪ {Rs }. In the next sections we will derive the specific update equations for our formulation to iteratively estimate Θ∗ .
3.1. E-Step In the E-step, the algorithm updates the membership probabilities for each of the tracts given the current estimate
of the parameter set Θ(n) . p(c|t, Θ(n) ) ∝ p(t|c, Θ(n) )p(c|Θ(n) ) j k Y ∝ πc(n) θc(n) Rs(n) (x)
Then for each subject, the registration parameters are up(n+1) dated as Rs :
(3) (4)
arg max Rs
x∈t
(n)
, p˜tc ,
where, at every iteration (n),
3.2. M-Step
(n) ˜tc cp
arg max = 1 for all tracts t.
Rs
arg max Θ
Rs
(n) p˜tc
Rs
Rs
Θ
S X X C X
(n) p˜tc
"
log πc
s=1 t∈Ts c=1
arg max Θ
S X
X
C X
s=1 t∈Ts c=1
X
Y
x∈t
(n) p˜tc log πc +
θc (x) = 1 , for all c and
x
j k θc ( Rs(n) (x) ) X
(n)
x∈Rs (t)
X
C X
#
πc = 1
c=1
log θc (⌊x⌋)
(6)
c
For a fixed parameter set Θ(n) the update equations for (n+1) (n+1) πc and θc (x) can be derived using Lagrange multipliers for the corresponding constraints and setting the derivative of Equation (6) to zero. The resulting update equations are: πc(n+1) θc(n+1) (x)
∝ ∝
S X X
(n)
p˜tc
(7)
s=1 t∈Ts
S X X
s=1 t∈Ts
j k (n) p˜tc N (⌊x⌋ ∈ Rs(n) (t) ) (8)
j k (n) where N (⌊x⌋ ∈ Rs (t) ) denotes the number of times j k (n) warped tract samples Rs (t) appear in voxel ⌊x⌋. The P (n+1) = normalizing constants are computed so that c πc P (n+1) 1, and x θc (x) = 1, ∀c.
3.3. Registration (n+1)
(n+1)
Unlike πc and θc (x), the registration parame(n+1) ters Rs do not have an analytical solution. However, we can derive the maximum likelihood optimization function, and optimize that iteratively using a numerical scheme.
X
C X XX
C X X
c=1 ⌊x⌋∈x
arg max
log p(t, c|Θ)
C XX
log θc(n+1) (⌊x⌋)
(n) x∈Rs (t)
t∈Ts c=1 ⌊x⌋∈x
arg max
s=1 t∈Ts c=1
arg max
s.t.
C S X X X
X
(n)
p˜tc log θc(n+1) (⌊x⌋)
t∈Ts c=1 x∈R(n) (t) s
arg max
In the M-step, the algorithm updates the parameter set Θ to maximize the expected value of the log likelihood. From Equation (2), ignoring the constant term which is independent of Θ, Θ∗ can be computed as:
(n)
p˜tc
t∈Ts c=1
(5)
P
C XX
C X
(n)
N (⌊x⌋ ∈ ⌊Rs (t)⌋)˜ ptc log θc(n+1) (⌊x⌋)
log θc(n+1) (⌊x⌋)
X
t∈Ts
(n)
N (⌊x⌋ ∈ ⌊Rs (t)⌋)˜ ptc
X
log θc(n+1) (⌊x⌋)Zsc βsc (⌊x⌋ ; Rsc )
X
log θc(n+1) (⌊x⌋)Zsc βsc (⌊x⌋ ; Rsc )
c=1 ⌊x⌋∈x
arg max Rs
⌊x⌋∈x
In the last equation we parameterize the registration Rs as a set of affine transformations {Rsc } for each subject s and for each cluster c, and solve for these separately. 1/Zsc × βsc (.) denotes the spatial tract distribution for the (n+1) is the “atlas” for tracts in cluster c of subject s and θc cluster c at the current iteration. Therefore, the optimization of Equation (9) involves minimizing the Cross-Entropy between a particular subject’s tract distribution and the pooled tract distribution computed from all the subjects. We perform this optimization using a sequential quadratic programming method [7] to find the 9 affine parameters that correspond to translation, rotation and scaling (no shearing). The last step of the registration is to fuse these affine transformations to achieve a global, smooth and invertible non-linear deformation. In this study, we employed the logEuclidian poly-affine framework [1] for this purpose.
3.4. Tract Cut Even with the correct labeling and perfect registration, we will not be able to recover from the errors in tractography that is present as deviations of tracts from one bundle to another. One way to reduce the effects of this sort of artifacts is to remove the tract samples that do not agree with their corresponding tract labels. Our problem formulation offers a natural way to identify these deviating tract samples since it offers a maximum likelihood estimate for the label of each tract sample as well as the whole tract. The segments of every tract that consist of samples whose maximum likelihood label do not agree with the tract’s overall label are identified as deviating tract segments and can be separated from the rest of the tract, resulting in a shorter
(9)
tract whose every sample has the same maximum likelihood label.
3.5. Outlier Rejection Another sort of artifact is the presence of outlier tracts. Since these tracts travel into the areas that are unlikely to belong to any of the clusters that are under investigation, they can be automatically identified and removed with the introduction of a default label that has a fixed very low probability throughout the image.
an information theoretic measure of uncertainty in a probability distribution. A smaller entropy measure indicates a sharper atlas, which is due to increasing similarity in the shapes of the bundles that are used to construct that atlas. This relative similarities result from a better registration or more consistent labeling across subjects. The entropy of a spatial distribution of a specific fiber bundle in our atlas notation is defined as: Hc = −
X
θc (⌊x⌋) log θc (⌊x⌋)
⌊x⌋∈x
4. Experiments
5. Results
4.1. Data
Tracts labeled with the high dimensional atlas qualitatively conformed with the known anatomy of the white matter; however most subjects contained individual tracts deviating from one bundle to another (Figure 1 (left)). Also, the high dimensional atlas failed to label some of the tracts correctly, potentially due to registration errors. The proposed algorithm; however, was able to remove the segments of the tract bundles that were not consistent from subject to subject (Figure 1 (right)). Removing inconsistencies between subjects before averaging resulted in a qualitatively sharper atlas, which is presented in Figure 2. The colored overlays indicate the probability of a tract bundle being present in any location in the brain. A whiter color indicates regions where there were more consistent alignment in the labeled tracts among the subjects, resulting in higher probability values. Spatial probabilities were greatest in the central regions of the bundles under investigation in all three atlases. However, these probabilities increase in the central regions and decrease in the perimeters with improved registration and corrected labels through the proposed algorithms. This resulting improvement in the atlas quality is quantified in Table 1 through the distribution entropies. This analysis indicates that the smaller structures benefit more from the better registration and label correction the EM algorithm provides. The resulting atlas through the proposed algorithm is also presented as isoprobability surfaces to qualitatively inspect the resulting distributions in 3D (Figure 3). These spatial distributions retained very little of the tractography noise that was apparent in the individuals’ tract bundles, and conformed well with the known anatomy.
Diffusion tensor MRI (single-shot spin echo EPI diffusion-weighted images, from a 1.5 T Philips scanner with SENSE parallel imaging, acquired along 30 noncollinear gradient directions (b = 700s/mm2 ), with five non-diffusion-weighted T2 images, 2.5 x 2.5mm x 2.5mm voxels, and 50-60 slices per subject covering the entire hemispheres and the cerebellum) was analyzed for 15 subjects. Tractography was performed in each subject using Runge-Kutta order two integration, with the following parameters: seeding threshold of CL = 0.25, stopping threshold of CL = 0.15, step size of 0.5mm, and minimum total length of 25mm. Fiber bundle clustering is performed using a high dimensional atlas as described in Section 2.3.
4.2. Atlas Building Corpus Callosum, Cingulum and the Fornix were selected for investigation in this study, because of the specific challenges they present. These three structures are in close proximity with each other, and that results in many mislabeled fibers when labeled using a high dimensional atlas (see Figure 1 (left)). Their close proximity also results in a number of trajectories deviating from one structure to another. These are precisely the sorts of artifacts we wish to reduce through learning common spatial distributions of fiber bundles from a group of subjects. We constructed three different atlases to compare the effects of labeling algorithms on the quality of resulting group maps. The first one is constructed using the initial labels from the high dimensional atlas. A second one is built using the Expectation Maximization algorithm without the tract cut operation, and the last one is generated through the Expectation Maximization algorithm with the tract cut operation.
4.3. Quantifying Sharpness Once the atlases are built, it is of interest to quantify the quality of these atlases. We do so through entropy, which is
6. Discussion In this paper, we introduced an integrated registration and clustering algorithm to compute an atlas of fiberbundles from a set of multi-subject diffusion weighted MR images. To demonstrate the use of this algorithm, we constructed spatial distributions of three fiber bundles in close proximity. The relative closeness of these bundles cause er-
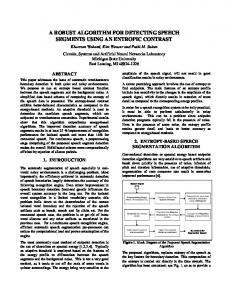
Figure 1. Tracts from Fornix (in green) and Cingulum (in purple) bundles along with a few selected tracts from Corpus Callosum (in black) as labeled using the high dimensional atlas (left) and after the EM algorithm with tract cuts (right). The tractography noise is evident in the images on the left as tracts deviating from one bundle to another. Also, these images contain instances where the high dimensional atlas failed to label the tracts correctly. The EM algorithm is able to remove the segments of tract bundles that are not consistent from subject to subject.
roneous labeling of tracts when automatically labeled with a high dimensional atlas, which handles registration and clustering problems separately. However, the integrated approach we present in this paper is able to recover from these errors, resulting in a sharper atlas that is less contaminated with the mentioned artifacts. Furthermore, we presented a fully automated atlas construction pipeline, that consists of tractography, labeling with a high dimensional atlas and group-wise correction of the labels and registrations. With the introduction of a principled outlier rejection and tract cuts, we showed that it is
also possible to retain only the tract segments that have their counterparts present in the group of subject that is being analyzed. Since all of the fiber bundles are also aligned in a common coordinate system, it is then possible to define measurement axes, which are not limited to simple curves, for each of the bundles and collect quantitative measurements for group-wise morphometry. This could prove to be a powerful statistical framework for the comparison of different sub-populations, to identify disease-related or developmental changes in the white matter anatomy.
a
b
c
CC
CI
FX Figure 2. Spatial distributions of Corpus Callosum, Cingulum and Fornix bundles from three single slices overlaid on their corresponding FA images. These maps are constructed using three different methods. a)High dimensional atlas, b) EM algorithm without tract cuts, c) EM algorithm with tract cuts. The colorbars indicate the probability of each voxel in the spatial distribution of the corresponding fiber bundle. Note that the probabilities become higher in the central regions of the bundles and the number of sporadical voxels with non-zero probabilities decrease from left to right, indicating a sharper atlas through better registration and more consistent labeling of the subjects. This observation is quantified through these distributions’ entropies in Table 1.
Method High Dim. Atlas EM w/o cuts EM with cuts
FX 8.0791 7.1830 6.8434
CC 9.6492 9.5204 9.1506
CI 8.1250 7.6818 7.0911
Table 1. Spatial probability distribution entropies for each of the structures constructed through three different methods. FX, CC and CI stands for Fornix, Corpus Callosum, and Cingulum bundles, respectively. A lower entropy value indicates a sharper distribution that is less contaminated with artifacts. Smaller structures seem to benefit more from the better registration and label correction the EM algorithm provides.
Acknowledgments This work was supported by NIH NIBIB NAMIC U54-EB005149, NIH NCRR NAC P41-RR13218, R01MH074794, NIH 1-R01-NS051826-01 and the Athinoula A. Martinos Foundation. We are grateful to Susumu Mori
at JHU for the diffusion MRI data (R01-AG20012 / P41RR15241).
References [1] V. Arsigny, O. Commowick, X. Pennec, and N. Ayache. A fast and Log-Euclidean polyaffine framework for locally affine registration. Research report RR-5865, INRIA SophiaAntipolis, March 2006. [2] P. Basser, S. Pajevic, C. Pierpaoli, J. Duda, and A. Aldroubi. In vivo fiber tractography using DT–MRI data. Magnetic Resonance in Medicine, 44:625–632, 2000. [3] O. Ciccarelli, G. Parker, A. Toosy, C. Wheeler-Kingshott, G. Barker, P. Boulby, D. Miller, and A. Thompson. From diffusion tractography to quantitative white matter tract measures: a reproducibility study. NeuroImage, 18:348–359, 2003. [4] O. Ciccarelli, A. T. Toosy, G. J. M. Parker, W. C. A. M. Kingshott, G. J. Barker, D. H. Miller, and A. J. Thompson. Diffusion tractography based group mapping of ma-
[14] C.-F. Westin, S. Maier, H. Mamata, A. Nabavi, F. Jolesz, and R. Kikinis. Processing and visualization of diffusion tensor MRI. Medical Image Analysis, 6(2):93–108, 2002. [15] D. Xu, S. Mori, M. Solaiyappan, P. C. M. van Zijl, and C. Davatzikos. A framework for callosal fiber distribution analysis. NeuroImage, 17:1131–1143, 2002. [16] L. Zollei, E. Learned-Miller, W. E. L. Grimson, and W. M. Wells III. Efficient population registration of 3D data. In ICCV, Computer Vision for Biomedical Image Applications, 2005.
Figure 3. Isoprobability surfaces of the spatial distributions of Fornix (in green) and Cingulum (in purple) bundles constructed from 15 subjects using the EM algorithm with tract cut operations. A few selected tracts from Corpus Callosum (in black) are also drawn to highlight the spatial proximity of the three bundles. These spatial distributions retain very little of the tractography noise that is apparent in the individuals’ tract bundles.
[5]
[6]
[7]
[8]
[9]
[10]
[11]
[12]
[13]
jor white-matter pathways in the human brain. NeuroImage, 19(4):1545–1555, August 2003. I. Corouge, S. Gouttard, and G. Gerig. Towards a shape model of white matter fiber bundles using diffusion tensor MRI. In ISBI, pages 344–347, 2004. A. P. Dempster, N. M. Laird, and D. B. Rubin. Maximum likelihood from incomplete data via the EM algorithm. Journal of Royal Statistical Society. Series B, 39:1–38, 1977. R. Fletcher and M. Powell. A rapidly convergent descent method for minimization. Computer Journal, 6:163–168, 1963. E. Heiervang, T. E. Behrens, C. E. Mackay, M. D. Robson, and H. Johansen-Berg. Between session reproducibility and between subject variability of diffusion MR and tractography measures. NeuroImage, 33:867–877, 2006. M. Maddah, A. Mewes, S. Haker, W. E. L. Grimson, and S. Warfield. Automated atlas-based clustering of white matter fiber tracts from DTMRI. In MICCAI, pages 188 – 195, 2005. M. Maddah, W. M. Wells, S. K. Warfield, C.-F. Westin, and W. E. L. Grimson. Probabilistic clustering and quantitative analysis of white matter fiber tracts. In IPMI, 2007. L. O’Donnell and C.-F. Westin. White matter tract clustering and correspondence in populations. In MICCAI, pages 140– 147, 2005. L. O’Donnell and C.-F. Westin. High-dimensional white matter atlas generation and group analysis. In MICCAI (2), pages 243–251, 2006. J. Shi and J. Malik. Normalized cuts and image segmentation. PAMI, 22(8):888–905, 2000.