The structural rank of a matrix A is the maximum number of nonzero entries that can be ... singular for all numerical values of the nonzero entries. Such a matrix ...
A robust approach for finding all well-separated solutions of sparse systems of nonlinear equations (online supplement) Ali Baharev
Ferenc Domes
Arnold Neumaier
August 25, 2017
How this document is structured. In Section 1 we correct some typos in BAHAREV et al. [1], and add some definitions missing in [1]. The proposed method of [1] is referred to as staircase sampling. Section 2 provides the gist of the distinguishing feature of staircase sampling, the so-called redistribution algorithm. We explain why traditional tearing fails already on an easy example, and how staircase sampling succeeds on the same problem, thanks to the redistribution algorithm. In Section 3 we walk through the details of staircase sampling; the steps of Algorithms 2, 3 and 4 of [1] are illustrated with figures. We assume that the reader has read Section 1.3 of [1] on traditional tearing. Acknowledgements. The authors are grateful to Dr. Tiago de Montanher for reading a draft of the present document and providing valuable feedback.
1 1.1
Errata Missing definitions
The structural rank of a matrix A is the maximum number of nonzero entries that can be permuted onto the diagonal with suitable row and column permutations. (It is also known as the maximal size of a transversal, a maximum assignment, or a maximum matching in the bipartite graph of A.) The structural rank is an upper bound on the numerical rank of A. If it is impossible to permute the rows and columns of A in such a way that the diagonal is zero free, then A is singular for all numerical values of the nonzero entries. Such a matrix is called structurally singular. A set of points P is well-separated if, for any distinct points p, q ∈ P, the distance kp − qk2 is above a pre-defined small threshold, for example 10−4 . It is not a mathematical concept but more of a practical matter: In an engineering application it is usually not meaningful to distinguish two solutions that are too close due to the intrinsic uncertainty of every real-life model. 1
1.2
Typos
Mistakes in the pseudo-code of Algorithm 4 of [1]. Line 1 should be if i < h + 1 then. The cardinality of J is wrong in the pseudo-code but correct in the text: Line 4 should read Let d = max(1, dim xi−h:i − dim Fi−h:i ). Point cloud. Eq. 8 in Sec. 2.2 of [1] is not the definition of the term point cloud, although point cloud is mistakenly typeset in italic. A point cloud is a set of scattered points, often intended to approximate a manifold.
2
The gist of staircase sampling demonstrated on an example
Array slicing notation. The shorthand p:q is used for the ordered index set p, p + 1, . . . , q, where p ≤ q. When forming the subvector v p:q of a vector v, p:q is cropped appropriately if necessary; that is, invalid indices are ignored. The index set p:q is considered empty if p > q, and the expression v p:q is a valid subvector of v that has no components. The example. Our example is easy to solve; its sole purpose is demonstration. We consider 20 variables zi in the range −1 ≤ zi ≤ 1
for i = 1:20,
(1)
and ask for a solution (in this range) of the system zi−1 + 10zi + zi+1 = 1.2
for i = 1:20
(2)
where z0 := 0.1 and z21 := 0.1 to keep the formulas simple. This example is for illustrative purposes only; bound constraints in a well-defined linear problem like (2) may otherwise seem strange and pointless. The exact solution is zi = 0.1 for i = 1:20. The coefficient matrix of the system (2) is a tridiagonal matrix (see left of Fig. 1). Since it is strictly diagonally dominant, solving (2) with Gaussian elimination produces excellent results even without pivoting (G OLUB & VAN L OAN [2, Ch 3.4.10]). Yet, traditional tearing fails on this easy problem. A note on plotting vectors in 2 dimensions. It is shown in Fig. 2 how we visualize a single 20-dimensional vector: We connect the points (zi , i) (i = 1:20) with adjacent indices. This allows us to plot several vectors in one figure without ambiguity, but the connecting lines have no other meaning. 2
1
2
3
4
5
6
7
8
9 10 11 12 13 14 15 16 17 18 19 20
2
1
1
2
2
3
3
4
4
5
5
6
6
7
7
8
8
9
9
10
10
11
11
12
12
13
13
14
14
15
15
16
16
17
17
18
18
19
19
20
20
3
4
5
6
7
8
9 10 11 12 13 14 15 16 17 18 19 20 1
1 2 3 4 5 6 7 8 9 10 11 12 13 14 15 16 17 18 19 20 −1
Index i
Index i
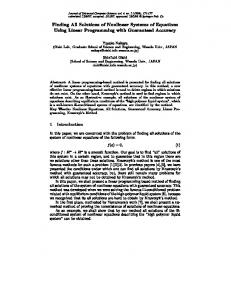
Figure 1: Left: The sparsity pattern of the coefficient matrix of problem (2). Black entries correspond to 10, gray entries to 1. Right: The same matrix ordered to bordered lower triangular form. The leading lower triangular submatrix, marked by dashed lines, is singular to working precision in 64-bit floating point arithmetic.
0
1 Value of zi
2
3
1 2 3 4 5 6 7 8 9 10 11 12 13 14 15 16 17 18 19 20 −1
0
1 Value of zi
2
3
Figure 2: Left: Plotting the 20-dimensional vector z in 2 dimensions by placing a dot at (zi , i) for i = 1:20. Right: To indicate that the dots belong to the same vector, we connect the neighboring points with linear lines, and we may omit the dots. This allows us to plot several vectors in one figure without ambiguity, but the connecting lines have no other meaning.
2.1
Traditional tearing
The error in traditional tearing can grow exponentially. For the system (2), traditional tearing boils down to the following. We order the coefficient matrix of (2) into bordered lower triangular form (BLTF) with minimal border width by moving z1 to the border, see on the right of Fig. 1. Given a numeric value for z1 , the formula for the forward substitution along the
3
diagonal of the BLTF is: zi+1 = −zi−1 − 10zi + 1.2
for i = 1:19,
(3)
and the residual r := −z19 − 10z20 + 1.1
(4)
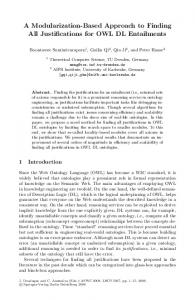
is a univariate function of z1 , that is, we have to solve the univariate equation r(z1 ) = 0 for z1 . Due to the factor 10 in (3), the error in our guess for z1 is multiplied roughly by a factor of 10 in each step of the elimination according to (3). As a consequence, this problem is literally unsolvable in this traditional setup with 64-bit floating-point arithmetic: Even if we start the eliminations from the solution (from z1 = 0.1 with 64-bit precision), z17:20 , and r do not have any correct significant digit left. The exponential growth rate of the error is shown in Fig. 3 and Table 1. To compute the magnitude of the error, we use the function f (x) := rint(log10 |x|)
(5)
where x ∈ R; |x| is the absolute value of the x; rint(x) is the nearest integer function which returns the integer nearest to x, half-integers are rounded to even numbers. 1
Index i
5
10
15
20 −1
−0.5
0 Value of zi
0.5
1
Figure 3: The partial solution vector z1:18 computed with traditional tearing, see (3); z19 is approximately 10.317 and is not shown in the figure.
4
i
δ = zi − 0.1
f (δ )
1 2 3 4 5 6 7 8 9 10 11 12 13 14 15 16 17 18 19 20
0.00000000000000001 -0.00000000000000013 0.00000000000000120 -0.00000000000001190 0.00000000000011777 -0.00000000000116587 0.00000000001154086 -0.00000000011424275 0.00000000113088658 -0.00000001119462314 0.00000011081534477 -0.00000109695882458 0.00001085877290095 -0.00010749077018493 0.00106404892894827 -0.01053299851929781 0.10426593626402977 -1.03212636412100012 10.21699770494597104 -101.13785068533869094
-17 -16 -15 -14 -13 -12 -11 -10 -9 -8 -7 -6 -5 -4 -3 -2 -1 0 1 2
Table 1: The error δ = zi − 0.1 grows roughly by a factor of 10 in each elimination step of (3); f was defined at (5). The numeric values were computed in 80-bit floating-point arithmetic, and are printed to 17 decimals.
The elimination step in which the partial solution violates the bounds for the first time. In the elimination step for z19 , we get approximately 10.317 for z19 . This is grossly violating the bound constraint z19 ≤ 1. See also Fig. 3 and Table 1. We started the eliminations from the solution for z1 (optimally rounded with 64-bit precision). Changing only the last bit of z1 already gives approximately −8.560 for z19 , violating the bound constraint −1 ≤ z19 . This is a consequence of the extreme sensitivity shown in Table 1. Thus trying other floating-point numbers for z1 will not help on traditional tearing. The leading lower triangular submatrix of the BLTF is numerically singular. For those familiar with linear algebra: The condition number estimate of the coefficient matrix of (2) is 1.5 (symmetric, strictly diagonally dominant tridiagonal matrix), whereas the condition number estimate of the leading lower triangular matrix of the BLTF is 9 · 1016 , meaning that in 64-bit floating point arithmetic it is singular to working precision. See also G OLUB & VAN L OAN [2, Ch 3.3, and 3.5.4].
2.2
Staircase sampling
The aim of staircase sampling. If we drop the last equation of (2), that is, we drop the equation for i = 20, we get the underdetermined system of equations zi−1 + 10zi + zi+1 = 1.2
for i = 1:19,
(6)
where z0 := 0.1 as before. Unlike traditional tearing, staircase sampling also uses the information in the bounds (1) on the variables; they are used to guarantee an adequate sampling of the search space. The underdetermined system (6) has infinitely many solutions within the bound constraints (1); let M denote this set (the solution manifold). The aim of staircase sampling is to find a small set of points S such that every point in M is close to one of the points in S . We call S the sample: It is an approximation to a sample from M. With the discrete set S , we are essentially discretizing the continuous set M. The sample is built up incrementally, similarly to the usual tearing approach. When staircase sampling finishes, S contains points that that are within the bound constraints (1) and satisfy (6) fairly well. The output of staircase sampling does not need to be accurate. The output of staircase sampling is used to generate starting points for iterative solvers, and therefore does not have to satisfy (2) very accurately. A fixed number of points of S are chosen as starting points in the current implementation, namely those that have the smallest residual. Simplifying assumptions. We now show how staircase sampling behaves when faced with the elimination step for z19 , where the traditional approach irrecoverably failed in the sense that z19 violated the bound constraints (1) for the first time. We shall see that staircase sampling 5
recovers from this seemingly hopeless situation. To keep the comparison between traditional and staircase sampling short, we start applying staircase sampling right after the failure of the elimination step for z19 , and we assume that all the previous eliminations for i = 1:18 were performed according to (3), as in traditional tearing. Of course, staircase sampling is more sophisticated than this, here we only give the gist of the algorithm. Applying the redistribution algorithm. Instead of giving up because z19 violates the bound z19 ≤ 1, the redistribution algorithm automatically picks a set of new values for z19 within the bound constraints. Let us assume that this set of new values is
G = {−1.0, −0.5, 0.0, 0.5, 1.0},
(7)
also shown in Fig. 4 with dots at i = 19. (G stands for guesses. Other chices reasonably covering the whole interval would work, too.) The redistribution step then works in some sense backwards: It solves the last h subproblems, where h is a user-defined constant (h stands for history). Let h = 4 in this example. That is, we solve z14 + 10z15 + z16 = 1.2 z15 + 10z16 + z17 = 1.2 z16 + 10z17 + z18 = 1.2 z17 + 10z18 + z19 = 1.2
(8)
1
1
5
5
Index i
Index i
for z16 , z17 , z18 . The values of z14 and z15 were computed previously in the forward substitution according to (3), and (8) is solved for each value of z19 in G . With z14 , z15 , and z19 fixed, (8) is a 4 × 3 system (overdetermined); solving it means that we minimize the `2 -norm of the residuals. The results are shown Fig. 4 and Table 2, and summarized in the next paragraph.
10
15
20 −1
10
15
−0.5
0 Value of zi
0.5
20 −1
1
−0.5
0 Value of zi
0.5
1
Figure 4: Left: The known part of the partial solution vector before solving (8), and G given at (7). Right: 5 partial solution vectors after solving (8); each one is bound feasible. See also Table 2. 6
i
δ
f (δ )
ε1
f (ε1 )
ε2
f (ε2 )
ε3
f (ε3 )
ε4
f (ε4 )
ε5
f (ε5 )
15 16 17 18 19
0.0011 -0.0105 0.1043 -1.0321 10.2170
-3 -2 -1 0 1
0.0011 0.0009 -0.0112 0.1111 -1.1000
-3 -3 -2 -1 0
0.0011 0.0004 -0.0061 0.0606 -0.6000
-3 -3 -2 -1 0
0.0011 -0.0001 -0.0010 0.0101 -0.1000
-3 -4 -3 -2 -1
0.0011 -0.0006 0.0041 -0.0404 0.4000
-3 -3 -2 -1 0
0.0011 -0.0011 0.0092 -0.0909 0.9000
-3 -3 -2 -1 0
Table 2: The error zi − 0.1 and its magnitude for i = 15:19. The error values δ belong to traditional tearing and are identical to Table 1; f was defined at (5). The error values εk belong to staircase sampling, where z19 is the kth element of G given at (7). See also Figure 4. The redistribution algorithm fixes the root cause of the failure of traditional tearing. The primary reason why traditional tearing fails is the exponential growth rate of the error in z. The redistribution step fixes precisely this problem: As it can be seen in Table 2, the magnitude of the error in zi remains either unchanged or it even decreases between z15 and z16 after a single redistribution step. The exponential error growth rate still remains for z16:19 , although the maximum error is at least one order of magnitude less than what it was before with traditional tearing. The redistribution step was applied only once in this example. If we apply the redistribution step again after the next elimination step, it breaks the exponential error growth rate between z16 and z17 , and so on. If the redistribution step is applied after each elimination step throughout the entire elimination process, it indeed breaks the exponential error growth rate. This is shown in the next section for our running example (2). Thus staircase sampling overcomes the primary failure mode of traditional tearing.
3
The algorithmic steps of staircase sampling
A note on robust sampling and sensitivity analysis. In this particular linear example, robust sampling and sensitivity analysis boils down to choosing k equidistant points between the variable bounds, where k is determined by the parameter settings. We will nevertheless say ‘robust sampling and sensitivity analysis’ to indicate that in the general case a more sophisticated procedure is executed in that step of the algorithm. The parameter settings are chosen to produce nice figures. The sets S(i) (i = 0:N) of the partial solution vectors are going to be plotted at various stages of Algorithms 2, 3, and 4 of [1]. The numerical data for these plots were obtained by running staircase sampling, however, with woefully inadequate parameter settings from an algorithmic point of view. In particular, at most 4 points are kept at the end of each iteration, that is, Mi = 4 (i = 0:N). This parameter setting is good for demonstration purposes though, as the figures have very few points, and therefore it is easier to follow how the algorithm progresses.
7
Input. Staircase sampling requires its input to be in staircase triangular form. Problem (2) is already in this desired form, and we use its canonical lower triangular block structure, see Sec. 1.1 of [1], which in this case just means that we solve the equations in the order they appear. The variables z are also partitioned accordingly: From now on, whenever we refer to x, the vector x defined in Sec. 2.1 of [1] is meant. Processing the first subproblem (i = 1 in Alg. 2). The first subproblem is, in general, an underdetermined system of equations; processing it means discretizing its continuous solution set. In our example, the first subproblem is the single equation 10z1 + z2 = 1.1
(9)
with the bound constraints −1 ≤ z1 , z2 ≤ 1.
(10)
z1
z1
z2
z2 Variable
Variable
Staircase sampling proceeds as follows. S(0) is initialized with M0 empty vectors on line 1 of Alg. 2, then the loops on lines 2 and 3 of Alg. 2 are entered. The vector x1:i−1 is the vector of the already seen variables; it is a valid but empty vector per our notation (see the first paragraph of Sec. 2). On line 4 of Alg. 2 we call Alg. 3; the arguments to this call are x1:i−1 , which is an empty vector, and xi , which corresponds to the vector [z1 , z2 ]. On the left of Fig. 5, those points are shown that are picked by the robust sampling and sensitivity analysis on line 9 of Alg. 3 while the loop is executed 4 times. These points are 4 equidistant points for z2 between −1 and 1. We assume that the parameter settings allow at most 4 points, and we will discuss shortly why (xi )J is chosen to be z2 on line 9 of Alg. 3.
z3
z4
z5 −1
z3
z4
−0.5
0 Value
0.5
z5 −1
1
−0.5
0 Value
0.5
1
Figure 5: Processing the first subproblem (9). Left: The values chosen by the robust sampling and sensitivity analysis on line 9 of Alg. 3. Right: Given the values for z2 (black dots), we then compute z1 on line 10 of Alg. 3. This is our discretized representation of the continuous solution set of (9) over (10), that is, S(1) is plotted in the figure.
8
For each of the 4 values of z2 , the corresponding value of z1 is computed on line 10 of Alg. 3; the results are shown on the right of Fig. 5 and in Table 3. This 4-element set for [z1 , z2 ] is our way of discretizing the continuous solution set of (9) over (10); it corresponds to the set U on line 12 of Alg. 3, and S(1) on line 5 of Alg. 2.
z1
z2
0.210000
-1.000000
0.143333
-0.333333
0.076667
0.333333
0.010000
1.000000
Table 3: S(1) is a 4-element set for [z1 , z2 ]. Processing the first subproblem involved initializations (lines 1–2 of Alg. 2), and then lines 3–5 of Alg. 2 were executed for the first time, which in turn executed lines 4–12 of Alg. 3. Although lines 6–9 of Alg. 2 were also executed in the first iteration step, they did effectively nothing because Alg. 4 immediately returned on line 2 with an empty set, as h = 1 in our example. A note on the choices made in the sampling and sensitivity analysis above. We first make underdetermined subproblems square by fixing some of their variables to a numeric value, see also Sec. 2.3 of [1]. In order to make (9) a univariate equation, robust sampling and sensitivity analysis picked 4 equidistant points for z2 between −1 and 1. As we now argue, this was a good decision of the algorithm: One of the variables has to be fixed, and it is better to fix z2 than z1 since the left hand side of (9) is more sensitive to z1 , and therefore we are more likely to find a value for z1 such that (9) is satisfied. That is exactly what the algorithm recognized automatically. Processing the second subproblem up until the redistribution step (i = 2 in Alg. 2). The second subproblem is z1 + 10z2 + z3 = 1.2
(11)
with the bound constraints −1 ≤ z1 , z2 , z3 ≤ 1.
(12)
We solve (11) for z3 for each [z1 , z2 ] vector in the 4-element set S(1) that we obtained in the previous iteration, see Table 3. This involves executing lines 2–5 of Alg. 2 and lines 1–3 of Alg. 3.
9
z1
z2
z2
z2
z3 z4 z5 −1
0 Value
1
Variable
z1
Variable
Variable
z1
z3
z3
z4
z4
z5 −1 1 Value
z5 −1
0 Value
1
Figure 6: Eliminating z3 at the second subproblem (11). Left: S(1) , the input values for [z1 , z2 ] received from the previous iteration step; same as the right of Fig. 5. Middle: Performing the elimination without the bound constraints (12), as in traditional tearing. All four points map outside the bound constraints. Right: Performing the elimination, but also taking into account the bound constraints. The result is S(2) before the redistribution step. In order to compare traditional tearing to staircase sampling we show in the middle image of Fig. 6 what we get if we ignore the variable bounds (12) as in traditional tearing, and solve the linear univariate equation (11) for z3 : All four points map outside the bound constraints (12). This middle image also shows that the error in our initial estimates for z1 gets multiplied roughly by a factor of 10 in each elimination step of traditional tearing. If we enforce bound constraints as we do in staircase sampling, we get the results shown on the right of Fig. 6. Inserting additional points during the redistribution step (i = 2 in Alg. 2). After computing the values for z3 (lines 3–5 of Alg. 2), the redistribution step is performed to maintain a good coverage of the search space (lines 6–9 of Alg. 2). It is already obvious from Fig. 6 that the solution vectors in S(2) cover the range of z3 quite poorly: Only the endpoints are covered, and those are covered twice. In the first redistribution step, the first two subproblems are re-solved. The parameter h of Alg. 4 controls the maximum number of subproblems to be re-solved; in our example we assume that h = 1. Thus the problem to be solved in the first redistribution step is: 10z1 + z2 = 1.1 z1 + 10z2 + z3 = 1.2 −1 ≤ z1 , z2 , z3 ≤ 1,
(13)
after making this underdetermined system square by fixing the least influential variables that were introduced with the last subproblem. In general, robust sampling (lines 3–8 of Alg. 4, called from line 7 of Alg. 2) is used to compute the numerical values to which these least influential variables are fixed. However, z3 is the only variable that we can select in our example: The second (and up until now last) subproblem introduced a single new variable, z3 , and fixing it to a numerical value makes (13) square, so sensitivity analysis happens to be unnecessary in
10
z1
z2
z2
z2
z3
z3 z4
z4 z5 −1
Variable
z1
Variable
Variable
z1
0 Value
1
z5 −1
z3 z4
0 Value
1
z5 −1
0 Value
1
Figure 7: Inserting new points during the redistribution step. Left: The input, S(2) , before the redistribution step; z3 is covered only at the endpoints. This image is the same as the right of Fig. 6. Middle: Robust sampling picks 6 equidistant points for z3 to maintain a good coverage of the search space. Right: After computing the [z1 , z2 ] values from (13) for the newly inserted z3 values, only these 4 solution vectors remain. These 4 vectors are our discretized representation of the continuous solution set of (13), that is, this is S(2) after the redistribution step. our example. Before entering the loop on line 9 of Alg. 4, we have 6 equidistant candidate points for z3 between −1 and 1 in the set T (Fig. 7, middle); inserting more points was not allowed by our parameter settings. Two of these points, the two endpoints, are excluded from further consideration (lines 9–10 of Alg. 4) since the previously obtained solution vectors already cover the endpoints. For the remaining 4 points (marked by black dots in Fig. 7, middle), we solve (13) for [z1 , z2 ] after fixing z3 to the value chosen by the sampling. This executes lines 11–15 of Alg. 4; the results are shown in the right image of Fig. 7. After discarding the too infeasible solution vectors (line 8 of Alg. 2), only the newly inserted 4 points remain (Fig. 7, right); this is S(2) after the redistribution step. (The fact that only the newly inserted points remained is a clear indication that the parameter settings – used here solely for the visual demonstration of the algorithm – are bad, and the sample size parameter Mi should be increased. Nevertheless, the algorithm survives this incredibly poor choice of parameter settings, and it will continue with these 4 solution vectors.) The following iteration steps. Since the problem is linear, and the subproblems are essentially the same (only the indices are shifted), the behavior presented for i = 2 will repeat in the remaining iteration steps of staircase sampling. This is demonstrated in Figure 8.
11
z2
z2
z3
z3
z4
z4
z5 z6
z6 z7
z8
z8
z9
z9 −0.5
0 Value
0.5
z10 −1
1
z1
z1
z2
z2
z3
z3
z4
z4 Variable
Variable
z5
z7
z10 −1
z5 z6
z8
z8
z9
z9 0 Value
0.5
z10 −1
1
z1
z1
z2
z2
z3
z3
z4
z4
z5 z6
z8
z8
z9
z9 0 Value
0.5
z10 −1
1
1
−0.5
0 Value
0.5
1
−0.5
0 Value
0.5
1
z6 z7
−0.5
0.5
z5
z7
z10 −1
0 Value
z6 z7
−0.5
−0.5
z5
z7
z10 −1
Variable
Variable
z1
Variable
Variable
z1
Figure 8: From left to right and from top to bottom: S(i) for i = 1 : 6 after executing line 9 of Algorithm 2. The plots were computed with Mi = 4 and h = 2.
12
Variable
The approximate solution vector at the end. The output of staircase sampling is a set of approximate solutions to (2); the one that violates (2) the least is shown in Fig. 9, together with the analytic solution (dashed line). There is a spike at z19 in the approximate solution vector; this z1 z2 z3 z4 z5 z6 z7 z8 z9 z10 z11 z12 z13 z14 z15 z16 z17 z18 z19 z20 −1
−0.5
0 Value
0.5
1
Figure 9: The output of staircase sampling, the solution vector that violates (2) the least, and the analytic solution (a vertical dashed line at zi = 0.1 for i = 1 : 20). spike is due to (i) the bad parameter settings with which we ran the algorithm and which led to poor discretization, and (ii) an implementation artifact, namely we do not run the redistribution step after solving the last subproblem. With proper parameter settings the spike practically vanishes, but future improvements will nevertheless address the implementation artifact.
References [1] A. Baharev, F. Domes, and A. Neumaier. A robust approach for finding all well-separated solutions of sparse systems of nonlinear equations. Numerical Algorithms, 76:163–189, 2017. ISSN 1572-9265. URL https://doi.org/10.1007/s11075-016-0249-x. [2] G.H. Golub and C.F. van Loan. Matrix Computations. The Johns Hopkins University Press, Baltimore, USA, 3rd ed., 1996.
13