7th International Conference on Advanced Computational Intelligence Mount Wuyi, Fujian, China; March 27-29, 2015
A Robust Gesture Recognition Algorithm Based on Surface EMG Ke Lin, Chaohua Wu, Student Member, IEEE, Xiaoshan Huang, Student Member, IEEE, Qiang Ding, and Xiaorong Gao, Member, IEEE
Ahstract- This study researched a robust gesture recognition
algorithm based on EMG. The proposed algorithm only needs very limited training data (lor 2 training trials for each gesture).
The contribution of the proposed algorithm was
mainly three-fold. First, a shrinkage approach was applied to estimate
the samples'
covariance
matrix,
which
helped
to
improve the robustness of the algorithm. Second, to evaluate the system performance, classification accuracy and gesture number to be recognized was compromised using information transfer rate (ITR). We found a system which can recognize 10 gestures could achieve similar ITR as the system which can recognize 20 gestures. However, the 10-gesture system was more robust. Third, K-L divergence was used to evaluate the
separability of the EMG signals from different gestures. The result of a 5 subj ect experiment showed that the classification
accuracy of 10 gestures using 2 trials as training set can reach
85%.
I. INTRODUCTION
G
E ST UR E recognition was an important branch of human-computer interface. Gesture recognition system based on electromyography ( EMG) was shown much attention because it is low-cost, natural to use and easy to wear[l], [11]-[15]. EMG based gesture recognition developed greatly in recent decades. Chen et al. used two channels of EMG to classify 16 gestures, the classification accuracy could reach over 80%[2]. Chu et al. used principle component analyses and a self-organizing feature map to classifY 6 gestures; the accuracy could reach over 97%[3]. Kosmidou et al. used 3.5 second EMG data to classifY 9 gestures; the classification accuracy can reach over 97%[4]. Chan and Englehart proposed a continuous myoelectric control for powered prostheses using hidden markov models, and the average accuracy was 9 4.63% for 6 gestures [9]. Powerful classifiers such as artificial neural network was also used in EMG based gesture recognition and it could also achieve a great result [10]. Even though these approaches had excellent performance, they still faced many problems in practical use. First, these Manuscript received November 21, 2014. This work was supported by National Basic Research Program (973) of China (no. 2011CB933204), National Natural Science Foundation of China under grant 90820304, 91120007 and Huawei Technologies Co. , Ltd. . K. Lin is with Tsinghua University, Beijing, C O 100084 China (e-mail
[email protected]). C. H. Wu is with Tsinghua University, Beijing, CO 100084 China (e-mail xs. wuchaohua@gmail. com). X. S. Huang is with Tsinghua University, Beijing, CO 100084 China (e-mail:
[email protected]). Q. Ding is with Huawei Technologies Co. , Ltd, Beijing, CO 100085 China (e-mail q. ding@huawei. com). X R. Gao is with Tsinghua University, Beijing, CO 100084 China (phone: +86-10-62781539; e-mail: gxr-dea@mai1. tsinghua. edu.cn).
978-1-4799-7259-3/15/$31.00
©lOIS IEEE
methods require a large number of data, which was collected just before the test, to train the classifier. Using data collected in previous days to predict the current data might make the classification accuracy drop significantly. Collecting enough training data might be very time consuming. Secondly, gestures to recognize were given in advance. Although more gestures could represent more commands, the classification accuracy may decrease. Also, it was a burden for users to remember a large number of gestures. To overcome the problems above, this study made some improvements in the algorithm from the following three aspects. First, a robust classification algorithm was developed with which a satisfactory performance could be reached using only 1 or 2 trials for training. Second, information transfer rate (ITR) was introduced to optimize the number of gestures to recognize in the system. The target of optimization was not simply to enhance accuracy or gesture numbers, but to transfer more information in a given time. This target function was more useful in practical application. Thirdly, a gesture selection method was developed in this study. It could select separate gestures automatically for each user. II
A.
E XPE RIMENT DESIGN
Experiment Equipment
An 8-channel EMG amplifier was used to collect EMG data, the sample rate was set to 1000 Hz. Then a Bluetooth module was used to transfer the data to a PC. The EMG data was shown and analyzed in the Pc.
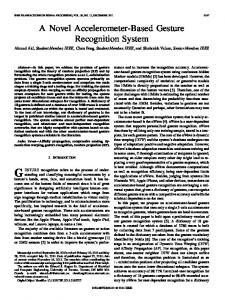
Experiment Description 5 subjects ( 4 males and 1 female, mean age 2 4.4 ± 2.1 years, all right handed) participated in the experiment. Each subject accomplished 5 times of experiment in 5 different days. At the beginning of the experiment, subjects were required to relax their arms for a while. When the EMG data was stable, the system started to collect data for training or testing. 8-channel EMG electrodes were placed on the right arm of the subject, and it was illustrated as Fig. I. The experiment program was written by M ATL A B. Subjects were required to perform gestures according to the instruction of the program. There were 20 gestures in total as shown in Fig. I[21. Subjects needed to maintain a gesture for l.5s in a random sequence, and each gesture has 20 trials. So there were 400 trials in total in one experiment. B.
131
EMG7
EMG4
(a)
GND
•
S
(b) Fig. 1.
The position of the EMG electrode (a) and gestures (b)
represented the length of the window. In (2), N 4 represented the order of the AR model, Xk represented the =
III. METHODS A.
kth point of the data, a, is the parameter of the
Threshold Method and Feature Extraction
and
To eliminate the in fluence of the noise, preprocessing was necessary. A 25 Hz-200 Hz band pass filter was applied on the EMG data. Then a threshold method was used to determine the onset and offset time of a gesture[2]. A Is resting state EMG data was used to obtain the threshold. Its mean power ,Lt, and standard deviation eJ, was calculated. The onset threshold was set to threshold was set to
,Ltr
,Ltr + 3eJr. Then
+ 6eJr, and the offset
(1)
where
N
= -
L a;xk_; +ek
( 2)
i=l
xk refers to the kth point of the window,
W
AR model
represented the estimation error of the AR model.
Each channel of each window had a 4-0 feature, so the dimension of the feature vector was 32. For each gesture, only the first 1.5s data was analyzed. The number of windows using 1.5s data could be calculated by (3). N 1.5 is the length of the data, N = 0.2 is the length w of the window, No = 0.05 is the overlap of windows. =
n
we split the EMG data
using sliding windows. Each window contained 200ms data with overlap of 150ms. When the power of EMG data in 4 consecutive windows all exceeded the onset threshold, the beginning of the first window was set to be the onset time of a gesture. When the power of EMG data in 3 consecutive windows was all less than the offset threshold, the start of the first window was set to be the offset time of a gesture. If the duration of an active gesture was less than 0.5s, this trial was excluded to avoid false triggering. After the onset of an active gesture, features of each sliding window were extracted. Mean absolute value (M AV) and the first 3 parameters of a 4 order AR model were used as features[2], [6]
xk
ek
=
(N - Nw) +1 N,
(3)
So n 27 can be easily obtained. In the recogmtlOn phase, the voting result of the 27 windows gave the final classification result. =
B.
Robust LDA
Conventional methods based on artificial neural network or hidden markov model had impressive performance when size of training data is large. However, such methods suffer from over-fitting if train data is limited. In this paper, we proposed a robust classifier based on linear discriminant analysis (LO A) and Support vector machine ( SVM). Reducing feature dimension can help to reduce the effect of over-fitting. Compared to other dimension reduction method such as principle component analysis ( PC A), LO A could find the most linear separable subspace. However, conventional LO A was required to calculate within-class covariance matrix, which cannot be estimated accurately with maximum likelihood approach when data is limited. To estimate the within-class covariance matrix with limited data, shrinkage estimation approach was introduced. The
132
equations to estimate the within-class covariance matrix is as follows: if i = } . (4) !f I,," ] '
as (9): detLo 1 -I J -I D = -[tr(LI Lo) + (PI-Po) LI (PI -po) -k-ln(--)] (9) 2 �� where PO,Pj were mean and LO,Lj were variance. It was assumed that EMG feature data for each gesture approximately followed multi-variate Gaussian distribution. The mean value was estimated using maximum likelihood approach and covariance matrix was estimated using shrinkage approach. Then, K-L divergence of two gestures' data could be calculated. Max-min distance algorithm was used to select most separable gestures. Suppose a best gesture set with N gestures was already obtained. When gesture numbers were increased from N to N +I , we calculate the K-L divergence between all the rest 20- N gestures with the best gesture set, and 20- N minimum K-L divergence was obtained. Then the gesture which was the maximum of the 20- N minimum K-L divergence was selected to be the N +I th gesture.
'
and
T;;
=
with , A*
==
{�i
tf i = } min(1,max(O,1- i'»
ifi,,"}
"..Var( T;..,) 2 " r �i-:t.j I
� ] l;;t:.
(5)
(6)
]
s", su' s}}' T;i were empirical variance (unbiased) and correlation. The deduction of (4-6) could be seen in [71. The shrinkage parameter here could be obtained analytically, which helped to avoid the high computational cost using cross validation. In this study, the feature dimension was reduced to (gesture number -I), SVM classifier uses support vectors to determine the classify hyperplane and has been proven to have better performance when training set is limited. In the training stage, features dimension were reduced using robust LD A. Then SVM was used to train the classifier. Where
C.
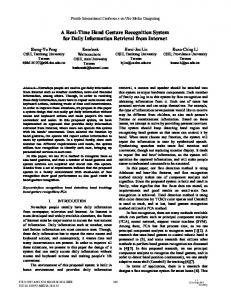
E. Algorithm Step The whole processing flow was shown as follows: I preprocessing was used to eliminate noise; 2 a threshold method was used to determine the onset and offset of a gesture; 3 Sliding window method was used to split data; 4 Mean absolute value and first 3 parameters of AR model was calculated as features; 5 First I or 2 trials were set to be training set and the rest were set to be test set; 6 Robust LD A was used to reduce feature dimension; 7 A 9-fold cross validation method was used to train the best C parameter in SVM; 8 Max-min distance method and K-L divergence were combined to get the best gesture list; 9 SVM and voting method was used to classify the test set. The flowchart of the algorithm was shown as Fig. 2.
Information Transfer Rate (ITR)
In previous gesture recognition system, more gesture numbers and higher classification accuracy were both desired, but classification might be decreased with the gesture number increasing. In this study, gesture numbers were decided using ITR which made a compromise between gesture number and classification accuracy. For a system with N targets, classification time T and classification accuracy P, the ITR was defined by (7): I-P 60 ITR =-x[log2 N+P log2 P +(I-P )log2( --)] (7) T N-I ITR took both target numbers and classification accuracy into consideration and was usually a golden standard to evaluate the system performance for a HCI system[81• Systems optimized by ITR can transfer most information in unit time, so they were more useful in practical application. D.
K-L
Divergence
When gesture numbers obtained by ITR was less than the total training gesture numbers, gestures that were more divergent should be retained to reduce the error classification. K-L divergence was used in this study to evaluate the separability among gestures. K-L divergence was defined by ( 8): D(�,PJ =
�
and
P2
[[l�(x)log �(x)-�(x)log P2(x)]dx were
two
random
distributions.
( 8) K-L
divergence was used to calculate the similarity between the two distributions, and lower K-L divergence corresponded higher similarity. The K-L divergence between two identical distributions was O. If the two distributions were both normal distributions, the K-L divergence could be calculated
133
Fig. 2.
Flowchart of the algorithm
IV. RESULT A. K-L Divergence and Error Classification Rate To verify the rationality of the method using K-L divergence to select gestures, the relationship between K-L divergence and error classification rate of each subject using 1 or 2 trials as training set was calculated and shown in Fig.3. It was supposed that larger K-L divergence between two gestures indicated lower error classification. Then we divided the K-L divergence into five consecutive intervals: [0,3),[3,4),[4,5),[5,6),[6,+00) . It could be seen that, the assumption that larger K-L divergence indicate lower error classification was rational for all subject and the mean of subjects. So using K-L divergence to select gesture was reasonable in this study.
Fig. 4. The relationship between lTR and gesture numbers of all subjects and the mean result
V. DISCUSSION In this study, when gesture number was N , the feature dimension was reduced to N-1 . The between-class covariance matrix was used in robust LD A. The rank of this matrix was N-1 , so the highest dimension of reduced feature available was N-1 . Fig. 5. illustrated the relationship between the dimension of feature reserved and classification accuracy averaged by all subjects using 1 trial as training set. Reserved dimension was set to 1, 2, 5, 10, 15 and 19( N -1 ). From Fig. 5. we could see that the more dimension reserved, the higher accuracy was reached. So it was rational to choose N - I as the reserved dimension.
Fig. 3.
The relationship between K-L divergence and error rate
Class!fication Accuracy and the Relationship between ITR and Gesture Numbers
B.
The relationship between classification accuracy and gesture numbers was shown as table I. It could be seen that classification accuracy declined with the gesture numbers increasing and classification accuracy using 2 trials as training set was higher than that using I trial. The classification accuracy was 70.25% for 20 gestures and 85.17% for 10 gestures using 2 trials as training set. This result was satisfactory for practical use. The relationship between ITR and gesture numbers was illustrated as Fig. 4. It could be seen that accuracy using 2 trials as training set was higher than using 1 trial, so the ITR obtained by 2 trials training was higher than I trial training. More importantly, when gesture numbers were small, ITR would increase as the gesture numbers getting larger. But when gesture numbers were higher than 10, ITR reached to a plateau. Meanwhile, classification accuracy got lower when gesture numbers got larger. So more gestures did not mean higher system performance, instead, they aggravated users' burden to remember more gestures. Based on the above analysis, the best gesture numbers should be around 10.
Fig. 5. the relationship between dimension and classification accuracy
To verify the advantage of robust LD A, robust LO A+SYM, LO A+SYM and SYM without LO A were compared. The result was shown in Fig. 6. It could be seen that robust LO A+SYM achieved the best performance for all subjects. The average result showed that SYM without LO A was the worst. This result was reasonable since using LD A to reduce feature dimension could help to alleviate over-fitting caused by limited training sample. Robust LD A was more reliable in estimating within-class covariance matrix over LD A, so robust LD A method was the best among them.
134
TA BL E I
THE CLASSIFICATION ACCURACY OF DIFFERENT GESTURE NUMBERS USING ONE AND Two TRIALS AS TRAINING DATA
Gesture numbers
Single
accuracy
trial
(%)
Double
accuracy
trials
(%)
2
4
6
8
10
12
14
16
18
20
91.14
83.95
80.21
76.70
73.18
68.96
65.52
62.47
60.30
58.34
94.45
95.04
92.07
88.75
85.17
81.43
79.74
76.22
73.53
70.25
can be seen from Fig. 7 that some gestures (e.g. Gesture 11, 12, 19) had larger K-L divergence from others and were more separable. So gestures that had larger K-L divergence should be used preferentially.
Subj.cl1
Subj.ca
Subj.cl3
Subj.ct4
Subj.clS
M••n
Fig. 6. Comparison of robust LDA+SVM, LDA+SVM and SVM methods
To compare the performance of the proposed method with the state-of-the-art method, we applied the method based on HMM proposed in a previous study [9] on the same dataset. The mean accuracy of 20 gestures recognition was listed in table 2. When training data was limited, the accuracy of the HMM based method was lower than the proposed method. Generally speaking, HMM is a good model for sequential data. However, when train data is limited, reliable estimation of the parameters is difficult, even when emission distribution is simple normal distribution.
Fig. 7. K-L divergence between all gestures and the mean K-L divergence from I gesture to others
Ten gestures which had the largest K-L divergence from others were selected based on Fig. 7. and illustrated as Fig. 8. These gestures with order of priority were more separable and were recommended to use in future use for researchers.
T A BL E II
COMPARISON OF ACCURACY OF THE PROPOSED METHOD AND HMM The Proposed
1 trial 2
trials
Method
HMM
58.34
55.10
70.25
64.78
The matrix of K-L divergence between all gestures were calculated and shown in Fig. 7. The color of pixel with x-axis n and y-axis m represented the K-L divergence between Gesture n and Gesture m. So the diagonal of the matrix were all zeros. The mean K-L divergence from 1 gesture to others was also calculated and shown in Fig. 7. It
135
N. Wang, Y. Chen, and X. Zhang, "Realtime recognition of multi-finger prehensile gestures," Biomed. Signal Processing and Control, vol. 13, pp. 262-269, 2014. [7] J Schafer and K. Strimmer, "A shrinkage approach to large-scale covariance matrix estimation and implications for functional genomics," Stat. Appl. Genet. Mol. BioI. 4, Article32, 2005. [8] D. J. McFarland, W. A. Sarnacki, and .1. R. Wolpaw, "Brain-computer interface (BCI) operation Optimizing information transfer rates," Bioi. Psychol., vol. 63, no. 3, pp. 237-251, 2003. [9] A. D. C. Chan and K. Englehart, "Continuous myoelectric control for powered prostheses using hidden Markov models," IEEE Trans. Biomed. Eng. vol. 52, no. 1, pp. 121-124, 2005. [10] A. M. Rezwanul, M. I. Ibrahimy, and O. O. Khalifa, "Optimization of neural network for efficient EMG signal classification," Mechatronics [6]
and its Applications (ISMA). 2012 8th Int. Symposium on. IEEE.
Fig. 8.
pp.1-6. [11] H. Ghasemzadeh, S. Ostadabbas, E. Guenterberg, and A. Pantelopoulos, "Wireless Medical-Embedded Systems A Review of Signal-Processing Techniques for Classification," Sensors Journal. IEEE, vol. 13, no. 2, pp. 423-437, 2013. [12] A. Chowdhury, R. Ramadas, and S. Kannakar. "Muscle computer interface: A Review," ICoRD'13. Springer India, pp. 411-421, 2013. [13] J Cannan and H. Huosheng, "Human-Machine Interaction (HMI) A Survey," University of Essex, 2011. [14] K. R. Wheeler, "Device control using gestures sensed from EMG," In Soft Computing in Industrial Applications, 2003. SMCiaI03. Proceedings of the 2003 IEEE International Workshop on IEEE, pp. 21-26. [15] A. M. Rezwanul, M. I. Ibrahimy, and 0 0 Khalifa, "EMG signal classification for human computer interaction: a review," European Journal of Scientific Research, vol. 33, no. 3, pp. 480-501, 2009.
Ten most separable gestures with order of priority
VI. CONCLUSIONS A robust gesture recognition algorithm using surface EMG was discussed in this study. Using only 1 or 2 trials as training set, this algorithm could classify 20 gestures with relatively high accuracy. Because the training sample was limited, a shrinkage estimation approach was used to calculate the covariance matrix to enhance the robustness of the algorithm. ITR was introduced to evaluate the system's performance and determine the best gesture numbers. From the result it could be seen that ITR in 10-gesture system had a similar performance as 20-gesture system, but the classification accuracy for 10 gestures was significantly higher. So using 10 gestures in this gesture recognition system was more reasonable. The classification accuracy for 10 gestures using 2 trials as training set could reach to over 85%. ACKNOWLEDGMENT
This work was supported by National Basic Research Program (973) of China (no. 20 11C B93320 4), National Natural Science Foundation of China under grant 90 82030 4, 91120007 and Huawei Technologies Co., Ltd.. REFERENCES [1]
[2]
X. Zhang, X. Chen, Y. Li, V. Lantz, K. Wang, and J. Yang, "A framework for Hand Gesture Recognition Based on Accelerometer and EMG Sensors," IEEE Trans. On Systems, Man and Cybernetics Part A: Systems and Humans, vol. 46, 2011, pp. 1064--1076. X. Chen, X. Zhang, Z. Zhao, .1. Yang, V. Lantz, and K. Wang, "Multiple Hand Gesture Recognition Based on Surface EMG Signal," ICBBE 2007, The 1st Int. Con! on Bioinformatics and Biomedical Engineering, pp. 506-509.
[3]
[4]
[5]
J. Chu, 1. Moon, and 1. Mun, "A real-time EMG pattern recognition system based on linear-nonlinear feature projection for a multifunction myoelectric hand," IEEE Trans. Biomed. Eng., vol. 53( 11), 2006, pp. 2232-9. V. E. Kosmidou, L. J. Hadjileontiadis, and S. M. Panas, "Evaluation of surface EMG features for the recognition of American Sign Language gestures," in Proc. IEEE 28th Annu. Int. Con[ EMBS, New York, 2006, pp. 6l97---Q200. C. Wang, X. Chen, Z. Dong, Y. Zhang, and .1. Yang, "A Real-Time DSP-Based Gesture Interaction System," Chinese journal of sensors and actuators, vol. 24, no. 5, pp. 688-693, 2011.
136