JOURNAL OF SOFTWARE, VOL. 4, NO. 5, JULY 2009
391
A Semantic Approach for Document Clustering Khaled B. Shaban Department of Computer Science and Engineering, Qatar University, Doha, Qatar Email:
[email protected]
Abstract— Conventional document mining systems mainly use the presence or absence of keywords to mine texts. However, simple word counting and frequency distributions of term appearances do not capture the meaning behind the words, which results in limiting the ability to mine the texts. In this paper, the application of a semantic understandingbased approach to mine documents is presented. The approach is based on semantic notions to represent text, and to measure similarity between text documents. The representation scheme reflects existing relations between concepts and facilitates accurate similarity measurements that result in better mining performance. A document mining process, namely semantic document clustering, is investigated and tackled in various ways. The proposed representation scheme along with the proposed similarity measure were implemented as vital components of a mining system. The approach has enabled more effective document clustering than what conventional techniques would provide. The experimental work is reported, and its results are presented and analyzed. Index Terms— Document mining, semantic understanding, text representation, similarity measure, document clustering
I. INTRODUCTION The availability of free text (also called message, narrative, post, script, story and wire) has grown exponentially, thus the need to manage it grows. The result of this exponential growth is what has become known as the information overload problem. Taking into consideration only the volume of information available via the Internet and the World Wide Web (WWW) presents a non-trivial problem. The extent of this problem is apparent to anyone who has tapped into the WWW, and attempted to locate specific desired information. Moreover, the acceleration of information change and availability can lead to psychological, physical and social problems, especially to the knowledge workers whose jobs mainly involve dealing with and processing information. In a world-wide survey conducted by Reuters News Agency [30], it was found that two thirds of managers suffered from increased tension and one third from ill-health because of information overload. It was also concluded that other affects of too much information can cause anxiety, poor decision-making, difficulties in memorizing and remembering, and reduced attention span [25]. Solving the information overload (or overkill) problem involves processes such as information gathering, information filtering, information retrieval, information extraction, document classification, and document
© 2009 ACADEMY PUBLISHER
clustering. The goal of these processes is to help users have better access to documents that satisfy their information needs. The needs can be defined to discover or derive new information from documents, to find patterns across documents, and to separate the desired information from the noise. These computational processes constitute cornerstone tasks in the everdeveloping field of document mining (DM). DM can be broadly defined as the automated task of discovery and analysis of useful information from documents to solve the information overload problem mentioned above. Examples of these processes are document clustering, and document classification where the goal is to group documents that are similar in meaning or topology. Thus, DM is fundamentally based on analyzing a semantically rich document or a set of documents, understanding their contents and satisfying some user requirements. It is quite different from regular data mining in the sense that patterns are extracted mainly from natural language text, rather than from structured databases of facts. Databases are designed for systems to process automatically, but text is written by humans for people to read. Text is the input that is stored in a machine readable format (i.e., data consisting of a sequence of characters, as opposed to binary numbers, images, graphics commands, executable programs, and the like). It need not be annotated nor structured, yet it should follow some rules of a natural language, such as, Arabic, English, or French (i.e., data consisting of a written human language, as opposed to programs, or following the stylistic conventions of human language). It can be any short or long natural language text that adheres to the grammatical rules of the language and holds semantically valid thoughts. Examples of this type of text are news headlines, articles, research abstracts, and patents. The crucial feature of a free text is that its elements can be arranged in a fixed sequence, so that the phenomena of placement or displacement are relevant, i.e., altering a message component would result in the varying of its meaning. Free texts may have sections, named sections, paragraphs, and titles. This work is an application of a semantic-based document mining system (first introduced in [21]) that encompasses a wide range of components related to the storing, organizing, and mining of documents. The focus in this system is on the analysis of contents, as opposed to the bag-of-word approaches, and its subsequent results in response to the mining processes requirements. Of particular interest is the adoption of meaning-based representations of text, and their use in measuring
392
JOURNAL OF SOFTWARE, VOL. 4, NO. 5, JULY 2009
similarities (or distances) between documents. In this system, the meaning of documents resides in the structure, constituency, and the reasoning behind word/phrase semantics. Similarity measures are defined on these representations to yield meaningful distance assessments. Mining processes, such as document clustering, document classification, and information retrieval, that make use of some or all of the mentioned components are forming what we call the semantic-based document mining processes. This system framework is expected to meet document mining requirements and output more meaningful results than what could be accomplished otherwise. This paper presents a new approach for clustering documents by exploiting semantic information of their texts. A formal semantic representation of linguistic inputs is utilized to build a semantic representation scheme for documents. The representation scheme is constructed through accumulation of syntactic and semantic analysis outputs. A distance measure is developed to determine the similarities between contents of documents. The measure is based on the inexact matching of attributed trees. The proposed representation scheme along with the proposed similarity measure were implemented as vital components of a mining system. The approach has enabled more effective document clustering than what conventional techniques would provide. The paper is organized as follows: Section one introduces the work and summarizes its findings. Section two presents background material and reviews relevant literature. Section three provides detailed information about document clustering and a review of various clustering algorithms. Section four presents an overview of the framework of the semantic-based document mining system including its text representation model, similarity measure, and other supplementary components and their applicability to the clustering process. Section five includes implementation details and experimental results of the clustering system and the results are discussed and analysed. Finally, a summary of the work, and a discussion of the research contributions, findings, and recommendations for future expansions are given in Section six.
between documents and queries in their transformed form in an index. When relevancy and similarity measuring is performed with the intent of transmitting a document to a user, or a set of interested users, it is usually referred to as IF [2, 28]. It is also used to either accept or reject an incoming document, as in e-mail filters that attempt to screen for junk mail. The goal of IE is to locate specific information and produce structured format from unstructured or semistructured documents [32]. The output of an extraction system is usually tabular or fixed-format forms that are filled out with unambiguous data. This is done through analyzing those portions of each document that contain relevant information. Relevance here is determined by predefined domain guidelines which specify what types of information the system is expected to find. The aim of the document classification task is to assign a new document to one of a pre-existing set of document classes. In this setting, the task of creating a classifier consists of discovering useful characterization of the documents that belong to each class. Although this can be done by hand, the standard approach is to use supervised machine learning. In particular, classifiers can be trained on a set of documents that have been labelled with the correct class. The classification task assumes existing categories, or clusters, of documents. By contrast, the task of document clustering is to create, or discover, a reasonable set of clusters for a given set of documents. A reasonable cluster is defined as one that maximizes the within-cluster document similarity, and minimizes between cluster similarities [3]. At a certain level of simplicity, we can look at these processes as being relatively similar. They all make use of a text representation model, and a similarity measure to perform their specific tasks. Hence, knowledge-rich representations of text combined with accurate similarity measures will definitely result in enhanced mining processes outputs. Since document clustering is used in this paper as a case study to illustrate the working and the efficacy of the proposed document mining approach, a more detailed review about it is given in the following section.
II. MINING PROCESSES
III. DOCUMENT CLUSTERING
Document mining processes such as document clustering, document classification, information retrieval (IR), information filtering (IF), and information extraction (IE) may vary in their requirements and specifications, yet their goals are to discover and extract knowledge from documents. They facilitate tasks such as classifying documents, discovering relationships or associations between documents, finding relevant documents to queries, routing documents to interested users, and incorporating text with other structured data. IR is concerned with finding relevant documents in response to a user request and ranking them accordingly [1, 24]. This is normally done by measuring the distances
Document clustering aims to automatically divide documents into groups based on similarities of their content. Each group (or cluster) consists of documents that are similar within the group (have high intra-cluster similarity) and dissimilar to documents of other groups (have low inter-cluster similarity) (Figure 1). Clustering documents can be considered an unsupervised task that attempts to classify documents by discovering underlying patterns, i.e., the learning process is unsupervised, which means that there is no need to define the correct output (i.e., the actual cluster into which the input should be mapped to) for an input.
© 2009 ACADEMY PUBLISHER
JOURNAL OF SOFTWARE, VOL. 4, NO. 5, JULY 2009
Documents Cluster
Low Inter-cluster similarity
Documents Cluster
Clustering
Documents
Documents Cluster
High Intra-cluster similarity
Figure 1. Document clustering
Clustering is used to disambiguate results of information retrieval systems, by displaying them into specific topics. Aside from visualization of search results, clustering is used for taxonomy design and similarity search. Topic taxonomy (e.g., Yahoo!, and Open Directory dmoz.org) are constructed manually, but this process can be assisted by clustering large samples of documents. Clustering can also help speed up similarity search, where similar documents are to be retrieved. Additionally, in [29] it is argued that sentence-based text clustering can be a key factor for performance improvement of automatic speech recognition systems. There are many clustering techniques in the literature, each adopting a certain strategy for detecting the grouping in the data, such as K-means algorithm [15], Expectation Maximization [13] and hierarchical clustering [19], and many others surveyed in [3]. They can be divided into three main categories; partitioning, geometric, and probabilistic [7]. The following subsections report some algorithmic approaches under their perspective categories. a) Partitioning: In this approach to cluster, objects are partitioned into k clusters C1,..., Ck such that the intercluster similarity is minimum and the intra-cluster similarity is maximum. Distances and similarities are usually measured with regard to the cluster centroid. Jain and Dubes [19] gave a thorough review regarding clustering techniques including partitioning clustering. k-means and Fuzzy C-means [15]. K-means tries to find k groups in the data. It iterates through two steps. The first step is to find the mean of a cluster by averaging all the instances that belong to that cluster. The second step is to update cluster membership according to a distance measure between each instance and all cluster centers, and choosing the closest one. These two steps are repeated until no more instances are moved between clusters. The time complexity of the algorithms is O(kndT), where k is the number of clusters, n is the number of documents, d is the dimension of the feature space, and T is the number of iterations. A variant of k-means that allows overlapping clusters is known as Fuzzy C-means (FCM). Instead of having binary membership of objects to their respective clusters, FCM allows for fuzzy (or degrees) of memberships [20]. Krishnapuram et al [23] proposed a modified version of FCM called “Fuzzy C-Medoids” (FCMdd) where the means are replaced with medoids. They claim that their algorithm converges very quickly and has a worst case of O(n2) and is an order of magnitude faster than FCM. Hierarchical and Agglomerative [19]. Hierarchical Agglomerative Clustering (HAC) is performed by
© 2009 ACADEMY PUBLISHER
393
assigning each document as cluster, and then in a greedy manner, combines clusters according to the most similar clusters at each iteration. In this case, it is considered as a bottom-up approach and its time complexity is O(n2). A top-down variant of the approach sets the number of clusters first, and creates a random partition of clusters, then refines the clusters so as to satisfy one of the cost functions mentioned above. Notice that HAC accepts a similarity matrix as its input. A similarity matrix is basically a large table representing the distance between each pair of documents in the collection. k-Nearest Neighbour Clustering (k-NN) [8, 11]. This algorithm is used in classification and in clustering. It utilizes the property of nearest neighbours k, i.e., an object should be put in the same cluster as its nearest k neighbours. The algorithm accepts a user specified threshold, e, on the nearest-neighbour distance. For each new document, the similarity is compared to every other document, and the top k documents are chosen. Accordingly, the new document is grouped with the cluster where the majority of the top k documents are assigned. Single Pass Clustering [8, 17]. Single pass clustering method also expects a similarity matrix as its input and produces clusters. The clustering method takes each object sequentially and assigns it to the closest previously created cluster, or creates a new cluster with that object as its first member. A new cluster is created when the similarity to the closest cluster is less than a specified threshold. This threshold is the only externally imposed parameter. Commonly, the similarity between an object and a cluster is determined by computing the average similarity of the object to all objects in that cluster. b) Geometric: Geometric approaches to clustering project the problem space into a two or three dimensional space, so as to aid the user in spotting the clusters. By doing so, they allow an easy way to visualize clusters, which is often considered an advantage. Self-Organized Maps. Kohonen Self-Organizing Map (SOM) can be visualized as a sheet-like neural-network array. The cells (or nodes) of SOM become specifically tuned to various input signal patterns or classes of patterns in an orderly fashion. In the basic version, only one node (the winner) at a time is activated corresponding to each input. The locations of the responses in the array tend to become ordered in the learning process. This is as if some meaningful non-linear coordinate system for the different input features was being created over the network [18, 22]. All vectors are fed to the network, as one epoch, and for a number of iterations, the network is trained to map them to a specific number of clusters. Multi-dimensional Scaling (MDS). In MDS the system input is the pair-wise (dis)similarity between documents, rather than the internal vector-space representation of the documents. The algorithm seeks to project the documents onto a low-dimensional space (often 2D or 3D) with minimum distortion of the original pair-wise distances. This is usually done by keeping the Euclidean distance between any pair of points in the lowdimensional space as close as possible to the distance
394
JOURNAL OF SOFTWARE, VOL. 4, NO. 5, JULY 2009
between them specified by the input. Formally; if di,j is a (symmetric) user-defined measure of distance (or ^ similarity) between documents i and j, and d i, j is the Euclidean distance between the point representation of the two documents chosen by the MDS algorithm. The stress of the embedding to be minimized is given by: ^
Stress = ∑i, j (d i, j − d i, j ) 2 . Convergence of this function is
∑
i, j
d i2, j
often difficult to achieve, and is usually done using iterative relaxation (hill climbing). Initially, points are assigned random coordinates, and are moved iteratively by small distance in a direction that locally minimizes the stress. Latent Semantic Indexing (LSI). It is an algebraicbased algorithm used to represent documents [12, 16, 26]. LSI assumes that there is some underlying or latent structure in the pattern of word usage across documents, and that statistical techniques can be used to estimate this structure. It considers implicit higher-order structures in the association of terms with documents, i.e., “semantic structure”. The technique successfully takes into account synonymy (i.e., words that can express the same meaning) and polysemy (i.e., a word that can be used to express different meanings). After factoring the term-document matrix, and decomposing it to compute singular value decomposition (SVD), it ranks it so the top r singular values capture the “signal” in the original matrix, leaving out the lower singular values to account for the “noise”. c) Probabilistic: Most of the aforementioned clustering approaches are considered sensitive to the similarity measures. The probabilistic approach assumes that documents follow specific distributions that should be modeled by finding the distributions parameters. Practically, estimating these parameters is the clustering process itself. Maximization Expectation algorithm, Probabilistic LSI, and Multiple Cause Mixture Model (MCMM) are examples of this approach. Some of these techniques are discussed in [27]. A drawback of such approaches is that they are computationally expensive, thus may be appropriate for off-line clustering. While a large number of document clustering approaches have become available, relatively little attention has been paid to the clustering of documents represented using symbolic structures. In principle, however, given suitable documents similarity (or dissimilarity) measurements, many of the clustering algorithms originally developed in the context of statistical pattern recognition, can be applied in the symbolic domain. This is the course that has been adapted in this work to cluster documents represented semantically. Text documents are syntactically and semantically parsed and represented by their semantic models. Pair-wise similarities are computed using the developed inexact tree matching similarity measure. The similarity matrix is fed to different clustering algorithms to produce clusters for the data sets. Two different data sets are used; each with distinct features. The clustering results are then evaluated using standard evaluation techniques in document mining. Below are details of the © 2009 ACADEMY PUBLISHER
steps taken, followed by an analytical discourse on the findings. IV. SEMANTIC-BASED DOCUMENT MINING This section presents a framework for mining documents based on semantic understanding of text. As Figure 2 illustrates, a semantic understanding-based document mining system is often provided with a set of documents for which it is expected to produce a higher level form of informative depictions that satisfy some user needs. These user needs are acquired through some mining processes such as document clustering, document classification, and information retrieval. The approach is based on analyzing text in documents before proceeding with the different mining processes’ requirements. The text analysis (or parsing) step comprises syntactic analysis to extract syntax structural descriptions (e.g. part of speech tags, phrasal chunks, and parse trees), and semantic analysis that produces formal knowledge representations of the documents contents. A parser is a specialized software that analyzes textual natural language input (a sentence or more) and converts it to a formal representation that can contain syntactic and/or semantic information not explicitly present in the sentence(s). Parsers can be categorized into three types; morphological, syntactic, and semantic parsers. A morphological parser takes word forms as input, analyses them, and returns their morpheme structures indicating the different morphemes that constitute the input and how they are related to each other. Morphemes are small meaning-holding units of words. These morphemes can be broadly classified into stems (words roots) and affixes, which may be prefixes, suffixes, infixes or circumfixes. Prefixes are those morphemes, which may appear before a stem, and postfixes are those that are applied to the end of the stem, circumfixes are those morphemes that can be applied on both sides of the stem. The morphemes categorized under infixes are those that appear inside a stem. When the parsing program is used to determine a syntactic structure of a sentence according to some language formal grammar, it is called a syntactic (or syntax) parser. The syntactic parser is often provided as input with a language grammar, a lexicon, and a wordstring, and will output, if the string is a well-formed sentence, a structural description of it. The structural description is often represented as a parse-tree, also called a phrase-marker, a diagrammatic representation of the sentence's constituent grammatical structure. If the sentence is ill-structured, the parser will reject the string. Semantic parsers attempt to model the meanings by defining relations between text constituents of phrases, words, and morphemes. Typically, a semantic parser transforms some input text into a data structure that can be processed easily, e.g., for semantic checking, comparison of meanings, knowledge inference, or to ease the further understanding processing of the input. Such a data structure usually captures the semantic relations between concepts of the input and forms a tree or even a full graph.
JOURNAL OF SOFTWARE, VOL. 4, NO. 5, JULY 2009
Parse Tree
395
Knowledge Representation Scheme Document Clustering
Documents
Semantic Analysis
Syntactic Analysis
Semantic-based Document Mining
Document Classification
Information Retrieval
Text Analysis
Figure 2. The semantic-based approach
A. Architecture overview The architecture of a generic semantic-based document mining system is illustrated in Figure 3. It consists of three major components, i.e., text parser, similarity estimator, and mining processes. A semantic-based document mining system can be built from these three resources to satisfy the requirements. These components are interconnected in most cases, i.e., outputs of one component can be the inputs of others and vice versa, which makes the system highly integrated, but yet modular. Document Set
User Interface
Document Mining Process
Dictionary
Parser Similarity Estimator
KB Parsed Documents
Figure 3. System architecture
The text parser is responsible for reading input texts and converting them to canonical and symbolic knowledge representations. The first step in a complete parsing procedure would be an automatic syntactic analysis. This will gather important structural objects by recognizing text components (such as, phrases, sentences, and paragraphs), tagging text with parts-of-speech annotations, and producing parse trees. The second step is semantic analysis, where high level knowledge is extracted and abstracted in a formal knowledge representation. Depending on the kind of parser, this representation could be sketchy scripts, or graph-based data structures that match the meaning of the input text. The success of this stage is dependent on advances made in syntactic and semantic modeling of natural languages, and on the availability of an efficient, broad, and domainindependent of these parsers. The similarity estimator takes two understood (parsed) texts and determines the semantic distance between them. We assert that when the parser properly converts text to semantic representations and the similarity estimator identifies their closeness with respect to meaning, the parsing and the distance measuring operations are forming a homomorphism with human judgments about documents’ similarities. That is to say, human judgments about the similarity of two texts are emulated by the process of parsing both texts into knowledge © 2009 ACADEMY PUBLISHER
representations and then measuring the distance between these representations. The similarity estimator algorithm depends heavily on the chosen knowledge representation structure. For instance, when the text is represented as graph structures, the similarity algorithm has to search through these graphs and estimate their levels of commonalities. Document mining processes (such as, document clustering, document classification, information retrieval, information filtering, and information extraction) vary in their requirements and specifications. Nevertheless, they all require representing documents in some formal way, and they all measure similarities in one way or another. Thus, they can all make use of the semantic parser, the similarity estimator, and/or other supplementary components. In information retrieval, for example, documents are first indexed (i.e., formally represented) and a relevancy ranking would be produced based on the similarity estimation process. A detailed discussion on one of these different mining processes, namely the semantic document clustering, is presented as a case study in this paper. B. Semantic Graph Model In this work, a representation scheme called the Semantic Graph Model (SGM) is utilized. It is developed to be suitable for document mining processes, where the focus is on the ability to express distinct readings of sentences as distinct formulas that capture their intuitive structures and meanings. The creation of the representation starts by creating predicate structures of sentences, augmenting the structures elements with valuable attributes, and taking all parsed sentences as the document representation. The representation is a graphbased data structure (trees) where entities, such as agents, objects, states, actions, events, locations are represented as vertices, and relations between them are represented as arcs. Each node holds information about the entity it represents that could include its original text, syntactic information, semantic meaning, and relations with other nodes. In addition, each of these entries can have a fuzzy value that reflects the parser confidence level regarding it, and incorporates the fuzziness found in the human expressions and/or perceptions. Note that the mappings from text to meaning can be many-to-one, i.e., different sentences can express an idea differently but lead to the same interpretation. For example, the following three sentences mean the same: 'X succeeds Y as chairperson of Z.', 'Z named X as its new chair-person after Y.', and 'Y was succeeded by X as chair-person of Z.' This variability can be captured by choosing to use a canonical knowledge representation. That means all natural language constructions that have the same basic meaning must be parsed into the same representation. This property simplifies the similarity measuring process and improves the accuracy of similarity estimation for a given level of simplicity. That is because insignificant details and variations in sentences are trimmed early in the parsing process and as a result only condensed meaning representations of texts are used to estimate similarity. Figure 4 shows graphically how
396
JOURNAL OF SOFTWARE, VOL. 4, NO. 5, JULY 2009
different sentences with the same basic meaning are given the same representation. This is an example to illustrate what a parser can receive and be required to process. Note that for the parser to determine the sentence 'John arrived at Pearson International' matches the sentence 'Air travel to Toronto by John', the parser must be able to determine that Pearson International is in Toronto. Thus, it must have access to world knowledge. This approach may face some difficulties, such as having an efficient and accurate natural language parser. This parser should produce detailed representations of the various nested relations that may be expressed in an input text. It has to be robust enough to discover partial knowledge from ill-formed or ambiguous and domain independent texts; i.e., capable of processing documents on a variety of topics. Unfortunately, such a parser is currently unavailable. However, a number of systems from natural language processing and understanding research fields are emerging and showing reasonable maturity. These systems offer a variety of designs and implementations representing various options. This research work makes use of such systems that have demonstrated acceptable performance, and extends upon them. John flew to Toronto John's trip to Toronto by plane
John arrived at Pearson International Airport via Air Canada Instrument: Airplane
Agent: John Action: Transport
John took a plane to the GTA
Destination: Toronto
Air travel to Toronto by John
Figure 4 An Example of a Canonical Representation
C. Parsing Sample Texts Two examples of sentences are used to illustrate the process of converting text to SGM. Assuming these sentences were analyzed by the deep syntactic and semantic text parser described above: a) 'John eats the apple standing beside the tree,' and 'The apple tree stands beside John’s house.' b) 'John is an intelligent boy,' and 'John is a brilliant son' The purpose of choosing these two examples is to show the advantages of the proposed approach over using traditional methodologies (such as, the-bag-of-words approach). This is manifested in extracting and representing the correct meaning from semantically different sentences even when there is an overlap in words usage, and similar sentences in meaning constructed using different words. The parse trees in Figure 5 (a) and (b) are the product of the syntactic analysis stage. In fact, it is clear from the parse trees that one can see the dis/similarity of these sentences.
© 2009 ACADEMY PUBLISHER
sent 1
sent 2
clause 1
clause 2
clause 1 adv
np
vg
np
adv
vg prep
np
n
v det
John
eats the apple standing beside the tree
n
v
n
det
det
np
prep
n
n
apos
the apple tree stands beside John house ‘s
Figure 5 (a) Parse Trees of Sample Text
sent 1
sent 2
clause 1
John
np
vg
np n
clause 1
v is
np adj
det
n
an intelligent boy
n John
np
vg v
det
is
adj
a
brilliant
n son
Figure 5 (b) Parse Trees of Sample Text
A sketch of an SGM knowledge representation scheme is depicted in Figure 6 (a) and (b) to show how the sentences could be represented in the higher level of semantic rather than just syntax. Every node in the graph represents a concept and holds some detailed attributable information about it. The concept could correspond to a word or phrases found in the text. According to the word or phrase syntactic tags, semantic role labeling (Agent, Action, Status, etc.) could be assigned. Examples of the information that could be in a node are illustrated for the first sentence in Figure 6 (c). It includes the following fields: • Name: unique identification for the node • Type: classification of the entity (e.g., Agent, Object, Action, and State) • Text: the original text • Syn.: the part of speech tag • Sen.: dictionary senses (synonyms) of the entity • Sem.: disambiguated meaning of the entity • Rel.: relations (i.e., arcs) to other nodes in the graph
Some fields can have additional fuzzy values (ranges from 0 to 1) to represent the parser level of confidence. This is an important property as in the case of the Sem. field where the disambiguated sense is fuzzy, and Rel. that could also require a fuzzy function to represent its strength. eats John Agent1
Action1 Standing Action2
the apple Object 1 beside the tree
The apple Object 1
stands beside John's Status
Object 2
Figure 6 (a) SGM Knowledge Representations of Sample Texts
JOURNAL OF SOFTWARE, VOL. 4, NO. 5, JULY 2009
is
John Agent1
Agent1
an intelligent boy Description 1
Action1 is
John
397
a brilliant son Description 1
Action1
Figure 6 (b) SGM Knowledge Representations of Sample Texts Node 1 Name: Agent1 Type: Agent Text: John Syn.: Noun, Subject Sen.: Agent name Sem.: Agent name (1) Rel.: Action1 (.9), Action2 (.85)
Node 2 Name: Action1 Type: Action Text: eats Syn.: verb Sen.: chow, chuck, eats, grub Sem.: eat (.9) Rel.: Object1 (.9)
Node 5 Name: Object2 Type: Object Text: beside the tree Syn.: adverb Sen.: Sem.: beside the tree (.8) Rel.: NIL
Node 3 Name: Object1 Type: Object Text: the apple Syn.: object Sen.: apple, orchard apple tree, Malus pumila Sem.: apple tree (.8) Rel.: NIL
Node 4 Name: Action2 Type: Action Text: standing Syn.: verb Sen.: status, position, motion, movement, move, motility Sem.: position (.7) Rel.: Object2 (.8)
Figure 6 (c) SGM Knowledge Representations of Sample Texts
Building an SGM representation is based on exploiting syntactic and semantic information that could be extracted from text. The representation characterizes sentences by converting them to formulas that reflect their structures and semantics. It identifies relationships between key concepts and accumulates valuable semantic clues about these concepts. Hence, SGMs can precisely represent text contents. SGM for a document is the accumulation of all sentences represented by the meaning representation. Each sentence is represented by an attributed graph of concepts as nodes and relations between them. The union of all graphs represent a whole document. The sum of all sentences represented in the SGM portrays the knowledge in a document. All graphs (essentially trees) of the produced sentence representations are connected to one node that makes an inclusive rooted tree for the whole document. Figure 7 shows a skeleton of an SGM for a document. The SGM provides both the structural and conceptual elements that could be discerned through the syntactic and semantic processing of text. Moreover, the representation scheme is extendable, and could include outcomes of different analysis and reasoning processes. The structural property of the model allows manipulation efficiently. This is especially important, as the goal of converting text to the SGM is to be used in further mining processes. In the following subsection, a brief introduction is given to the problem of comparing SGM representations and the proposal of a new similarity measure technique. The proposed measure is defined on the SGMs that are in essence tree structures with multiple symbolic attributes, and is based on finding all common similarity sub-trees.
© 2009 ACADEMY PUBLISHER
Figure 7 SGM Skeleton for a Document
D. Semantic-based Similarity Measure As SGM was adopted as the text representation of choice, an effective distance measuring technique for the model is to be developed. The SGM is an abstract representation constructed from symbolic elements rather than multi-dimensional numeric vectors. Thus, the similarity estimator component is responsible for searching the abstract representations of two documents, finding elements that are sufficiently similar, and yielding an overall similarity index. The similarity index should reflect the degree of commonality found between these structures; the more overlapping found between two representations the more similar the documents are, and vice versa. An inexact graph matching technique to approximately match graphs is utilized to calculate semantic distances between documents. Since SGMs are in essence trees with multiple symbolic node attributes, the semantic distance measure is defined over attributed-trees. The matching technique involves the computation of all similarity common sub-trees that do not overlap. These are distinct sub-trees found in the trees that exhibit similarities matching in their node attributes and structures. The measure is based on finding all distinct common similarity sub-trees. The two miniature trees in Figure 8 are used to illustrate the working of the measure. First, to assess similarity between nodes as a comparison of attributes, the function Node-Sim(n1, n2) is used. It allows for the evaluating of the degree of similarity between the graph nodes n1, and n2 by answering the question: 'What is the degree of matching between the set of attributes, A, defining node n1, and the attributes, B, defining node n2?', thus, the similarity function is valued in the continuous interval [0..1]. The value 1 means a complete match of attribute values in the two nodes. As nodes are composed of different sets of pairs of attributes and values, each attribute, i, is associated with a numerical weight, w (a positive number), expressing its degree of importance. The node similarity function is formulated as follows: A∩ B
Node-Sim(n1, n2) =
∑
wi
Att − similarityi (n1 , n2 ) , (1)
i
A∪ B
∑w
i
i
398
JOURNAL OF SOFTWARE, VOL. 4, NO. 5, JULY 2009
where Att-similairtyi(n1, n2) is the degree of matching for the attribute i in both nodes n1, and n2. There are two general types of attribute values to be distinguished: values that are singular (such as syntactic tags, or semantic roles attributes of an SGM), and the values that define multiple data elements (such as synonyms, and antonyms). Accordingly, in the singular value case the matching is binary, and it is partial in the multiple values case. In the example trees, the attribute values are denoted with alphabet symbols {a, b, c, …}; each node has a maximum of four single valued attributes. Thus, evaluating the similarity between node (1) in Tree 1, and node (3) in Tree 2, using the above equation and assuming equal weights, wi, to all attributes, will yield a value of 75% match. It is clear that this similarity function is symmetrical, i.e., Node-Sim(n1, n2) = Node-Sim(n2, n1). Furthermore, the function can be shown that it is a normalized metric as it fulfills the other metric properties, i.e., minimality, identity and triangular inequality. Fulfilling these properties is important, as they can be used to show how metric the proposed similarity measure is.
Figure 8 Miniature Illustration Trees
As the tree structures are used to represent text, the approach to measure similarities between documents has turned into the problem of computing similarity between trees (specifically, inexact tree matching). The solution presented is based on measuring the commonality between trees through finding all distinct common similarity sub-trees. Clearly, the more similar the trees are, the more in number and larger in sizes their common sub-trees will be. Formally, the objective of finding a common similarity sub-tree between two attributed trees is to find an isomorphism which matches nodes having similar attributes. Let T1 = (N1, E1) and T2 = (N2, E2) be two trees. A bijection f : V1 → V2, with V1 ⊆N1, and V2 ⊆N2, such that (x, y) ∈ E2 iff (f(x), f(y)) ∈ E1 (i.e., it preserves the nodes adjacency and the tree connectedness) is called a sub-tree isomorphism. When Node-Sim(n1, n2) is used as the similarity measure threshold in determining the matching between nodes, the matched trees are called common similarity sub-trees isomorphism. For example, if the similarity threshold is set to 50% match, the four pairs of sub-trees matching between Tree 1 and Tree 2 (as marked in Figure 9) could be found:
Figure 9 Common Similarity Sub-trees
A similarity index produced by the isomorphism f can be calculated as follows: (2) S1,2(f) = ∑ Node − Sim( x, f ( x)) x∈V1
There can be many disjoint sub-trees isomorphism, i = 1, 2, .., l, between T1 and T2 that satisfy the above conditions. There are four pairs of these sub-trees in Figure 9 denoted by A, B, C, and D patterns along with their similarity index values (See Figure 9 Legend). When S(f)i is the largest similarity index among all existing similarity sub-trees isomorphism, the similarity S of the isomorphism f is called the maximum similarity sub-tree isomorphism, and it is B with 3 similarity index in the example. It is called the minimum similarity supertree isomorphism if S(f)i is the smallest; in our case it is C that has 0.75 similarity value. The approach, however, is to consider all distinct similarity sub-trees isomorphism, i.e., all common similarity sub-trees that have no overlapping between them. All the sub-trees are taken into account, rather than just the maximum or minimum, as the GSM of documents could be quite large and matching sub-trees could be sparse. Thus, considering all sub-trees will make the measure reflecting more commonality that cannot be accomplished otherwise. Furthermore, the sub-trees overlapping (i.e., considering matching nodes more than once) should be eliminated to reduce overestimating similarities. It can be decided on a greedy manner when there is a node that belongs to more than one similarity sub-tree. Nodes should be included in the sub-trees matching, that pass the threshold, and have the highest matching score. For example, the case of node (9) in Tree 1 and (8) in Tree 2 that has 75% attribute similarity illustrates how the conflict is dealt with. The nodes pass the similarity threshold to be included in B common similarity sub-tree isomorphism, but node (8) has higher attribute similarity (100%) with node (2) in Tree 1. This is solved by picking node (8) to be included in A common similarity sub-tree isomorphism instead of B. In order to be practicable, the algorithm that calculates the similarity measure should be developed in a way that would keep the overlapping eliminated and would have a low time and space complexity. After finding all distinct common similarity sub-trees, the overall normalized distance measure between T1 and T2 can be computed as follows: d(T1, T2) = 1 − W ( S1, 2 ) (3) min(| T1 |, | T2 |)
where W(S1,2) =
l
∑S i =1
© 2009 ACADEMY PUBLISHER
1, 2
( f ) i ; the overall similarity of sub-
JOURNAL OF SOFTWARE, VOL. 4, NO. 5, JULY 2009
trees paired by f, as defined in (2). Note that when eliminating overlapping sub-trees, we have W(S1,2) ≤ min(|T1|,|T2|) (4), thus d is normalized. In the illustrative example W(S1,2) = 8.25, thus the distance between the two trees, d(Tree 1, Tree 2) = 0.25, i.e., a similarity of 75%. Furthermore, with this assumption, we have T1 = T2 ⇔ |T1|=|T2|=W(S1,2) (5) A. Similarity Estimation: An Example Figures 10 (a) and (b) demonstrate the proposed distance estimator on the examples of Section 4.2.1. The figures depict the finding of the common similarity subtrees in the SGMs of the two sentences. The symbol (x) denotes the nodes that are not matched, while (⇔) represents the similarity matching of nodes that are included in the common similarity sub-trees. Note that in order to match only distinct sub-trees, the overlapping which results from considering one node in Figure 10 (a) (status: 'stands beside John's house') should be eliminated. Thus, only one matching node (Action 2 or Object 2) would be considered as a match. The consideration for matching could be according to which nodes have higher similarity values as in this case. Also, passing a threshold should be a condition to consider two nodes to be similar. For example, Agent1 and Status were not considered for the matching, even though they are similar to some degree.
Figure 10 (a) Similarity Estimation for Sample Texts
Figure 10 (b) Similarity Estimation for Sample Texts
Clearly, the summing up of similarities for the first pair of sentences is lower than the second pair, which reflects the closeness of their meaning distances. An index indicating the similarity between a pair of sentences (or documents) can be determined by normalizing the similarity of all found similarity subtrees. Applying this on the sample sentences in figure 6 (a) and (b), assuming that the similarity values between
© 2009 ACADEMY PUBLISHER
399
the sub-trees are estimated through the matching of nodes’ attributes will produce a low similarity for the first sentence pair and a high similarity for the second pair. V. EXPERIMENTAL WORK In this section, the application of our semantic understanding-based framework in mining documents is presented. A document mining process, namely semantic document clustering, is investigated and tackled in various ways. Implementations and experimental work have been carried out. Results are also presented and analyzed. Section 5.1 explains the experimental setup in terms of the used data sets and their characteristics, the developed text analysis system and its advantages, the document representations that were implemented, the employed similarity measures, the implemented clustering algorithms, and the utilized evaluation techniques. A listing of the experiment’s collected results is reported in Section 5.2. The results are discussed and analyzed in Section 5.3. A. Experimental Setup The semantic-based mining approach is implemented and evaluated based on its ability to perform high quality document clustering. Text documents are parsed to produce the rich syntactic and semantic representations. Based on these semantic representations, pair-wise document similarities are estimated using an inexact node-attributed tree matching algorithm that is based on finding all distinct similarity common sub-trees. Clustering algorithms that accept these similarities are utilized to produce clusters of the data sets. The following are details of the experimental work including the text parser implemented, the data sets used, the text representations, the similarity measures, the clustering algorithms, and the collected results. B. Text Parser A parsing system, which performs the syntactic analysis, and builds the semantic structures is implemented. We are utilizing the open source GATE (General Architecture for Text Engineering) project from University of Sheffield in the UK (http://gate.ac.uk) [9], and a commercial integrated development environment (IDE), Visual Text [34, 35], from Text Analysis International, Inc. GATE provides an extensible framework for information extraction and text analysis, and Visual Text integrates NLP++ programming language for rapid parsers building. We have based the design of our text analysis system on a multi-pass, and a multi-strategy architecture that could be implemented within Visual Text IDE. The syntactic and semantic parser developments are built upon the TAIParse general analyser [35] that is provided as an open source from Text Analysis. The analyser contains 123 passes that build syntactic, and semantic structures. Many other processing components and langrage resources are wrapped and made usable interchangeably within the system. Specifically, every document in the processed data set goes through tokenization, part of speech
400
tagging, syntactic parsing, semantics and discourse analysis. C. Data Sets For experimentation and testing we are using two document sets, a Web documents collection (Data-Set-1), and a learning-objects (LO) data set (Data-Set-2). The Web document set is a collection of 2340 Reuters news articles posed on Yahoo! News. This corpus is especially interesting for evaluation, as it comes along with a hand-crafted classification. All documents have been classified manually by Yahoo experts to one or more of six main categories of Reuter's news feed, namely, business, entertainment, health, politics, sports, and technology. The data set has been collected and used by Boley et al [4, 5, 6] for clustering. The other data set used for testing is composed of LOs metadata records. This is a data set of metadata entries collected from Canada's SchoolNet website (www.schoolnet.ca). The data described by the metadata is mainly educational material. The metadata was authored by SchoolNet to make it easy for teachers and learners to find and access educational resources in various subjects. The data set was manually categorized by the authors into 306 hierarchal classes. The purpose of this data set was to facilitate research on learning object metadata by applying current data mining techniques (such as classification and clustering) developed in the pattern analysis and machine intelligence (PAMI) research group at the University of Waterloo (www.pami.uwaterloo.ca). The techniques developed in relation to this data are to be implemented and integrated into the product of the LORNET (www.lornet.org) project; the TELOS telelearning system. SchoolNet uses an extended set of the Dublin Core metadata element set. Each record in the original data set has 37 different fields. Note that in this work, we are only utilizing text fields in the metadata. Specifically, titles and descriptions fields are used to analyze and explore how the data can be organized or accessed efficiently through clustering. The actual data is available in XML format, thus, all the interesting fields can be extracted and saved in separate files. The difference between the two data sets are in the length of documents and the number of classes they are classified to. Reuters news feed articles are typically a page long, while SchoolNet description fields are usually a few concise sentences that describe the learning objectives. The Reuters' documents are classified into 6 main classes, while SchoolNet's are categorized into 306 hierarchal classes. C. Text Representations All text documents are represented using a semantic graph model (SGM) which we propose. The SGM representation model constitutes trees that have attributes for their nodes. Each document is represented as a tree rooted in a node describing its file name, and branches to sub-trees representing paragraphs, sentences, clauses, and predicate-argument nodes with attributes describing the arguments (Figure 7). As applicable, the node attributes © 2009 ACADEMY PUBLISHER
JOURNAL OF SOFTWARE, VOL. 4, NO. 5, JULY 2009
include Name: a unique identification for the node; Type: the semantic role of concept; Text: the original text; Syntax: the part of speech tag; Synonyms: dictionary senses of the concept; Semantic: the disambiguated meaning of the concept; and Relation: other nodes’ IDs that are connected to the node. Different algorithms are employed and integrated in the parser to produce the SGM representations. For comparison purposes, the documents in both document sets are also represented by the vector space model (VSM) as is commonly practiced in text mining techniques. To convert the data set to the vector space, some pre-processing procedures are performed such as normalizing words, analyzing words globally, and words weighting. To normalize words, numeric and stop words are removed. All words are converted to lowercase, and words with a length of 2 or less letters are also removed. Note that no stemming is done. Analyzing words globally is done by building a list of unique words from all documents, and calculating the document frequency of each word. Then, for each document, the word frequency is calculated and weighted using the following formula: N wi , j = f i , j log( ) , where fi,j is the term frequency of df j word j in document i, N is the number of documents, dfj is the document frequency of word j. Finally, an output of the term-by-document matrix is produced. D. Similarity Measures A distance measure technique is used to measure distances between documents. It follows the similarity calculation approach that is based on finding all distinctly common similarity sub-trees. The algorithm is applied to the semantic trees of the SGMs produced by the semantic parser. Various attributes are considered in the testing. Attribute consideration starts from taking into account only the original text to represent a node and extends considering other attributes the parser accumulates. Specifically, we carried out the experiments with mainly five options of sets of attributes to include in measuring the similarities. These options are (1) original text only; (2) original text and syntax tag; (3) original text, syntax tag, and semantic role; (4) original text, syntax tag, semantic role, and semantic disambiguated sense; and (5) original text, syntax tag, semantic role, semantic disambiguated sense, and semantic variation. The weights are tuned heuristically so the best results of clustering are obtained. To measure similarities of documents represented in the vector space, the commonly used cosine correlation measure is utilized [10, 33]. The cosine measure is defined as: cos(x,y) = x. y , where (.) denotes the vector | x || y |
dot product, and |x| and |y| are the lengths of vector x, y, respectively. The cosine measure gives high similarity values to documents that share the same set of words with high term frequencies, and lower values to those that do not.
JOURNAL OF SOFTWARE, VOL. 4, NO. 5, JULY 2009
E. Clustering Algorithms The semantic approach to represent text and determine similarity between them is evaluated by allowing clustering algorithms to use the produced similarity matrix of the document set. We run the test with standard clustering algorithms that accept the pair-wise (dis)similarity between documents, rather than the internal vector-space or SGM representations of the documents. The employed algorithms included are: Single-Pass Clustering, k-nearest neighbour (k-NN) Clustering, and Hierarchical Agglomerative Clustering (HAC). F. Evaluations To evaluate results, we used a benchmark of manually classified document sets; Reuters news feeds, and SchoolNet metadata records. The main aspect of the evaluation is the quality of the clustering task output, which is measured in terms of clusters quality. The widely used evaluation indices, F-measure that combine precision and recall, Entropy, and Overall-Similarity are used for this purpose as clustering quality evaluation measures. In general, to assess the quality of results produced by a document mining process, two classical indices are used; precision and recall. Precision P is the fraction of all correct answers included in a produced set of answers. Recall R is the fraction of the responses that are actually correct from all possible correct answers. # Correct _ Answers P= # Correct _ Answers , and R= . # Answers _ Pr oduced
# Total _ Possible _ Corrects
These evaluation indices are borrowed from IR literature where precision is used to indicate the fraction of all relevant documents included in a ranked list of retrieved documents, and recall is the fraction of the top responses that are actually relevant in the whole document set [36, 7]. P and R have been used to evaluate other mining processes results with slight alterations in their definition. For instance, in document clustering and document classification, the recall for cluster/class c is the ratio of processed documents manually classified as c with regard to the whole document set, and precision is the ratio of these documents clustered/classified as c by the process that were also manually classified as c regarding the produced set of results. Moreover, in IE recall is interpreted as the ratio of the information that has been correctly extracted, and precision as the proportion of the extracted information that is correct [14]. Combination methods have also been used, such as the F-measure, which combines precision, P, and recall, 2 R, in a single measurement as follows: F = ( β + 1) PR . β 2P + R The parameter β influences how much to favour recall over precision. Researchers frequently report the F1 score of the system where β=1, weighing precision and recall equally. Thus, using F-measure, the relative performance of systems reporting different values for recall and precision, can easily be compared. Entropy is used as another external similarity measure that can indicate the quality of clusters with reference to © 2009 ACADEMY PUBLISHER
401
external knowledge. It is used for un-nested clusters or for the clusters at one level of a hierarchical clustering. It is a measure of clusters’ homogeneity. The entropy Ei of a cluster i is calculated using Shanon [31] standard formula: E = − p log( p ) , where Pij is the probability of i
∑
j
ij
ij
documents of cluster i belong to class j. An overall entropy E for all clusters can also be calculated as the sum of entropies for each cluster weighted by the size of , where Ni is the size each cluster as follows: E = ∑( N × E ) N of cluster i, and N is the total number of documents. A common internal quality measure for clustering is the overall similarity and is used in the absence of any external information such as class labels. Overall similarity measures cluster cohesiveness by using the weighted similarity of the internal cluster similarity: , where S is the OverallSimilarity(S) = 1 n
i
i
i
S
2
∑ sim( x, y)
x , y∈S
cluster under consideration, and sim(x, y) is the similarity between the two objects x and y. G. Collected Results The above mentioned clustering algorithms were utilized to cluster the two data sets using document-todocument similarities produced by the semantic-based approach, and the vector space model. The following tables summarize the implemented techniques and their results. The different tables report clustering results obtained from the clustering algorithms. Tables from 1.1 to 1.5 show the results of our technique when the similarity measure considers different sets of node attributes, e.g., original text only; original text, and syntax tag; original text, syntax tag, and semantic role; original text, syntax tag, semantic role, and semantic disambiguated sense; and original text, syntax tag, semantic role, semantic disambiguated sense, and semantic variation. Table 1.6 lists the results from the vector space model approach. The performance of the model was closely examined to verify that the semantic similarity matching algorithm is scalable enough for moderate to large data sets. The experiments were performed on an Intel Centrino, 1 GHz machine with 512MB main memory. The system was written in NLP++ and run through an interpreter on Windows XP operating system. For both data sets the algorithm performed in a near-linear time and took a few minutes to perform the similarity calculation. A longer time was taken when analysing the documents to represent them with SGM. This can lead us to conclude that, in the current state of NLP, one can use the system for off-line application or in processing small document sets online. Although the two datasets contain a similar number of documents, Data-Set-1 took more time than Data-Set-2. This can be attributed to the fact that DataSet-1 on average has almost twice as many text contents per document as Data-Set2, so the algorithm ends up matching larger SGM trees that can have a larger number of sub-trees matching than in Data-Set-2.
402
JOURNAL OF SOFTWARE, VOL. 4, NO. 5, JULY 2009
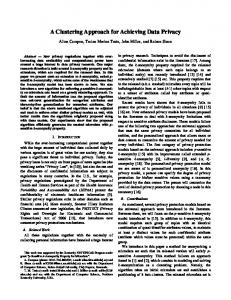
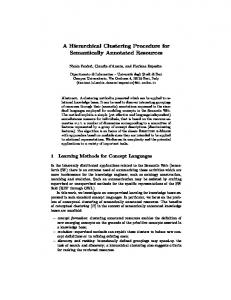
H. Analysis of Results The experiments revealed some interesting trends in terms of the clustering qualities of both data sets. Clearly, the results show the effectiveness of the semantic-based approach for clustering. In addition, the experiments illustrate improvements when more semantic clues are included in the process of measuring similarity between SGMs of documents. This affirms the assertion that the performance of the clustering algorithms is to proportionally improve as more semantic understanding of text content is considered. The results listed in Tables 1.1 to 1.5 show the improvement in the clustering quality when more attributes are included in the semantic-based similarity measure. The improvements were achieved at a factor of up to 72% for Data-Set-1 and 52% for Data-Set2 from the base case of considering only the original text of nodes (option 1) to considering all five semantic analysis results, i.e., original text, syntax tag, semantic role, semantic disambiguated sense, and semantic variation (option 5). The parameters for the different clustering algorithms were tuned and the ones that produced the best results were reported. The Fmeasure index has showed a noticeable increase. The enhancements of results were consistent among the two data sets. However, for the SchoolNetdataset (Data-Set2), the improvements were less obvious and lower than the Reuters data set (Data-Set-1), which could be attributed to the nature of its document’contents, where a large percentage of Data-Set-2 texts are short descriptions, and are contain specific topics that require special knowledge from the parser to perform more accurate semantic analysis. Moreover, the number of classes Data-Set-2 is categorized into is much larger than that of Data-Set-1 which makes it harder for the clustering algorithm to produce clusters which match these classes. The same can be noticed with the entropy and the overall similarity indexes. The entropy is minimized as a contribution of semantic-based similarity with options going from 1 to 5. The overall similarity also increased from option 1 to option 5. These are interesting observations since, as mentioned earlier, if we rely solely on counting words for measuring similarity we might not get an accurate similarity measurement. The role played by the semantic-based similarity measurement showed the space of communality between documents more explicitly. To better understand the effect of the inclusion of semantic information when calculating similarity on the clustering quality, we plot the clustering quality profile indices against the similarity options in Figures 11 and 12. The plotted values are the averages of f-measure, entropy, and overall similarity of the different clustering algorithms. The graphs illustrate the effect of semanticbased similarity with the different options to the Fmeasure, the entropy, and the overall similarity for both data sets. We also plot the value of these measures with regard to the VSM. It is easy to notice the enhancement of the clustering as we consider more semantic clues. The enhancement is, however, non-linear. Options 2 and 3 seem to not have as much effect on the clustering quality,
© 2009 ACADEMY PUBLISHER
JOURNAL OF SOFTWARE, VOL. 4, NO. 5, JULY 2009
but they never bring it down. Option 5 had the most effect to bring up the quality of clustering. As we anticipated, keywords alone cannot capture all the similarity information between documents, thus in both data sets the quality of semantic clustering with option 1 was as low as the conventional clustering technique, i.e., VSM. 0.9
F-Mearsure
0.8 0.7
Entropy
0.6 0.5
Overall Similarity
0.4
F-Measure (VSM)
0.3 0.2
Entropy (VSM)
0.1 0 Option 1 Option 2 Option 3 Option 4 Option 5
Overall Similarity (VSM)
Semantic Similarity Options
Figure 11. Clustering Results for Data-Set-1 0.9
F-Measure
0.8 0.7
Entropy
0.6 0.5
Overall Similarity
0.4
F-Measure (VSM)
0.3 0.2
Entropy (VSM)
0.1 0 1
2
3
4
5
Overall Similarity (VSM)
Semantic Similarity Options
Figure 12. Clustering Results for Data-Set-2
V. EXPERIMENTAL WORK We demonstrated a system composed of semantic components in an attempt to improve the accuracy of measuring the similarity between documents and using the similarity in solving the document clustering problem. By exploiting the semantic analysis findings we could achieve better clustering results. We implemented document analysis components that are capable of identifying the meaning and structures of text in documents. The second part, and perhaps the most important, is to measure similarity between parsed documents. The measure has the most impact on the performance as how much of semantic information it considers. Using the maximum amount of the semantic information enables us to perform similarity calculations between documents in a very robust and accurate way. The quality of clustering achieved using this model significantly surpasses the traditional vector space model based approach. The merit of this design is that each component can be utilized and refined independently. However, combining all of these components leads to better results, as justified by the results presented in this paper. We tested the system against different standard clustering techniques and different data sets, and we found it very beneficial and rewarding to pursue the semantic understanding
© 2009 ACADEMY PUBLISHER
403
direction for other mining processes such as document classification and retrieval. REFERENCES 1. Baeza-Yates, R., and Ribeiro-Neto, B., Modern Information Retrieval, ACM Press, New York, 1999. 2. Belkin, N. J., and Croft, W. B., "Information filtering and information retrieval: Two sides of the same coin?," Communications of the ACM, vol. 35, no. 12, pp. 29-38, 1992. 3. Berkhin, P., “Survey of Clustering Data Mining Techniques,” Technical Report, Accrue Software, 2002. 4. Boley, D., "Principal direction divisive partitioning", Data Mining and Knowledge Discovery, 2(4):325-344, 1998. 5. Boley, D., Gini, M., Gross, R., Han, S., Hastings, K., Karypis, G., Kumar, V., Mobasher, B., and Moore, J., "Partitioning-based clustering for web document categorization", Decision Support Systems, 27:329-341, 1999. 6. Boley, D., Gini, M., Gross, R., Han, S., Hastings, K., Karypis, G., Kumar, V., Mobasher, B., and Moore, J., "Document categorization and query generation on the World Wide Web using WebACE", AI Review, 13(56):365-391, 1999. 7. Chakrabarti, S., Mining the Web: Discovering Knowledge from Hypertext Data. Morgan Kaufmann Publishers, 2003. 8. Cios, K., Pedrycs, W., and Swiniarski, R., Data Mining Methods for Knowledge Discovery. Kluwer Academic Publishers, 1998. 9. Cunningham, H., Maynard, D., Bontcheva, K., Tablan, V., "GATE: A Framework and Graphical Development Environment for Robust NLP Tools and Applications," Proceedings of the 40th Anniversary Meeting of the Association for Computational Linguistics (ACL'02). Philadelphia, July 2002. 10. Cutting, D.; Karger, D.; Pedersen, J.; and Tukey, J.: “Scatter/gather: A cluster-based approach to browsing large document collections.” In 16th International ACM SIGIR Conference on Research and Development in Information Retrieval, pages 126-135, 1993. 11. Dasarathy, B.V.: "Nearest Neighbor (NN) Norms: NN Pattern Classification Techniques." McGraw-Hill Computer Science Series. IEEE Computer Society Press, Las Alamitos, California (1991). 12. Deerwester, S., Dumais, S. T., Furnas, G. W., Landauer T. K., and Harshman, R., “Indexing by Latent Semantic Analysis,” Journal of the American Society for Information Science, 1990. 13. Dempster, A. P., Laird N. M., land Rubin, “Maximum Likelihood from. Incomplete Data via the EM Algorithm”. Jounal of the Royal Statistical Society, Series B (Methodological), 39(1):1-38, 1977. 14. Eikvil, L., "Information Extraction from World Wide Web – A Survey," Technical Report 945, Norwegian Computing Center, July, 1999. 15. Hartigan, J. A., and Wong, M. A. “A K-means clustering algorithm”. Applied Statistics, 28:100-108, 1979. 16. Hasan, M., Matsumoto, Y. “Document Clustering: Before and After the Singular Value Decomposition”, Sapporo, Japan, Information Processing Society of Japan (IPSJ-TR:99-NL-134.) pp. 47-55, 1999. 17. Hill, D.R.: "A vector clustering technique." In Samuelson, ed.: Mechanized Information Storage, Retrieval and Dissemination. North-Holland, Amsterdam (1968).
404
18.
19. 20. 21.
22. 23.
24.
25. 26. 27. 28.
29.
30.
31. 32. 33.
JOURNAL OF SOFTWARE, VOL. 4, NO. 5, JULY 2009
Honkela, T., Kaski, S., Lagus, K., and Kohonen, T.” “WEBSOM self-organizing maps of document collections.” In Proceedings of WSOM'97, Workshop on Self-Organizing Maps, pages 310-315, Espoo, Finland, June 1997. Jain, A. K., and Dubes, R. C., “Algorithms for Clustering Data”, Prentice Hall, Englewood Cliffs NJ, U.S.A, 1988. Jang, J., Sun, C., and Mizutani, E., Neuro-Fuzzy and Soft Computing - A Computational Approach to Learning and Machine Intelligence. Prentice Hall, 1997. Khaled Shaban, Otman Basir, Mohamed Kamel, “Document Mining Based on Semantic Understanding of Text”, Lecture Notes in Computer Science 4225, pp. 834843, 2006. Springer-Verlag Berlin Heidelberg 2006. Kohonen, T.: Self-Organizing Maps, Springer, Berlin, Heidelberg, 2001. Krishnapuram, R.; Joshi, A.; and Yi, L.: “A fuzzy relative of the k-medoids algorithm with application to web document and snippet clustering.” In IEEE International Conference on Fuzzy Systems, Korea, August 1999. Lee, D. L., Chuang, H., and Seamons, K., “Document Ranking and the Vector-Space Model,” IEEE Computer, Theme Issues on Assessing Measurement, 14(2):67-75, April/May, 1997. Lewis, David, "Introduction to Dying for Information," 1996, www.reuters.com/rbb/research/dfiforframe.htm. Ljungstrand, P.; and Johansson, H. “Intranet indexing using semantic document clustering.” Master Thesis. Department of Informatics, Göteborg University, 1997. Michell, T.: Machine Learning. McGraw Hill, 1997. Mostafa, J., Mukhopadhyay, S., Lam, W., Palakal, M., "A Multi-level Approach to Intelligent Information Filtering: Model, System & Evaluation," ACM Transactions on Information Systems, 15(4): pp. 368-399, 1997. Sushil Podder, Khaled Shaban, Jiping Sun, Fakhri Karray, Otman Basir, and Mohamed Kamel, “Performance improvement of automatic speech recognition systems via multiple language models produced by sentence-based clustering,” In proceedings of IEEE International Conference on Natural Language Processing and Knowledge Engineering, Beijing, October, 2003. Reuters. "Dying for Information: An Investigation into the Effects of Information Overload in the USA and Worldwide", Based on research conducted by Benchmark Research. London: Reuters Limited, 1996. Shannon, C.E.: "A Mathematical Theory of Communication", Bell Syst. Tech. J., 27, 379-423, 623656, 1948. Soderland, S., Learning Information Extraction Rules for Semistructured and Free Text. Machine Learning, 1999. Steinbach, M.; Karypis, G.; and Kumar, V. “A comparison of document clustering techniques.” KDD2000 Workshop on TextMining, August 2000.
© 2009 ACADEMY PUBLISHER
34. Text Analysis International, Inc. "Integrated Development Environments for Natural Language Processing", White Paper, http://www.textanalysis.com/, October 2001. 35. Text Analysis International, Inc. "Multi-Pass MultiStrategy NLP", White Paper, http://www.textanalysis.com/, October 2003. 36. van Rijsbergen, C. J.: Information Retrieval, Woburn Massachusetts. Butterworths, 1979.
Khaled Bashir Shaban received his Ph.D. in 2006 from the Department of Electrical and Computer Engineering, University of Waterloo, Waterloo, Canada. His research experience in academic and industrial institutions covers a variety of domains in intelligent systems application and design. He worked on semantic-based document mining systems and introduced a formal semantic representation of linguistic inputs, and developed a new distance measure to determine the similarities between contents of documents. He also investigated the application of information fusion in multi-agent systems for improving Web information retrieval. This work resulted in improving Web searching tools in terms of efficiency and information relevancy. Dr. Shaban has been involved, both in academic and industrial settings, with a number of research and development projects including building natural speech understanding voice enabled systems, developing advanced eLearning application systems, and solving several data mining and optimization problems in various fields. He is currently an Assistant Professor in the Department of Computer Science and Engineering, College of Engineering, Qatar University, Doha, Qatar.