Journal of Experimental Psychology: Learning, Memory, and Cognition 2008, Vol. 34, No. 6, 1544 –1551
Copyright 2008 by the American Psychological Association 0278-7393/08/$12.00 DOI: 10.1037/a0013217
A Shift in Task Routines During the Learning of a Motor Skill: Group-Averaged Data May Mask Critical Phases in the Individuals’ Acquisition of Skilled Performance Esther Adi-Japha
Avi Karni
Bar-Ilan University
Haifa University
Ariel Parnes
Iris Loewenschuss
Hebrew University
Bar-Ilan University
Eli Vakil Bar-Ilan University The authors describe a transient phase during training on a movement sequence wherein, after an initial improvement in speed and decrease in variability, individual participants’ performance showed a significant increase in variability without change in mean performance speed. Subsequent to this phase, as practice continued, variability again decreased, performance significantly exceeded the gains predicted by extrapolation of the initial learning curve, the type of errors committed changed, and performance became more coherent. The transient phase of increased variability may reflect a mixture of 2 (or more) performance routines before the more effective one is set and mastered, presumably the setting up of a sequence-specific representation. Both group and individual analyses indicated a departure from the single process (e.g., power-law) model of learning. However, although similar phases appeared in the mean group data, there was little correspondence to individual participants’ time courses, and the individuals’ gains in the second low-variability phase were masked. Keywords: procedural learning, sequence learning, strategy change
trolled, more effortful mode and eventually a more automatic mode (Anderson, 1982; Chein & Schneider, 2005). In theories of cognitive skill learning, these are often mapped into algorithmic and memorybased processes (Logan, 1988), and it is debated whether these processes can run in parallel (Rickard, 2004). Motor-skill-learning studies suggest that the transition between modes reflects in part a process of concatenation of consecutive performance elements into one complex unit through interactions between neighboring elements (coarticulation; Sosnik, Hauptman, Karni, & Flash, 2004). Recently, a shift in processing within the training session, occurring after a critical number of task iterations, has been proposed as a necessary trigger for individuals’ improvement between daily sessions (Hauptmann & Karni, 2002). Models of group-averaged performance gains may well represent the individual data when individual performance is modeled as a simple function (e.g., Estes, 1956; Estes & Maddox, 2005; Myung, Kim, & Pitt, 2000). However, because transitions between performance phases may occur, and because they may occur at different time points during practice for different individuals, averaging across participants may generate monotonic, gradually improving, group learning curves, smoothing out these transitions (e.g., Rickard, 2004). In some cases, the shift between phases can be abrupt, and the signal-to-noise ratio at the individuals’ level can be large enough to reliably identify the point of change (Gallistel et al., 2004; Rickard, 2004). However, such an identification algorithm is inapplicable in cases where the variability is large compared with the improvement
Group learning curves for a variety of tasks, with averaging across individual participants and across blocks of trials, are often characterized by negatively accelerated, gradually improving performance (e.g., speed and accuracy), accompanied by a decrease in performance variability (Ashby, Ennis, & Spiering, 2007; Logan, 1988; Segalowitz & Segalowitz, 1993). It is commonly assumed, implicitly or explicitly, that these curves well represent individual performance (Gallistel, Fairhurst, & Balsam, 2004; Rickard, 2004). Recent studies of individuals’ learning extending over hours or days (Gallistel et al., 2004; Karni & Sagi, 2003; Korman, Raz, Flash, & Karni, 2003; Rickard, 2004) suggest, however, that the acquisition of a task involves multiple identifiable phases characterized by qualitatively and quantitatively different performance routines. One leading notion is that some of these performance changes are related to transitions between two types of processing modes: an initial, con-
Esther Adi-Japha, School of Education and Leslie and Susan Gonda (Goldschmied) Multidisciplinary Brain Research Center, Bar-Ilan University, Ramat-Gan, Israel; Avi Karni, Brain and Behavior Research Center, Haifa University, Haifa, Israel; Ariel Parnes, Department of Cognitive Science, Hebrew University, Jerusalem, Israel; Iris Loewenschuss and Eli Vakil, Department of Psychology and Leslie and Susan Gonda (Goldschmied) Multidisciplinary Brain Research Center, Bar-Ilan University. Correspondence concerning this article should be addressed to Esther Adi-Japha, School of Education, Bar-Ilan University, Ramat-Gan, Israel 52900. E-mail:
[email protected] 1544
BRIEF REPORTS
throughout training or in cases of gradual transitions (Touron, 2006). In these cases, variability in itself, rather than mean performance, may be an indicator for a transition (e.g., Rickard, 1999). A phase of increased variability may arise either when a set of performance routines is explored before the more effective one is set and mastered (Thelen & Smith, 1993) or because of a mixture of coexisting performance routines, for example, during a transition phase (Adi-Japha & Freeman, 2000; Rickard, 1999). Previous research suggests that when a single learning process is at work, a power function represents the group-averaged performance curve well (Newell & Rosenbloom, 1981). However, for a single process model to hold true, one expects that a power function may also represent the individuals’ decrease in variance (standard deviation) well (Logan, 1988; Rickard, 1999) and that a linear relationship occurs between performance time and its standard deviation (Wagenmakers & Brown, 2007) on an individual level (and thus in group-average performance). Here, we analyzed performance data in a single session of training on a computerized version of the finger opposition sequence (FOS) learning task, a task that has been extensively used as a paradigm in both behavioral and brain imaging studies of the establishment of long-term procedural memory (e.g., Dorfberger, Adi-Japha, & Karni, 2007; Fischer, Hallschmid, Elsner, & Born, 2002; Karni et al., 1995; Korman et al., 2007; Walker, Brakefield, Morgan, Hobson, & Stickgold, 2002). In the FOS task, a five-movement sequence is fully available to the participants in an explicit manner from the first recorded trial, and the gains reflect increased skill of execution. Brain imaging studies have shown that the brain activation in primary motor cortex (contralateral to the performing hand) evoked by executing the FOS undergoes a qualitative change—from a component movement representation (chunking) to a coherent representation of the sequence (Karni et al., 1995; Toni, Krams, Turner, & Passingham, 1998). Moreover, it was proposed that, within the initial training session, the attainment of asymptotic performance, in terms of speed, may reflect in part a qualitative switch from a motor routine (task solution mode, motor set) based on concatenation of consecutive performance elements toward a representation of the sequence in the motor system as a specific, unitary movement routine (Korman et al., 2003). We show that both group-averaged and individual data sets are inconsistent with the hypothesis of a single learning process within a session of practice. Moreover, our results suggest that the change in performance mode and presumably the change in the representation of the movement sequence in the motor system may be reflected in a phase of increased performance variability (with no change in performance speed) that can be reliably identified in the individual’s data. Subsequent to this phase, performance was superior to the one predicted by a single power-law function fitted to the initial part of the training session, the type of errors committed changed, and keypress latencies indicated more coherent performance. Group-averaged data may mask this qualitative change in performance.
Method Participants Seventeen psychology students (4 men), ages ranging from 19 to 26 years (M ⫽ 22.48 years), all right-handed, took part in the study as part of their first year duties. None had a history of neurological or musculoskeletal disorder or of medication use.
1545
Task A computerized version of the FOS learning task (Karni et al., 1995), in which typing movements were substituted for the opposition movements of the original task, was used (Walker et al., 2002; Fischer et al., 2002). Participants were instructed to repeatedly type a fivemovement sequence, 41323, with the four fingers (thumb excluded) of their right hand in a cued manner. One sequence was used throughout the experiment. Participants completed 15 blocks; each block included 10 sequences, with a 60-s break between blocks. The break ended by a keypress following a get-ready tone. The time of each keypress was recorded at 1-ms resolution using the SuperLab Pro (1997) software package and keyboard. Participants had three warm-up sequences guided by the experimenter in a slow, paced manner. These sequences were not analyzed. The recorded sequences were analyzed in terms of speed (performance time for the target sequence) and accuracy measured by number of sequencing errors.
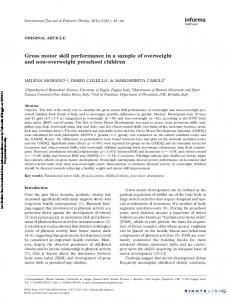
Results Out of the 150 sequences, participants performed correctly on 137–148 sequences with an average of 6.45 errors per session. On average, 3 outliers, defined as sequence times that differed from the within-participant block-averaged sequence time by more than three times the block standard deviation, were excluded from further analyses. The series of responses subjected to further analysis ranged from 129 to 148 sequences (M ⫽ 139.08, SD ⫽ 5.14) per session. Figure 1A shows a three-parameter power-law regression line (sequence time ⫽ a ⫻ block⫺b ⫹ c) fitted against the group’s mean blocked sequence time (average performance speed). Although the fit was significant, R2 ⫽ .87 ( p ⬍ .001), the Wald– Wolfowitz runs algorithm (Wagenmakers & Brown, 2007) that tests whether the residuals of the power-function fit are random by assessing the number of times their signs (positive or negative) alternate, demonstrated a significant deviation from randomness, Z ⫽ 2.13, p ⬍ .03. Similar results (i.e., a significant fit to power law, R2 ⫽ .87, p ⬍ .001, and a significant deviation of residuals from randomness, Z ⫽ 2.14, p ⬍ .04) were obtained when the data were first log transformed, then averaged and anti-logged (Rickard, 1999). As can be seen (see Figure 1A), there was an interval around Block 9 where the distance between actual values and the modeled curve (residuals) deviated in a nonrandom manner but still within the 95% confidence limits. Figure 1B shows the between- and within-participant variability. The linear fit and the fit to a power function of the betweenparticipants standard deviation over the 15 experimental blocks approached significance (R2 ⫽ .21, p ⬍ .09, and R2 ⫽ .26, p ⬍ .06, respectively), indicating an overall reduction in variability. However, the linear trend of the averaged within-participant standard deviation did not differ significantly from zero ( ⫽ .07, p ⬎ .8) and the fit of a power function was very poor (R2 ⫽ .01), but the fit to a cubic function approached significance (R2 ⫽ .45, p ⬍ .08). The linear correlation between mean sequence time and withinparticipant standard deviation was low and statistically nonsignificant, r(15) ⫽ .38, p ⬎ .1. When estimated for each individual separately, the correlations were significant only for 5/17 participants. To test whether the residuals of a linear regression of within-participant standard deviation on mean sequence time are random, we applied a runs test. A significant deviation of the
BRIEF REPORTS
1546 2300
500
A
B
2200
450
2100
350
1900
SD (ms)
Sequance time (ms)
400 2000
1800 1700
300
Between participants Within participant
250
1600 200 1500 150
1400 1300
0
5
10
15
100
0
Block
5
10
15
Block
Figure 1. A: Actual data and a power-law fit to mean groups’ sequence time (average performance speed). Error bars indicate the 95% confidence interval. B: Between-participants and averaged within-participants variability (i.e., the standard deviation of participants’ mean performance and average of participants’ standard deviation).
residuals from randomness (Z ⫽ 2.14, p ⬍ .04) indicated that the relationship between these two variables was not linear (Wagenmakers & Brown, 2007). Altogether these analyses suggest that the hypothesis of a single learning process was not supported by our data. The runs test showed that necessary conditions were not met. To identify performance changes beyond those predicted by a single power-law model of the group-averaged data, we extrapolated to the last four blocks of the session a three-parameter power function fitted to the first few blocks (i.e., three, four, . . . , nine blocks) (Rickard, 2007). In all analyses, the extrapolated values fell within the confidence interval of each of the final four blocks of the session. Thus, although the hypothesis of a single learning process was not supported, a single power function fitted the group-averaged data well. Therefore, a sequence-by-sequence analysis of the individual data as well as of the group-averaged data was undertaken instead. At the individual level, the individuals’ mean variability in sequence time across the training blocks was large relative to the overall improvement attained in the session (with a ratio of 0.76 ⫾ 0.84). Point-of-change algorithms for the identification of phases (changes) in performance were therefore inapplicable (Gallistel et al., 2004). The method used instead was a combination of the critical moment method adopted from the dynamic systems approach, which allows one to assay a transient increase in variability with respect to a smooth fit to the series of sequence times (van Geert & van Dijk, 2002), and the extrapolation method (Anderson, Fincham, & Douglass, 1999; Rickard, 2007). The logic underlying the extrapolation method is that if more than a single process of learning is at work, one expects that later parts of the learning curve would significantly deviate from a model based on extrapolation from the initial part of curve. The critical moment method was used to identify parts of the learning curves to which the extrapolation method could be applied.
Sequence-by-Sequence Analysis: Individual Level The variability of residuals with respect to a single power-law fit (i.e., the standard deviation of the difference between the data points and their power-law fit) was calculated using a moving window five sequences long (van Geert & van Dijk, 2002). This short window enabled a good localization of the point(s) of change in variability and is the minimal effective window size for grouping data. The application of this window generated a set of partially overlapping series of sequences, each series five sequences long and staggered by one relative to its neighbors. The calculation of variability of residuals generated a measure of residuals variability, where the first value is the standard deviation of residuals from Sequences 1 to 5 (t1 . . . t5), the second value from Sequences 2 to 6 (t2 . . . t6), and so on. This set of residuals’ variability yielded the following phases. 1.
An initial (baseline) phase comprising a series of more than 10 sequences (block size) with low residuals’ variability was identified in all 17 participants. The baseline series extended over 17.11 ⫾ 6.51 sequences, starting, on average, at sequence number 34.23 ⫾ 28.87 (see Figure 2, data points within circles).
2.
A second phase comprising a series of sequences showing a significantly higher residuals’ variability, compared with that of the baselines series, was also identified for each individual (see Figure 2, data points within triangles). The criterion for detecting a significant change in variability was six consecutive sequences with residuals’ variability above the 95% confidence interval for the baseline points (van Geert & van Dijk, 2002). The first such series to emerge after the baseline series is shown in
Sequence time (ms) Sequence time (ms) Sequence time (ms) Sequence time (ms)
BRIEF REPORTS
2500
3000
A
1547 B
2000 1500
2000
1000 500
0
2000
50
100
150
1000
0
3000
C
50
100
150
50
100
150
50
100
150
50
100 Sequence
150
D
1500 2000 1000 500
0
4000
50
100
150
E
1000
0
F
3000
3000
2000
2000 1000 0 2000
50
100
150
1000
0
2500
G
H
2000
1500
1500 1000 0
50
100 Sequence
150
1000
0
Figure 2. Performance of 8 individual participants that showed the three variability phases: A–D ⫽ best cases, E–H ⫽ worst cases. Circled data points represent 11 or more consecutive sequences with low performance variability (baseline sequences). These were followed by sequences with significantly higher performance variability (the first set of sequences is shown, triangles). The latter are followed by 11 or more consecutive sequences with lower performance variability (squares). A power-law model fitted to the initial part of the session, up to the last baseline sequence, is in a bold line; its extrapolation is the dashed line. The four best and four worst examples are arranged by their p values of comparison between the extrapolation and the data of the second low variability phase (squares). Note that for Case H, a second phase of increased variability may be detected.
Figure 2 (data points within triangles). This series of sequences was identified for 16/17 participants. The series extended over 11.43 ⫾ 2.96 sequences starting, on average, at sequence number 69.5 ⫾ 28.19. 3.
A decrease in variability was detected after the highvariability Series 2 in 15/16 participants in which the high-variability phase was identified. These series were characterized by reduced residuals’ variability relative to the preceding high-variability series and thus constituted good candidates for testing with the extrapolation method (see Figure 2, data points within squares). An extrapolation of a three-parameter power law was fitted to the initial part of the learning curve, from first sequence of the session to the final sequence of the baseline series (see Figure 2). Within the series of sequences composing the third phase (with reduced residuals’ variability), a subseries, more than 10 sequences long, with sequence times significantly lower than the values expected from the power-law extrapolation was identified for 14/15 participants (paired-samples t tests for each individual). This last series extended over 18.14 ⫾ 6.04 sequences starting, on average, at sequence number 100.29 ⫾ 21.18.1
Thus, for 14/17 of the participants (a significant majority, binomial p ⬍ .02), we could identify a first phase of low residuals’ variability with respect to a power law fitted to the learning curve, followed by a phase of increased residuals’ variability and a third phase of low residuals’ variability. For these individuals, the average residuals’ variability of the three phases was significantly different, F(2, 26) ⫽ 48.88, p ⬍ .001, 2⫽.79. Bonferroni post hoc analysis indicated higher second phase variability compared with the first and third phases, with no significant difference between the residuals variability in the two low-variability phases (first and third phases). These participants’ mean sequence times in the first
1 A similar analysis using a LOESS smoothing technique (with a 30% window, quadratic fit) provided a significantly better fit to the data, t(13) ⫽ 3.66, p ⬍ .01, 2 ⫽ .51, producing identical results in terms of the variability phases. The second variability phase had significantly lower variability when fitted by the LOESS than by the power law, t(13) ⫽ 7.29, p ⬍ .001, 2 ⫽ .80. When the analysis was repeated with the warm-up sequences included, either with the LOESS or with the power-law fit, the same three variability phases were identified, with performance in the third phase significantly better than that expected by a power-law extrapolation of the initial part of the curve, in 13 participants (i.e., 13/17, a significant majority, binomial, p ⬍ .05).
BRIEF REPORTS
1548
and second variability phases were significantly higher than in the third variability phase, F(2, 26) ⫽ 26.14, p ⬍ .001, 2 ⫽ .67; Bonferroni p ⬍ .04. Moreover, the mean performance in the latter low-variability phase was significantly better than that expected by a power-law extrapolation of the initial part of the learning curve, t(13) ⫽ 7.97, p ⬍ .001, 2⫽.83.2 We also ruled out the possibility that random noise could explain our experimental results (details of these analyses are available from Esther Adi-Japha).
Sequence-by-Sequence Analysis: Group Level The comparison between the group-averaged and individual data was run on the 129 sequences common to all participants. As in the group-averaged blocked data, when a single power-law model was tested, the mean sequence time was well fitted by the model, R2 ⫽ .76, p ⬍ .001, but the runs test applied to the residuals of the fit demonstrated a significant deviation from randomness, Z ⫽ 5.04, p ⬍ .001. When the procedure, described above, was applied for the identification of the three phases of residuals’ variability with respect to a single power-law function fitted to the to the group’s mean sequence times, the three phases were identified and consisted of Sequences 59 –72, 87–97, and 103–128, respectively (see Figure 3). An analysis of variance (ANOVA) showed significant differences in residuals’ variability between the three phases detected, F(2, 32) ⫽ 5.15, p ⬍ .02, 2 ⫽ .24. The residuals’ variability of the second variability phase was significantly higher than that of the first and third variability phases (Bonferroni, p ⬍ .05), with no significant difference between the two low-variability phases. A paired-samples t test indicated that the group mean sequence times in sequences performed in the third phase (Sequences 103–128) fell below the values expected from an extrapolation based on the initial part of the training session (Sequences 1–72; see Figure 3), t(25) ⫽ 2.54, p ⬍ .02, 2 ⫽ .25. However, the
Sequence time (ms)
2400 2200 2000 1800
corresponding values extrapolated from individually fitted powerlaw functions did not significantly differ from the actual sequence times for Sequences 103–128, t(16) ⫽ 1.16, p ⬎ .1. Furthermore, paired-samples t tests indicated that only for 6/17 participants were sequence times at the group-derived third phase (Sequences 103– 128) better than the values extrapolated from a power-law function based on the initial part of the training session (Sequences 1–72). These results were unchanged when the extrapolation was based on fewer sequences, that is, 1–17, 1–18, . . . , 1–71, and the test was restricted to the 14 participants who showed the three variability phases. Overall, for 10 of the 14 participants, in which all three phases were reliably detected on an individual basis, at least one phase was mislocalized by the groups’ mean residuals’ variability analysis. Three additional participants failed to show the three phases altogether. Thus, the identification of performance variability phases by the group-averaged data was misleading in 13/17 participants.
Behavioral Indications for Transition Between Performance Routines There were two behavioral indications for a transition between performance routines during the training session: error analysis and keypress latencies analysis, both analyses applied to sequences in the blocks comprising the three variability phases. Errors were classified as either between-sequence errors, relating to the transition from one to the next sequence, or within-sequence errors. Omissions of the first or final sequence key, exchange of either of those keys with a different key (but only when the fourth key was correct), or repetition of the final sequence key were considered betweensequence errors. All other errors were considered within-sequence errors. The 14/17 participants for which the three phases were identified showed very few errors in the three variability phases (.29, .63, and .36 errors per 10 sequences in the first, second, and third phases, respectively), with no significant differences between phases. However, within-sequence errors were more frequent in the first phase, whereas between-sequences errors were more frequent in the third phase ( p ⬍ .01, sign-rank statistics; this pattern of results remained unchanged when error rates were weighted by the number of keys or shifts between keys). Second, a 3 (phase) ⫻ 5 (keypress latency) repeated-measures ANOVA showed a significant effect for phase, F(2, 26) ⫽ 20.67, p ⬍ .001, 2 ⫽ .61, reflecting a monotonic decrease in latencies,
1600 1400 0
50
Sequence
100
150
Figure 3. Group’s mean performance. Circled data points represent 11 or more consecutive sequences with low performance variability (baseline sequences). These were followed by sequences with significantly higher performance variability (the first set of sequences is shown, triangles). The latter are followed by 11 or more consecutive sequences with lower performance variability (squares). A power-law model fitted to the initial part of the session, up to the last baseline sequence, is in a bold line; its extrapolation is the dashed line.
2 The power function fit to the initial part of the session could be influenced by some second phase sequences (before the criterion for increased variability is met); this may possibly affect third phase extrapolation values. The extrapolations were repeated with a stringent variability criterion on first phase points that shortened the length of this phase: First, the minimal value of the residuals’ variability was identified for each participant. Second, the first point beyond that minimal value, where the residual’s variability was higher than its mean value by 1.5 (or more) standard deviations, was identified. This point became the endpoint for the extrapolation. The resulting extrapolation values were nevertheless significantly higher than the actual sequence times in Phase 3 for the 14 participants as well as for their averaged performance, t(13) ⫽ 6.61, p ⬍ .001, 2 ⫽ .77.
BRIEF REPORTS
with the first and second phases significantly different from the third phase (Bonferonni, ps⬍.01). There was also a significant effect for keypress latency, F(4, 52) ⫽ 10.34, p ⬍ .001, 2 ⫽ .44, and for the Phase ⫻ Keypress Latency interaction, F(8, 104) ⫽ 2.49, p ⬍ .02, 2 ⫽ .16. Post hoc comparisons to assay the interaction showed a significant interaction between the first and second phases, F(4, 52) ⫽ 2.97, p ⬍ .03, 2 ⫽ .13, and between the first and third phases, F(4, 52) ⫽ 3.68, p ⬍ .01, 2⫽.22. A similar analysis applied to the variability of keypress latencies indicated a main effect of phase, F(2, 26) ⫽ 8.24, p ⬍ .01, 2⫽.39, with, however, a significant increase in variability in the second phase, relative to the first and third phases (Bonferroni, p ⬍ .02). As a test for chunking or coarticulation, the latency of keypresses in pairs of successive sequence elements was compared within the three variability phases (see Figure 4). In all three phases, the latency to the first keypress of the sequence (i.e., latency to 4) was significantly longer than the latency to the second keypress, t(13) ⬎ 2.43, p ⬍ .05, 2 ⬎ .31. The latency to the third keypress was found to be significantly longer than the latency to the fourth keypress only in the first variability phase, t(13) ⫽ 2.60, p ⬍ .03, 2 ⫽.34. Next, the difference in the latencies between successive keypresses in each phase was computed and compared for pairs of variability phases. The difference in latencies between the third and fourth keypresses was significantly larger in the first phase than in the third phase, t(13) ⫽ 2.16, p ⬍ .05, 2 ⫽ .26.
Discussion The current results show that the change in within-participants’ performance variability within a single training session of a motor skill was not monotonic. This indicates a departure from standard power-law models of skill learning (Newell & Rosenbloom, 1981) as well as from the notion of parallel performance routines competing throughout the whole session (Logan, 1988). Our results also show that although a single power-law model fits the groupaveraged learning curve well, it may misrepresent the temporal profiles of and even mask critical phases in the acquisition of the task at the individual level.
Figure 4. Latencies to keypresses: Analysis of pairs of successive keys. ⴱ p ⬍ .05.
1549
Specifically, a transient phase of increased performance variability, preceded and followed by phases of low variability, was identified in the individual participants’ performance. Performance level following this increased-variability phase significantly exceeded the gains predicted by extrapolation of the learning curve fitted to the initial part of the session. These results are inconsistent with a single power-law model of individual learning. We propose that increased performance variability, independent of performance level, reflects a transition between performance modes, that is, a phase during which two or more task performance modes are tried in successive iterations of the task, (Thelen & Smith, 1993; Touron, 2006) before the more effective mode is set to be subsequently mastered and represented in motor memory as a new task routine. There were independent behavioral indications for a transition between performance modes during the transient high-variability phase. First, within-sequence errors predominated in the initial low-variability phase, whereas between-sequence errors predominated in the later low-variability phase. This result is consistent with verbal reports elicited in the standard FOS task (M. Korman, personal communication, May 2007) that the production of the within-sequence movements becomes easier by the end of the training session, but there is sustained difficulty in the endsequence and begin-sequence movements. Second, the pattern of keypress latencies in the latter phases (i.e., the second and third phases) were significantly different from the first low-variability phase rather than just reflecting a monotonic reduction in average latencies across the session. In the first low-variability phase, the subsequence 323 (i.e., the latencies to the fourth and fifth keypresses) could be clearly defined, because it was executed more rapidly than the rest of the sequence (i.e., there was a significant difference between the third and fourth keypress latencies; see Figure 4). In contrast, by the third phase successive pairs of within-sequence keypresses were performed at a similar mean latency. Thus, in the latter phases, a concatenation of consecutive movement elements (chunks, as expressed in the first lowvariability phase subsequences) may be superseded by a specific representation of the whole sequence of movements, indicating a more coherent within-sequence performance (Karni et al., 1998; Sosnik et al., 2004). The increased variance during the initial performance of a novel movement sequence presumably reflects processes such as trial and error and adaptation of performance solutions (e.g., Thelen & Smith, 1993) and in general a more controlled execution (Anderson, 1982; Chein & Schneider, 2005; Logan, 1988). The subsequent (first) low-variability phase reflects the selection of a given task solution mode and its optimization as a function of repetition. Assuming that minimizing variability is a desired goal of the nervous system (Harris & Wolpert, 1998), a subsequent transient increase in performance variability independent of performance level may indicate an early stage in the establishment of a novel working routine, a set solution for task performance. The proposal is that for a short interval, a mixture of two performance routines is used and the variance includes the variability from each routine in addition to the variability due to the differences between the routines’ mean performance levels (Rickard, 1999; Touron, 2006). Initially, performance speed of the new routine may be slower than that attained in the prior, more practiced routine, thus average
BRIEF REPORTS
1550
speed gains are temporarily slowed (no significant difference compared to the first low-variability phase). One should note that although one phase of shifting toward a more coherent performance routine was consistently identified in the current study, other subsequent shifts may occur even within a longer training session. The switch in brain activity pattern in practicing the FOS task (e.g., Karni et al., 1995; Toni et al., 1998) was related to the attainment of the asymptotic phase of the learning curve, a notion indirectly supported by subsequent behavioral data (Korman et al., 2003). The current results suggest a new framework for interpreting the brain imaging data by replacing the proposed asymptotic performance criterion with objective variability-based criteria as the indicator for the switch in sequence representation. Whether our results can be extended to longer sequences or other sequence learning tasks where the sequence is not explicitly instructed before training (e.g., the serial reaction time task) and whether the increased-variability phase occurs in other performance measures such as force and acceleration (Krakauer & Shadmehr, 2006) need to be addressed empirically. In more complex cognitive task learning, changes in performance parameters, especially nonmonotonic ones, are assumed to mark the changing contribution of different cognitive processes to performance (Chein & Schneider, 2005; Price, 2006). The absence of such phases or untimely shifts between phases may indicate impaired functioning and may result in a failure to generate long-term memory (Hauptmann & Karni, 2002; Touron, 2006). Thus, our results highlight the relevance of individuals’ learning curves rather than the group-averaged data as the basis for imaging data interpretation as well as for designing effective training protocols.
References Adi-Japha, E., & Freeman, N. H. (2000). Regulation of division of labour between cognitive systems controlling action. Cognition, 76, 1–11. Anderson, J. R. (1982). Acquisition of cognitive skill. Psychological Review, 89, 369 – 406. Anderson, J. R., Fincham, J. M., & Douglass, S. (1999). Practice and retention: A unifying analysis. Journal of Experimental Psychology: Learning, Memory, and Cognition, 25, 1120 –1136. Ashby, F. G., Ennis, J. M., & Spiering, B. J. (2007). A neurobiological theory of automaticity in perceptual categorization. Psychological Review, 114, 632– 656. Chein, J. M., & Schneider, W. (2005). Neuroimaging studies of practicerelated change: fMRI and meta-analytic evidence of a domain-general control network for learning. Cognitive Brain Research, 25, 607– 623. Dorfberger, S., Adi-Japha, E., & Karni, A. (2007). Reduced susceptibility to interference in the consolidation of motor memory before adolescence. PLoS ONE, 2, e240. Retrieved February 28, 2007, from http:// www.plosone.org/article/info%3Adoi%2F10.1371%2Fjournal.pone. 0000240 Estes, W. K. (1956). The problem of inference from curves based on group data. Psychological Bulletin, 53, 134 –140. Estes, W. K., & Maddox, W. T. (2005). Risks of drawing inferences about cognitive processes from model fits to individual versus average performance. Psychonomic Bulletin & Review, 12, 403– 408. Fischer, S., Hallschmid, M., Elsner, A. L., & Born, J. (2002). Sleep forms memory for finger skills. Proceedings of the National Academy of Sciences, USA, 99, 11987–11991. Gallistel, C. R., Fairhurst, S., & Balsam, P. (2004). The learning curve:
Implications of a quantitative analysis. Proceedings of the National Academy of Sciences, USA, 101, 13124 –13131. Harris, C. M., & Wolpert, D. M. (1998, August 20). Signal-dependent noise determines motor planning. Nature, 394, 780 –784. Hauptmann, B., & Karni, A. (2002). From primed to learn: The saturation of repetition priming and the induction of long-term memory. Cognitive Brain Research, 13, 313–322. Karni, A., Meyer, G., Jezzard, P., Adams, M. M., Turner, R., & Ungerleider, L. G. (1995, September 14). Functional MRI evidence for adult motor cortex plasticity during motor skill learning. Nature, 377, 155–158. Karni, A., Meyer, G., Rey-Hipolito, C., Jezzard, P., Adams, M. M., Turner, R., & Ungerleider, L. G. (1998). The acquisition of skilled motor performance: Fast and slow experience-driven changes in primary motor cortex. Proceedings of the National Academy of Sciences, USA, 95, 861– 868. Karni, A., & Sagi, D. (1993, September 16). The time course of learning a visual skill. Nature, 365, 250 –252. Korman, M., Doyon, J., Doljansky, J., Carrier, J., Dagan, Y., & Karni, A. (2007). Daytime sleep condenses the time course of motor memory consolidation. Nature Neuroscience, 10, 1206 –1213. Korman, M., Raz, N., Flash, T., & Karni, A. (2003). Multiple shifts in the representation of a motor sequence during the acquisition of skilled performance. Proceedings of the National Academy of Sciences, USA, 100, 12492–12497. Krakauer, J. W., & Shadmehr, R. (2006). Consolidation of motor memory. Trends in Neuroscience, 29, 58 – 64. Logan, G. D. (1988). Toward an instance theory of automatization. Psychological Review, 95, 492–527. Myung, I. J., Kim, C., & Pitt, M. A. (2000). Toward an explanation of the power-law artifact: Insights from response surface analysis. Memory & Cognition, 28, 832– 840. Newell, A., & Rosenbloom, P. S. (1981). Mechanisms of skill acquisition and the law of practice. In J. R. Anderson (Ed.), Cognitive skills and their acquisition (pp. 1–55). Hillsdale, NJ: Erlbaum. Price, A. L. (2006). Explicit category learning in Parkinson’s disease: Deficits related to impaired rule generation and selection processes. Neuropsychology, 20, 249 –257. Rickard, T. C. (1999). A CMPL alternative account of practice effects in numerosity judgment tasks. Journal of Experimental Psychology: Learning, Memory, and Cognition, 25, 532–542. Rickard, T. C. (2004). Strategy execution in cognitive skill learning: An item-level test of candidate models. Journal of Experimental Psychology: Learning, Memory, and Cognition, 30, 65– 82. Rickard, T. C. (2007). Forgetting and learning potentiation: Dual consequences of between-session delays in cognitive skill learning. Journal of Experimental Psychology: Learning, Memory, and Cognition, 33, 297–304. Segalowitz, N. S., & Segalowitz, S. J. (1993). Skilled performance, practice, and the differentiation of speed-up from automatization effects: Evidence from second language word recognition. Applied Psycholinguistics, 14, 369 –385. Sosnik, R., Hauptman, B., Karni, A., & Flash, T. (2004). When practice leads to co-articulation: The evolution of geometrically defined movement primitives. Experimental Brain Research, 156, 422– 438. SuperLab Pro. (1997). (Version 1.04) [Computer software]. Phoenix, AZ: Cedrus. Thelen, E., & Smith, L. B. (1993). A dynamic systems approach to the development of cognition and action. Cambridge, MA: MIT Press. Toni, I., Krams, M., Turner, R., & Passingham, R. E. (1998). The time course of changes during motor sequence learning: A whole-brain fMRI study. Neuroimage, 8, 50 – 61. Touron, D. R. (2006). Are item-level strategy shifts abrupt and collective? Age differences in cognitive skill acquisition. Psychonomic Bulletin & Review, 13, 781–786.
BRIEF REPORTS van Geert, P., & van Dijk, M. (2002). Focus on variability: New tools to study intra-individual variability in developmental data. Infant Behavior & Development, 25, 340 –374. Wagenmakers, E. J., & Brown, S. (2007). On the linear relation between the mean and the standard deviation of a response time distribution. Psychological Review, 114, 830 – 841. Walker, M. P., Brakefield, T., Morgan, A., Hobson, J. A., & Stickgold, R.
1551
(2002). Practice with sleep makes perfect: Sleep-dependent motor skill learning. Neuron, 35, 205–211.
Received July 4, 2007 Revision received May 27, 2008 Accepted May 29, 2008 䡲
E-Mail Notification of Your Latest Issue Online! Would you like to know when the next issue of your favorite APA journal will be available online? This service is now available to you. Sign up at http://notify.apa.org/ and you will be notified by e-mail when issues of interest to you become available!