(Ne) and spatial genetic structure analyses from darkblotched rockfish. (Sebastes ..... three theoretical populations of Sebastes crameri (black, light gray, and ...
Biology, Assessment, and Management of North Pacific Rockfishes Alaska Sea Grant College Program • AK-SG-07-01, 2007
141
A Simulation Approach of Population Differentiation and Individual Assignment to Assess the Relevance of Spatial Genetic Data among Rockfishes Daniel Gomez-Uchida and Michael A. Banks
Department of Fisheries and Wildlife and Coastal Oregon Marine Experiment Station, Hatfield Marine Science Center, Oregon State University, Newport, Oregon
Abstract We combine temporal estimates of variance effective population size (Ne) and spatial genetic structure analyses from darkblotched rockfish (Sebastes crameri) to analyze the theoretical relationship between FST and population assignment (PA) of individuals to their site of origin under different migration scenarios. Although FST is the most common parameter to measure spatial genetic differentiation, its statistical significance can appear “inflated” by employing markers with numerous alleles (e.g., microsatellite DNA). PA can also assess the data’s strength for population discrimination by minimizing departures from HardyWeinberg and linkage (gametic) equilibria if genetic structure exists. Our results suggest that it is unrealistic to obtain informative PAs (>1/k, k = number of populations) when FST < 0.007, even though all simulations showed statistically significant FST values. This limit was proposed as threshold value to classify northeastern Pacific rockfishes using published and unpublished genetic information, and thus assessing which species are more or less likely to lose spatially unique genetic diversity if local populations are extirpated.
Introduction Information on the spatial genetic structure of marine organisms has been incorporated into management and conservation practices for
142
Gomez-Uchida and Banks—Relevance of Spatial Genetic Data
several decades (Carvalho and Hauser 1995). For instance, genetic differentiation among samples in space has been commonly understood as evidence for discrete stocks, thus granting them status of separate management units. The rationale behind this decision-making process is to avoid overexploitation of local (sub) populations, which might ultimately lead to loss of spatially unique genetic diversity. However, Waples (1998) exposed numerous potential flaws in interpreting marine genetic data for conservation initiatives. One important conclusion from that review is the importance of identifying when statistical and biological differences are in agreement. Current molecular tools containing a high number of alleles (e.g., microsatellites) have more intrinsic statistical power for hypothesis testing than less variable markers (Hedrick 1999, Kalinowski 2002); they are therefore more likely to show significant results, but do they reflect evolutionary processes that are relevant for management? Genetic differentiation (GD) is commonly reported in the literature as FST, a parameter that varies theoretically between 0 and 1, although average values for marine and anadromous fish populations within species do not usually exceed 0.1 (Waples 1998). Sampling among populations with large FST results in: (i ) genotype frequencies that depart from Hardy-Weinberg equilibrium (HWE) expectations, and (ii ) linkage (gametic) disequilibrium (LD) among physically unlinked loci (Hedrick 2000). Minimizing these two phenomena facilitates successful population assignment (PA) of individuals to their most likely source population by clustering methods (Pritchard et al. 2000). PA methods therefore represent another direct measure of the genetic data’s strength to discriminate populations. However, they and their implications for management are rarely considered when analyzing marine genetic data. A typical example of clear-cut management based on genetic data is found among salmon populations; a statistically significant FST = 0.07 among chinook salmon (Oncorhynchus tshawytscha) fall, winter, and spring life-history types from California’s Central Valley (Banks et al. 2000) ensures PA = 99% of individuals into their natal sources (Banks and Jacobson 2004). In comparison, darkblotched rockfish (Sebastes crameri), a typical marine example, shows FST = 0.002 that is also statistically significant, but clustering results in extremely low PA owing to negligible values of LD and deviations from HWE (Gomez-Uchida and Banks 2005). This finding further extends Waples’ (1998) question of how much GD is biologically significant, in this case from a management and conservation standpoint. Increasing numbers of endangered and overfished northeastern Pacific rockfishes (genus Sebastes) offer particular management challenges (Parker et al. 2000, Berkeley et al. 2004); varying levels of genetic differentiation across species complicates classification of which species face greater or lesser conservation risks if discrete management units
Biology, Assessment, and Management of North Pacific Rockfishes
143
are not implemented. In this paper, our goal was to identify a range of FST values for which levels of PA were “informative.” Because the number of source populations (k) defines the minimum level (random) of individual assignment, we considered informative if PA > 1/k. To accomplish this, we analyzed a series of theoretical FST vs. PA values under different migration/gene flow scenarios, which were compared to published and unpublished estimates of genetic differentiation within the Sebastes complex.
Material and methods The input model for our simulations was based on spatial genetic structure analyses (Gomez-Uchida and Banks 2005) and estimates of variance effective population size (Ne ≈ 10,000) for darkblotched rockfish Sebastes crameri in the northeastern Pacific (Gomez-Uchida and Banks 2006). Genetic drift and rates of inbreeding depend on Ne rather than census sizes (N) (Wright 1931). We assumed ideal conditions where Ne = N, and specified 24 populations with random mating—each containing 500 (10,000/24 ≈ 500) diploid individuals and equal number of males and females—distributed in one-dimension stepping-stone model of migration using Easypop (Balloux 2001). First, we chose 24 populations based on the number of samples that maximized estimates of GD for S. crameri after pooling small-size samples (Gomez-Uchida and Banks 2005). Second, the stepping-stone migration model (SSMM) was based on isolation-by-distance (IBD) patterns found in S. crameri (Gomez-Uchida and Banks 2005). Decay of gene flow with increasing geographic distance is characteristic of SSMM (Slatkin 1993). To generate a series of theoretical FST values, we ran ten simulations within eight migration or gene flow scenarios: 5%, 10%, 15%, 20%, 25%, 50%, 75%, and 95% of individuals to adjacent demes. We chose the Kallele mutation (KAM) model (Crow and Kimura 1970) for seven unlinked loci with different mutation schemes to account for the observed differences among loci found in Gomez-Uchida and Banks (2005). Mutation rates were estimated from the total number of alleles scored for each locus (Gomez-Uchida and Banks 2005) and using Ewens’ (1972) relationship between the expected number of neutral alleles in a sample of n = 250, and θ = 4Ne, where µ = mutation rate (Table 8.3, Nei 1987). We then used a linear regression (R2 = 0.98) to estimate θ from the observed number of alleles for each locus, and thus derive µ using Ne from GomezUchida and Banks 2006. We calculated the following mutation rates: µ1 = 0.000036; µ2 = 0.000042; µ3 = 0.000062; µ4 = 0.00013; µ5 = 0.00015; µ6 = 0.00015, and µ7 = 0.000010. Populations drifted for 10,000 generations with the option of minimal variability (i.e., all individuals start with the same allele); this setting provided a distribution of allele frequencies that best resembled those found in Gomez-Uchida and Banks (2005).
144
Gomez-Uchida and Banks—Relevance of Spatial Genetic Data
Population genotypes from each simulation were analyzed using FSTAT (Goudet 1995) for several overall genetic statistics: (i) level of genetic differentiation using FST (Weir and Cockerham 1984), (ii ) number of locus pairs in LD, and (iii) departures from HWE using FIT (Weir and Cockerham 1984). Given that each simulation is an independent event, we report average values and standard deviations that were plotted against all migration scenarios. Statistics from Gomez-Uchida and Banks (2005) were included as a reference in the plots. Significant probabilities (P < 0.05) associated with FSTs were calculated through randomizations (Goudet 1995). To estimate PA, we relied on a Bayesian estimator that probabilistically assigns individuals to hypothetical clusters so as to minimize departures from HWE and to minimize LD within each cluster (Pritchard et al. 2000). We then selected three populations from each simulation covering the entire linear theoretical distribution—two from the extremes and one from the middle. Likewise, genotypes from three sampling locations off the West Coast in Gomez-Uchida and Banks (2005)—Washington (W4), central Oregon (O10) and northern California (C5)—were included for comparison. Here, we used Whichloci (Banks et al. 2003) to enlarge sample sizes to match those of theoretical populations. We then utilized the software Structure version 2 (Pritchard et al. 2000) to determine membership coefficients for each individual into three independent clusters. The average individual membership coefficient into each cluster provides a measure of PA. Software settings included: burnin length = 15,000 repetitions; Markov Chain Monte Carlo run = 50,000 iterations; ancestry model = admixture; and allele frequency model = correlated (Falush et al. 2003). All runs assumed k (number of populations) = 3. We finally plotted the relationship between F ST and average PA among clusters for each migration scenario. To draw our conclusions, we took into account that PA had to be higher than 0.33 (k = 3) to be considered informative. These values were compared to published and unpublished genetic statistics (mainly FST) from 11 other congeneric species studies that used microsatellite markers.
Results Genetic statistics The magnitudes of FST, FIT, and LD decreased as levels of migration increased (Fig.1). The highest values were obtained with 5% of migration and the lowest with 75% or 95% of migration. Results from these high levels of gene flow best resembled actual darkblotched rockfish data. All FST values were statistically significant throughout all simulations.
145
Biology, Assessment, and Management of North Pacific Rockfishes
0.10
A Overall FST
0.08
0.06 0.04 0.02 0.00 0%
25%
50%
75%
100%
Gene flow
# Loci w/significant FST
8
B
7 6 5 4 3 2 1 0 0%
25%
50%
75%
100%
Gene flow
# Locus-pairs w/LD )
15
C
13 11 9 7 5 3 1 0%
25%
50%
75%
100%
Gene flow
Figure 1. Plots of genetic statistics such as (A) overall FST, (B) departures from Hardy-Weinberg equilibrium (FIT), and (C) linkage (gametic) disequilibrium (LD) as a function of varying levels of gene flow among theoretical populations of Sebastes crameri. Actual genetic statistics for S. crameri (Gomez-Uchida and Banks 2005) are represented with a dashed line for comparison (# = number).
Gomez-Uchida and Banks—Relevance of Spatial Genetic Data
146
Table 1. Population assignment (PA) of three theoretical populations—top, middle, and bottom—from the linear stepping-stone distribution, and three reference samples of Sebastes crameri taken off Washington (W4), Oregon (O10), and California (C5) (Gomez-Uchida and Banks 2005) to three clusters. Migration scenario 5% 10% 15% 20% 25% 50% 75% 95% Reference samples
Top
Middle
Bottom
1
2
3
1
2
3
1
2
3
0.96
0.02
0.02
0.05
0.91
0.04
0.02
0.02
0.96
1
2
3
1
2
3
1
2
3
0.90
0.02
0.08
0.07
0.84
0.09
0.08
0.02
0.90
1
2
3
1
2
3
1
2
3
0.84
0.13
0.03
0.16
0.72
0.12
0.12
0.04
0.84
1
2
3
1
2
3
1
2
3
0.78
0.15
0.07
0.21
0.61
0.18
0.20
0.06
0.74
1
2
3
1
2
3
1
2
3
0.72
0.07
0.21
0.19
0.61
0.20
0.20
0.08
0.72
1
2
3
1
2
3
1
2
3
0.60
0.26
0.14
0.23
0.51
0.26
0.17
0.60
0.23
1
2
3
1
2
3
1
2
3
0.31
0.35
0.34
0.33
0.33
0.34
0.35
0.32
0.33
1
2
3
1
2
3
1
2
3
0.34
0.32
0.34
0.33
0.34
0.33
0.33
0.34
0.32
W4
O10
C5
1
2
3
1
2
3
1
2
3
0.31
0.36
0.35
0.32
0.32
0.36
0.33
0.34
0.32
PA was obtained from average individual membership coefficients of each population or sample into each cluster using the software Structure version 2 (Pritchard et al. 2000). Migration scenarios indicate percentage of individuals exchanged to adjacent theoretical populations. Reference samples were enlarged to a size of n = 500 using Whichloci (Banks et al. 2003) to match theoretical population sizes.
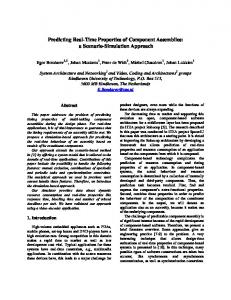
PA and FST The value of PA diminished rapidly as migration increased (Table 1). For the lowest level of migration (5%), PA of individuals to clusters was the highest (>95%) and cluster separation was clear with a few misclassified individuals (Fig. 2a). When gene flow was between 10% and 50%, PA varied between 90% and 51%, respectively (Table 1); here, between 10% and 49% of individuals were generally misclassified (Figs. 2b-2f). Informative PA was not attainable for simulations with 75% and 95% of gene flow (Table 1) showing poor cluster separation (Fig. 2g and 2h). The estimate of PA of darkblotched rockfish data from Gomez-Uchida
147
Biology, Assessment, and Management of North Pacific Rockfishes
C1
C1
(a)
C2
(b)
C1
C3
C2
(c)
C1
C3
C2
(e)
(d)
C2
C3
C1
C3
C2
C3
C1
(g)
C1
(h)
C3
C2
C3
(f)
C2
C1
C2
C1
(i)
C3
C2
C3
Figure 2. Diagram of population assignment (Pritchard et al. 2000) of three theoretical populations of Sebastes crameri (black, light gray, and dark gray) to three clusters (triangle’s vertices) in simulations with (a) 5%, (b) 10%, (c) 15%, (d) 20%, (e) 25%, (f) 50%, (g) 75%, and (h) 95% of stepping-stone migration. Description of the theoretical populations is found in Table 1. Diagram (i) was obtained using three reference samples off Washington (W4), Oregon (O10), and California (C5)(Gomez-Uchida and Banks 2005) after enlarging sample sizes using Whichloci (Banks et al. 2003) to match theoretical population sizes (500 individuals).
Gomez-Uchida and Banks—Relevance of Spatial Genetic Data
148
100% 90% 80% 70% PA
60% 50% 40% 30% 20% 10% 0% 0
0.01
0.02
0.03
0.04
0.05
0.06
0.07
FST
Figure 3. Plot of population assignment (PA) of individuals to their population of origin using model-based clustering (Pritchard et al. 2000) vs. FST (genetic distance) from theoretical populations of Sebastes crameri. The vertical dotted line indicates our criterion (FST = 0.007) to roughly separate informative and uninformative levels of genetic differentiation.
and Banks (2005) was similar to that obtained for the last two migration scenarios (Table 1, Fig. 2f). From the relationship between PA and FST, we found that when FST < 0.007, PA declined rapidly to uninformative levels (Fig. 3); the opposite trend was found when FST > 0.007.
Discussion We have demonstrated empirically through simulations that informative PA decreases rapidly when FST < 0.007; likewise, PA increases steadily when FST > 0.007. Adopting this criterion, it is possible to classify rockfishes according to their FST values from published and unpublished studies using microsatellites. For instance, bocaccio S. paucispinis (FST = –0.001; Matala et al. 2004a), grass rockfish S. rastrelliger (FST = 0.001; Buonaccorsi et al. 2004), shortraker rockfish S. borealis (FST = 0.001; Matala et al. 2004b), canary rockfish S. pinniger (FST = 0.001; GomezUchida and Banks 2006), and darkblotched rockfish S. crameri (FST = 0.002; Gomez-Uchida and Banks 2005) are located to the left of the reference, where spatially explicit management would be less critical; Pacific ocean perch S. alutus (FST = 0.015; Withler et al. 2001), black rockfish S. melanops (FST = 0.018; Miller et al. 2005), copper rockfish S. caurinus (FST = 0.036; Buonaccorsi et al. 2002), and brown rockfish S. auriculatus
Biology, Assessment, and Management of North Pacific Rockfishes
149
(FST = 0.056; Buonaccorsi et al. 2005), on the other hand, are positioned toward the right of this reference, where spatially explicit management would be more critical. While spatial management of cryptic species of vermillion rockfish S. miniatus (FST = 0.097; J.R. Hyde, Scripps Institution of Oceanography) and rougheye rockfish S. aleutianus (F ST = 0.301; Gharrett et al. 2005) is not an issue; they represent extreme examples of GD found in the complex. Failure to recognize their separate taxonomic status and geographic locations of putative hybridization zones might result in extirpation of local and unique genetic diversity. We have reached these conclusions by assuming that our simulations based on parameters for S. crameri could be extrapolated to other representatives of the rockfish complex. Many rockfishes have shown IBD patterns (e.g., Withler et al. 2001; Buonaccorsi et al. 2002, 2004, 2005), suggesting that SSMM might have general application. However, other input parameters such as Ne, number of populations and their biological attributes, number of selectively neutral loci, and sample sizes clearly limit the impact of our results. These caveats are discussed in detail in the following paragraphs. First, different estimates of Ne will generate a different set of mutation rates and will affect the amount of genetic drift in the population; bottlenecks, range expansions or selective sweeps described for particular species can therefore affect the outcome of our simulations. For instance, Buonaccorsi et al. (2004, 2005) have provided genetic evidence for bottlenecks in copper and brown rockfish populations from Puget Sound; our conclusions might then be appropriate to only the coastal segment of the geographic distribution of the aforementioned species. In addition, no other Ne estimates are available for rockfishes to our knowledge, which emphasize the increasing need for demographic genetics studies in rockfish conservation. Second, we assumed a fixed number of populations and ideal conditions within each one; this is necessary in order to reproduce the evolutionary process under specific settings. Ideal conditions are normally violated in real populations. For example, our results possess restricted value for species out of migration-drift-equilibrium, which might suggest a recent colonization event (e.g., Slatkin 1993). In nonequilibrium species, an estimate of population differentiation based on FST will be biased (Waples 1998). In these cases, the absolute allelic divergence rather than the proportion of variation among populations can be a better predictor (A.J. Gharrett, University of Alaska Fairbanks, pers. comm.). Third, Cornuet et al. (1999) described in a similar study that using Pritchard et al.’s (2000) Bayesian approach it is possible to attain 100% of PA using 10 microsatellite loci and 30-50 individuals per population when FST is approximately 0.1. Genetic studies in the genus Sebastes have commonly utilized between 5 and 12 microsatellite loci, so our
150
Gomez-Uchida and Banks—Relevance of Spatial Genetic Data
choice of 7 microsatellite loci falls within this range. Incorporating more loci none-the-less increases both the chance of successful PA (Cornuet et al. 1999) and the precision of FST estimates (Kalinowski 2002). In addition, these loci were assumed to be selectively neutral, and therefore provide limited insight into adaptive evolutionary processes of rockfish populations. In general, wide latitudinal ranges characterize the geographic distribution of rockfishes; many of them are found between the coasts of Alaska and California (Love et al. 2002), which may offer ample opportunities of local adaptation given contrasting oceanographic conditions. Fourth, how sample sizes might affect our analyses was overlooked in the present study and deserves further consideration in subsequent simulation experiments. In simple terms, the higher the FST, the smaller the required sample sizes to obtain precise estimates (Kalinowski 2005). Because we analyzed all population genotypes, the sampling bias would then be more pronounced within high gene flow scenarios (FST < 0.007). In conclusion, traditional (FST) and novel (PA) measures of population discrimination hold great promise to elucidate basic questions in conservation genetics, such as defining the empirical boundaries of the “population” concept (Waples and Gaggiotti 2006). Similarly, the goal of our study was to present a critical look at the management value of significant GD among populations within congeneric Sebastes species. Differences in their genetic structure should warrant different conservation strategies. Despite the analytical restrictions previously discussed, our criterion sought to identify which species are more likely to lose spatially unique genetic diversity represented by particular genotypes (which ultimately ensure informative PA) if local populations are extirpated.
Acknowledgments The authors are grateful for support from the Coastal Oregon Marine Experiment Station (COMES), Alaska Sea Grant, and scholarships from Hatfield Marine Science Center (Mamie Markham) and Department of Fisheries and Wildlife (DFW) at Oregon State University (H. Richard Carlson) granted to DG-U. Members of the Marine Fisheries Genetics Lab at COMES/DFW, Jessica A. Miller, Mark D. Camara, Anthony J. Gharrett, and three anonymous referees provided valuable criticisms on earlier versions of this manuscript.
Biology, Assessment, and Management of North Pacific Rockfishes
151
References Balloux, F. 2001. Easypop (version 1.7). A computer program for the simulation of population genetics. J. Hered. 92:301-302. Banks, M.A., and D.P. Jacobson. 2004. Which genetic markers and GSI methods are more appropriate for defining marine distribution and migration of salmon? North Pac. Anadromous Fish Comm. Tech. Note 5:39-42. Banks, M.A., W. Eichert, and J.B. Olsen. 2003. Which genetic loci have greater population assignment power? Bioinformatics 19:1436-1438. Banks, M.A., V.K. Rashbrook, M.J. Calavetta, C.A. Dean, and D. Hedgecock. 2000. Analysis of microsatellite DNA resolves genetic structure and diversity of chinook salmon (Oncorhynchus tshawytscha) in California’s Central Valley. Can. J. Fish. Aquat. Sci. 57:915-927. Berkeley, S.A., M.A. Hixon, R.J. Larson, and M.S. Love. 2004. Fisheries sustainability via protection of age structure and spatial distribution of fish populations. Fisheries 29:23-32. Buonaccorsi, V.P., C.A. Kimbrell, E.A. Lynn, and R.D. Vetter. 2002. Population structure of copper rockfish (Sebastes caurinus) reflects postglacial colonization and contemporary patterns of larval dispersal. Can. J. Fish. Aquat. Sci. 59:1374-1384. Buonaccorsi, V.P., M. Westerman, J. Stannard, C. Kimbrell, E. Lynn, and R.D. Vetter. 2004. Molecular genetic structure suggests limited larval dispersal in grass rockfish, Sebastes rastrelliger. Mar. Biol. 145:779-788. Carvalho, G.R., and L. Hauser. 1995. Molecular genetics and the stock concept in fisheries. In: G.R. Carvalho and T.J. Pitcher (eds.), Molecular genetics in fisheries. Chapman and Hall, London, pp. 55-79. Cornuet, J.M., S. Piry, G. Luikart, A. Estoup, and M. Solignac. 1999. New methods employing multilocus genotypes to select or exclude populations as origins of individuals. Genetics 153:1989-2000. Crow, J.F., and M. Kimura. 1970. An introduction to population genetic theory. Harper and Row, New York. Ewens, W.J. 1972. The sampling theory of selectively neutral alleles. Theor. Popul. Biol. 3:87-112. Falush, D., M. Stephens, and J.K. Pritchard. 2003. Inference of population structure using multilocus genotype data: Linked loci and correlated allele frequencies. Genetics 164:1567-1587. Gharrett, A.J., A.P. Matala, E.L. Peterson, A.K. Gray, Z.Z. Li, and J. Heifetz. 2005. Two genetically distinct forms of rougheye rockfish are different species. Trans. Am. Fish. Soc. 134:242-260. Gomez-Uchida, D., and M.A. Banks. 2005. Microsatellite analyses of spatial genetic structure in darkblotched rockfish Sebastes crameri: Is pooling samples safe? Can. J. Fish. Aquat. Sci. 62:1874-1886. Gomez-Uchida, D., and M.A. Banks. 2006. Estimation of effective population size for the long-lived darkblotched rockfish Sebastes crameri. J. Hered. 97:603-606.
152
Gomez-Uchida and Banks—Relevance of Spatial Genetic Data
Goudet, J. 1995. FSTAT (ver. 1.2): A computer program to calculate F-statistics. J. Hered. 86:485-486. Hedrick, P.W. 1999. Perspective: Highly variable loci and their interpretation in evolution and conservation. Evolution 53:313-318. Kalinowski, S.T. 2002. Evolutionary and statistical properties of three genetic distances. Mol. Ecol. 11:1263-1273. Kalinowski, S.T. 2005. Do polymorphic loci required large samples to estimate genetic distances? Heredity 94:33-36. Love, M.S., M.M. Yoklavich, and L. Thorsteinson. 2002. The rockfishes of the northeast Pacific. University of California Press, Los Angeles. 404 pp. Matala A. P., A.K. Gray, and A.J. Gharrett. 2004a. Microsatellite variation indicates population genetic structure of bocaccio. North Am. J. Fish. Manag. 24:1189-1202. Matala, A.P., A.K. Gray, J. Heifetz, and A.J. Gharrett. 2004b. Population structure of Alaskan shortraker rockfish, Sebastes borealis, inferred from microsatellite variation. Environ. Biol. Fishes 69:201-210. Miller, J.A., M.A. Banks, D. Gomez-Uchida, and A.L. Shanks. 2005. A comparison of population structure in black rockfish (Sebastes melanops) as determined with otolith microchemistry and microsatellite DNA. Can. J. Fish. Aquat. Sci. 62:2188-2198. Nei, M. 1987. Molecular evolutionary genetics. Columbia University Press, New York. Parker S.J., S.A. Berkeley, J.T. Golden, D.R. Gunderson, J. Heifetz, M.A. Hixon, R. Larson, B.M. Leaman, M.S. Love, J.A. Musick, V.M. O’Connell, S. Ralston, H.J. Weeks, and M.M. Yoklavich. 2000. Management of Pacific rockfish. Fisheries 25:22-29. Pritchard, J.K., M. Stephens, and P. Donnelly. 2000. Inference of population structure using multilocus genotype data. Genetics 155:945-959. Slatkin, M. 1993. Isolation by distance in equilibrium and non-equilibrium populations. Evolution 47:264-279. Waples, R.S. 1998. Separating the wheat from the chaff: Patterns of genetic differentiation in high gene flow species. J. Hered. 89:438-450. Waples, R.S., and O. Gaggiotti. 2006. What is a population? An empirical evaluation of some genetic methods for identifying the number of gene pools and their degree of connectivity. Mol. Ecol. 15:1419-1439. Weir, B.S., and C.C. Cockerham. 1984. Estimating F-statistics for the analysis of population structure. Evolution 38:1358-1370. Withler, R.E., T.D. Beacham, A.D. Schulze, L.J. Richards, and K.M. Miller. 2001. Co-existing populations of Pacific ocean perch, Sebastes alutus, in Queen Charlotte Sound, British Columbia. Mar. Biol. 139:1-12. Wright, S. 1931. Evolution in mendelian populations. Genetics 16:114-138.