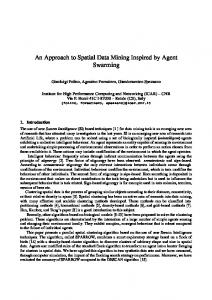
A Spatial Entropy-based Approach to Improve Mobile Risk-Based Authentication Jeffrey Xiong
*1
Computer Science, Rice Univ Houston, TX, USA
[email protected]
John Xiong
Christophe Claramunt
Identity Management, 3M Pasadena, CA, USA
[email protected]
Naval Academy Research Institute Lanvéoc-Poulmic, France
[email protected]
ABSTRACT
1. INTRODUCTION
The research presented in this paper develops a novel approach for a risk-based authentication system that takes into account mobile user movement patterns. Inspired by the concept of Shannon’s information theory, we introduce a variant version of spatial entropy vectors embedded with time information as a mathematical modeling tool to evaluate regular movement patterns, and spatial entropy vectors derived from user movements range and paces. To support the approach, several algorithms have been designed and implemented. A prototype iPhone application was developed as a proof-of-concept, user movement data has been collected over a predetermined timeframe by accumulating, merging, and saving spatial entropy vectors in a database on the application. The application simulates risk-based authentication by calculating risk factors based on the similarity between current spatial entropy vectors calculated on demand, and historical distributions of movement patterns. Data collected on the field shows that the risk factor is relatively low for similar moving patterns, while different patterns can yield a higher risk factor. Rather than modeling this process by directly storing GPS location data with complicated pathmatching algorithms, the spatial entropy model developed uses sampled location data, but does not keep it, preserving user privacy. Practical applications can be used, for example, to adjust fingerprint authentication threshold in iPhone when combining with the risk factor calculated in real time.
Smartphones have changed the way everyday communications and interactions work [13]. While increased information access and availability has tremendous benefits for both businesses and users, many enterprises are challenged by how to enforce mobile security. Users may be inconvenienced by multi-level mobile access controls, even in low-risk contexts (e.g., exacerbated by difficulties to input complicated credentials), while loose levels of security may be inadequate. It is then more challenging to provide mobile security solutions. The mobility, strong personalization, strong connectivity, and reduced capabilities of phones must be taken into account in order to appropriately deal with mobile security [11]. As a result, providing information in the modern world necessitates innovative means of authentication that balance convenience and security to protect against aggressive and sophisticated attacks in new channels. The most common way to improve authentication technologies involves making traditional methods more secure, such as requiring more complicated password combinations, or higher fingerprint or facial matching thresholds. However, user convenience is significantly impaired by these methods [14, 16]. In mobile security, we can measure and make use of various risk factors to improve authentication and convenience. As unique and constant motion is a characteristic for regular patterns of most mobile devices and users, variations in typical user location and motion patterns can be a relevant indicator of security context and risk. The challenge is how to identify those factors and model them to measure location-based risk on mobile devices effectively. Risk-based authentication is an emerging technology that is useful in enterprise security solutions [5]. It algorithmically evaluates the risk of the situation, based upon preidentified risk factors, and determines the level of security needed. A risk engine is a self-learning analytics tool that tracks and evaluates multiple risk factors in real-time, and can be built into the authentication system or operating system. User behavior related information, such as language settings, input keyboard, IP address, and recent authentication activities can all be used for risk factor calculation. If new authentication attempts are similar enough to previous ones, the risk engine will assign a low risk threshold based upon the context. While many risk factors have been identified and applied to this authentication technology, and to the best of our knowledge, no prior research has been done using physical location and moving patterns as a risk factor in mobile security. This paper introduces a spatial-entropy approach whose objective is to analyze and track user movement in a given region where such users are regularly behaving in order to evaluate risk authentication. A measure of spatial entropy quantitatively evaluates user movements, while preserving user privacy. A series of algorithms has been developed, implemented and evaluated on top of a mobile prototype application. The rest of the paper is organized as follows. Section 2 introduces the modeling background behind the concept of spatial entropy, while section 3 describes the design, methods and algorithms developed. Section 4 presents and discusses the results. Finally Section 5 concludes the paper and outlines further work.
Categories and Subject Descriptors D.2.0 [Software Engineering]: General – Protection mechanisms; H.2.8 [Database Management]: Database Applications – Spatial databases and GIS
General Terms Algorithms, Security.
Keywords Mobile security; Shannon’s information theory; spatial entropy; multi-factor authentication; risk-based authentication
Permission to make digital or hard copies of all or part of this work for personal or classroom use is granted without fee provided that copies are not made or distributed for profit or commercial advantage and that copies bear this notice and the full citation on the first page. Copyrights for components of this work owned by others than ACM must be honored. Abstracting with credit is permitted. To copy otherwise, or republish, to post on servers or to redistribute to lists, requires prior specific permission and/or a fee. Request permissions from
[email protected]. GeoPrivacy'14, November 04-07 2014, Dallas/Fort Worth, TX, USA Copyright 2014 ACM 978-1-4503-3134-0/14/11…$15.00 http://dx.doi.org/10.1145/2675682.2676400
2. MODELLING BACKGROUND 2.1 Information theory and entropy Let us introduce some of the principles of the information theory and entropy that provided the background of the mathematical model developed in this research. As detailed in Claude Shannon’s seminal work “A Mathematical Theory of Communication” [17], information theory primarily deals with the transmission of information. The information content of a message can be defined as the amount of unexpected data contained in the transmission and its quantification, entropy; it is defined in Equation 1.
= −
log ( ) (1)
Here, pi is defined as the proportion of entities of a given class i over the total number of entities, n the number of classes, and K is a positive constant. Entropy can be used to model the average unpredictability of a random variable. For example, a single fair toss of a coin has an entropy of one bit because both outcomes are equally uncertain; a toss of an unfair coin has less entropy, as one outcome is more heavily favored. Because of this, entropy and the ideas from information theory have been widely applied to many fields such as economics, geographic and ecological studies.
[4] is very close to meeting this criterion, and thus adapted as our modeling base. This concept of spatial entropy is based on Tobler’s First Law of Geography, which states that “everything is related everything else, but near things are more related than distant things” [10], and takes into account the important role of distance in a two-dimensional space within the bounds of Shannon’s original entropy equation as introduced in equation (1). The key idea behind the measure of spatial entropy is that diversity should augment when the distance between different entities decreases, as diversity also should augment when the distance between similar entities increases. These assumptions are converted ) and the into two measures of distances (4): the internal distance ( external distance ( ) that reflect the distance-based relationship between entities of a given class, and between entities of different classes, respectively. These measures of internal distances are valued as defined in equations (2) and (3), respectively:
=
=
Modeling Mobile User Movement Patterns We face two challenges to model mobile user movement patterns and to measure their unpredictability. The first challenge is to find key factors and abstract them as input parameters to the model. We have to make two assumptions for routine mobile users: •
User movement is limited to a certain similar or repeatable geographic area with a stable and definable boundary.
•
Within a set timeframe (an interval of one or two hours, or calculated by modeling method), users will have very similar moving distance and speed.
Each mobile user will exhibit different activities within their respective boundaries, and thus if compared simultaneously, should reveal different patterns. The following are the most important factors that must be considered: •
Positional data sets: although they are not stored, GPS location data will be used in the model for calculation
•
Distance or range: the overall distance and the distance within each timeframe
•
Time: the dynamic variable of the modeling approach
The second challenge is to build or find a mathematical model that can use those factors as an input, and: •
Can output high similarity values when the same mobile user repeats their routine motion pattern within the same time period
•
Can detect and calculate the dissimilarity when a user using the same mobile device diverts their routine pattern locally in a single or several time periods
1
×(
1
− 1)
∈
,
if
∈
%
− 1)
∈
> 1 (2)
∉
,
if
≠
(3)
where C j denotes the set of entities of a given class j, N j the cardinality of C j , N the total number of entities, di,j the distance between two entities i and j. The ratio of these two distances replaces the coefficient K of equation (1) to measure the respective weight of the internal and external distances. The spatial entropy is then given as [4]: )
= −
*
+
log (
) (4)
Every entity considered in this modelling approach is considered as a static object, while a class is a collection of such entities, so that they cannot be used in our context directly, as the mobile users considered, as well as their evolving locations are rather dynamic. This initial measure of spatial entropy has been adapted to segment time into different clusters, and each GPS location data sampled is defined as one evolving entity. So in different timeframes of a day, the entropy will be calculated. Therefore, the mobile user’s motion activity will be recorded as an array of entropy vectors < ℎ , ℎ , ℎ/ , … , ℎ >, and thus this sequence embeds the dynamic time information as well. The main assumptions made by our modelling approach are as follows: •
Position and then distance information are considered as input parameters and used in equations (2), (3) and (4). The internal distance (Dint) models the distance and scope derived from the movements of a given mobile user, while the external distance (Dext) models the maximum distance and scope covered by this mobile user under a considered timeframe. An important property of this modelling approach is that the physical location data are not saved, and thus cannot be reverted from the saved entropy array (preserving privacy).
•
Time information is incorporated by the sequence of entropies and embedded within the vector.
Spatial Entropy Modeling Intensive research and investigation was done in order to build a suitable mathematical model that tackles the two aforementioned challenges. The concept and measure of spatial entropy introduced in
×(
•
The spatial entropy array embeds the “compressibility” or “unpredictability” of motion information distribution (location, range, and pace) over time.
Spatial Entropy Modeling by Example An example of the implication of the measures of spatial entropy as defined in equations (2), (3) and (4) is shown in Figures 1 to 4. The diagrams represent three different mobile users with different movement patterns in three segmented timeframes. Each dot can be thought of as a location sampled by a GPS. The coordinates are used to compute distance, but not saved. Spatial entropy vectors are generated for each user, and their distribution shown in Figure 4. •
Figure 1: small overall boundary (Dext), with low speed in each timeframe (Dint). A blue circle shows the internal distance boundary while a red dot represents the sampling point inside the boundary.
•
Figure 2: large overall boundary (Dext), with low speed in each timeframe (Dint)
•
Figure 3: small overall boundary (Dext), with high speed in each timeframe (Dint)
given by the case of Figure 3, which exhibits a relatively higher value of Dint and small value of Dext. Conversely, the lower value of spatial entropy is given by Figure 2 with a relatively high value of Dext and lower value of Dint. This shows that these measures of spatial entropy can differentiate changes in movement patterns and/or different boundaries.
Entropy Value
Figure 3: H3 =
Figure 1: H1 =
0,18 0,16 0,14 0,12 0,1 0,08 0,06 0,04 0,02 0
1
2
3
H1
0,0333
0,0684
0,1016
H2
0,0162
0,0336
0,0503
H3
0,0495
0,1017
0,1535
Figure 4: Spatial entropy distributions
3. MODELING DESIGN & ALGORITHMS In order to prove the feasibility of the concept, the entropy model needed to be implemented and applied in a prototype mobile application, referred to as App. The tasks included designing a risk engine workflow and several algorithms that support the derivation of the measures identified, and developing an iPhone App for real time data collection and testing.
Risk Engine and Algorithm
Figure 2: H2 = As illustrated by these figures, there is a clear difference in the distribution of spatial entropy. The highest value of spatial entropy is
The App’s workflow is as follows: the risk engine continuously samples and computes spatial entropy in designed timeframes and saves it as historic distributions. For more accuracy, the distribution is merged every day as a learning process. When the risk factor is requested, real-time similarity is calculated based upon the current timeframe, current spatial entropy vector, and historical spatial entropy distribution vector. In order to apply the measure of spatial entropy as a factor within risk-based authentication, a risk engine needs to be designed to
calculate the current risk factor when an authentication request is sent. The authentication system can then prompt corresponding ways to verify users. The best place to implement the risk engine would be in the operating system itself. Because the OS is the Trusted Computing Base (TCB), it can supply risk evaluation requests to all mobile applications. In this research, risk engine can only be simulated inside the prototype App in application layer as iOS change or extension can only be done by Apple. Figure 5 illustrates the workflow showing the algorithmic procedure of the risk engine.
);
will be compared against < M , M , M/ , … , M< > using Algorithm 3 to get the maximum cosine similarity If the similarity is close enough, q will be merged into h with increased frequency weight. Otherwise, q will be started as a possible new historical vector in the DB with frequency set to 1
Figure 5: An illustration of the risk engine’s workflow. Data is collected over time, and merged in the entropy vector database, so real-time data can be compared to the data in the database to determine risk threshold. Based upon this workflow, there are three major components that need to be implemented, which are accomplished using three algorithms. The first algorithm is the Spatial Entropy Calculation Algorithm that partitions data temporally collected and returns an array of calculated spatial entropy vectors as defined in equation (4). Algorithm 1: Spatial Entropy Vector Calculation pseudo-code
The learning and merging procedures implemented in this project were simplified versions and did not take into account the multiple moving patterns in different days, which would need to keep track of several entropy vectors and may have to merge into different vector serials. The third algorithm developed is the Cumulative Learning and Merging one. It accumulates captured entropy vectors and merges them into an entropy vector EVDB. Algorithm 3: Cumulative Learning and Merging procedure
Input Parameters: array 123,4,56 for captured time and location data
JJJJJK I = < ℎ , ℎ , ℎ/ , … , ℎ > is the historical entropy distribution in EVDB.
Initialization
Entropy serials were calculated in real-time when requested during authentication, and can be represented as:
Output: spatial entropy vector < ℎ , ℎ , ℎ/ , … , ℎ >
Segment array 123,4,56 into 17 , 18 , 19 , … , 1: , where each has entity of , , / , … , for j= 1 to n
JJJJJK L I = < M , M , M/ , … , M< > OℎPQP R S T
Risk factor UV can be calculated based on the cosine similarity:
JJJJJK JJJJJK I ∙ LI =
for i= 1 to for k = i+1 to );