A Structured Approach for Function Based Decomposition of Complex Multi-disciplinary Systems Felician Campean, Edwin Henshall, Unal Yildirim, Amad Uddin, and Huw Williams University of Bradford, EDT3 Ford Suite, Bradford, BD7 1DP, UK
[email protected]
Abstract. The aim of this paper is to introduce the Systems State Flow Diagram as a structured approach to high level solution-independent function based decomposition of a complex multi-disciplinary system. The approach is discussed in the context of existing function modelling frameworks and in relation to current practice in industry. A generic case study is used to introduce the approach and to highlight the salient features, followed by an illustration on its application to the analysis of an electric vehicle powertrain. Experience with the practical application of the approach with engineering teams is discussed. Keywords: Systems engineering, function decomposition, system state, function flows, product development.
1
Introduction
The complexity of automotive systems has increased dramatically over the past couple of decades driven by the accelerated pace of innovation and introduction of new technologies to enhance customer satisfaction and to mitigate environmental and safety concerns in a highly competitive marketplace. This escalation in complexity has brought significant technical challenges, compounded by the increase in sophistication of the control systems employed to manage the integration of the new technologies within the system. Managing multi-disciplinary system integration is recognized as being a very difficult task [1-3], which is not well supported by the existing frameworks and tools for function decomposition of complex systems [1]. The particular difficulty with the analysis of multi-disciplinary (i.e. electro-mechanical, electronic, control, software) complex systems is that system to system interactions are very difficult to assess or predict early in the systems engineering design process. Observation of current systems engineering design practice in industry has highlighted the prevalence of a structural based decomposition of systems, generally underpinned by clustering analysis on a design structure matrix (DSM) [4-5]. Allocation of design responsibilities to engineering design teams mirrors the system decomposition, which means that design teams have responsibility for design units or chunks, and not for functions, which often means that “system integration” functions are left to chance. For illustration, taking the example of an exhaust system (based on
M. Abramovici and R. Stark (Eds.): Smart Product Engineering, LNPE, pp. 113–123. DOI: 10.1007/978-3-642-30817-8_12 © Springer-Verlag Berlin Heidelberg 2013
114
F. Campean et al.
the authors’ observations across a number of OEMs), the design responsibility is typically split between 4 teams on the basis of the disciplinary grouping of the subsystems involved: exhaust pipework, after treatment components, sensors, and control software. There is no overall responsibility for the integration of the system on the basis of its main function (to transport and condition exhaust gas), which is ultimately the root cause for common field issues, e.g. associated with the regeneration of the exhaust particulate traps (a well-known cross-industry issue). This illustrates that the conventional approach of structure - function decomposition works well for the integration of reasonably small electro-mechanical systems, but it does not provide a good approach for complex mechatronic systems, which is a conclusion similar to literature findings [1-2]. The aim of this paper is to introduce the Systems State Flow Diagram (SSFD) as a simple but effective tool to support the high level analysis and function based decomposition of a complex system. The method will be explained with a generic case study, followed by an illustration of an industry-based example of an electric vehicle powertrain, and a discussion of the experience with the application of the method on a broader basis for complex automotive systems. The organization of the paper is as follows: section 2 gives an overview of common methods for functional decomposition of complex systems; section 3 outlines the proposed method, followed by discussion and conclusions in section 4.
2
Overview of Function Modeling Approaches
The function of an engineered system is commonly defined in relation to the transformation of the inputs to the outputs; the inputs and outputs are usually considered in terms of types of energy (E), material (M) and information (I) [6-7]. Design decomposition is based on mapping the flows of energy, material and information through the system [7]; sub-functions are defined as successive operations on flows, with output from one sub-function providing the input to the next. Several graphical diagrammatic representations have been developed to visualize the system’s functional structure and to facilitate the analysis by teams of engineers, e.g. Function Trees, System Block Diagrams, System Boundary Diagrams, Function Flow Block Diagram, FAST Diagrams, Integrated Definition for Function Modeling (IDEF0) [8-9]. The description of the function commonly follows a verb – noun structure [9]. The “functional basis” approach by Stone and Wood [10] provides a consistent framework including a taxonomy for functions and a coherent representation of the overall function in terms of interconnected sub-functions, defined as operations on flows (of E, M, I). Design development is carried out through successive decompositions of functions and sub-functions into lower level sub-functions. This is usually done iteratively within the design synthesis, i.e. an iterative decomposition in the functional and the design solution domains, referred to as zigzagging in the context of axiomatic design [11]. At any level, system integration is supported through interface analysis, facilitated by a design structure matrix (DSM) type approach [4-5], which aims to identify
A Structured Approach for Function Based Decomposition
115
the relationships or linkages [12] between components. Clustering analysis on the DSM is used to group components into structure-function units [4]. Several other methods for defining functions have been proposed (see for example [13] for a review), aiming to support different phases of the design process, in particular by enhancing the understanding of the relationship between function (defined in relation to the utility to the user or customer) and the intended behavior and structure of the system. The Function – Behavior – State (FBS) [14] framework suggests that functions are defined in relation to states of the structures (design objects), which are represented by entities, their attributes, and relations between entities. Within FBS the functions are defined by the combination of verb-object which relate to the designer intentions, and behaviors expressed through adjectives, which can instantiate the function, thus embedding the time dimension into the function definition. While providing a strong framework for functional modeling which lends itself to useful software implementation and automation, the FBS framework has been found rather difficult to implement in engineering practice [15]. The Object-Attribute-Function framework [16] proposes a similar approach, with the input and output defined as generic objects thought of as tangible entities that have attributes (such as mass), or information (expressed as signals that can be detected). Within the OAF framework, the input and output objects are described by their measurable attributes, with a clear taxonomy developed to describe both. A generic issue with all frameworks is that they do not support the high level functional analysis / decomposition of a complex system in a solution independent manner. At any level, decomposition tends to be based on brainstorming, i.e. by asking the question “how is this function achieved”. The Contact and Channel (CC) framework [17-18] addresses this issue by providing a coherent structure for functional decomposition based on identification of working surface pairs (WSPs) at the system input and output, as well as the channel that connects the WSPs within the engineered system. A working surface is described in terms of a state characterized by measurable attributes, and the system function defined as “transfer of one state into another” [19]. The functional decomposition is carried out by defining surface pairs with the channel, which correspond to design subsystems. While this framework is structured and powerful, it uses a taxonomy which is not always conducive to the analysis of multidisciplinary systems (e.g. control or software systems engineers are unlikely to adopt the language of working surface pairs).
3
System State Flow Diagram
A review of current frameworks for function modeling pointed out the need for a more structured tool to support high level solution-independent function analysis and decomposition for complex multi-disciplinary systems. Analysis of current methods and practices in industry, discussed in [20], has also highlighted the need for a structured tool to address the heavy reliance on less structured approaches (largely based on brainstorming) in carrying out practical function decomposition analysis. The requirements for such a tool can be summarized as follows:
116
F. Campean et al.
• To be integrated with other tools commonly used in industry – such as Boundary Diagrams and Interface Matrices [8], to encourage broad take-up of the tool; • To have a graphical (diagram based) representation to facilitate the development of shared mental models [21] within the engineering team carrying out the analysis; • To be portable across disciplines (electro-mechanical, control and software) and domains (design / process); • To promote axiomatic design principles of domain separation and primacy of function and solution-neutral thinking in systems engineering design analysis. The System State Flow Diagram (SSFD) was first outlined in [22], and further discussed in [20] with a comprehensive example of application to the analysis of an electric vehicle powertrain. The SSFD has been further applied to the analysis of automotive systems, giving a rich experience and feedback from many teams of engineers. This paper will explain the principle of the approach on the basis of a generic example – design analysis of a generic Bread Toasting System (BTS), followed by an illustration of the application in an industry based context. 3.1
Principles of a State Flow Diagram
Block Diagrams are commonly used to represent an engineered system. At high level, a system (conceptually thought of in terms of its function and physical structure / design solution) is represented as a black box, showing the inputs and the outputs to the system, as shown in Figure 1. Coherent with FBS [14] and OAF [16] function modeling frameworks, the input and the output can be thought of as generic objects described by a set of measurable attributes. For the BTS example, the sliced bread (input) and toast (output) can be thought of as objects characterized by physical and chemical attributes (e.g. density, humidity, porosity) and geometry (e.g. thickness). As discussed, a generic system function definition is “the transferring of one state into another” [19]. The SSFD embeds this definition of the system function in a graphical representation, shown in Figure 2. The SSFD follows the general principles of state diagrams (such as state transition diagram or reliability state diagram [23]), in that by convention the boxes denote the states of the objects and the arrows denote the functions required to achieve the transfer from one state to another. The important feature of this representation is that it divorces the consideration of function from the consideration of the design solution. In the SSFD framework the functions can be thought and articulated purely in terms of transformation between states of objects, as
Fig. 1. BTS System Block Diagram
Fig. 2. BTS High level SSFD
A Structured Approach for Function Based Decomposition
117
described by their observable and measurable attributes. So the function of the BTS to “toast bread” can be more clearly expressed as “transform bread into toast”, which can be defined and assessed in terms of the change in the physical (e.g. humidity, density, thickness, weight), chemical (e.g. oxidation) and geometrical attributes. 3.2
Function Decomposition Based on State Flow Diagram
The function decomposition using the SSFD is based on identifying intermediate states between the input state and the output state. The definition of the intermediate states should follow the same logic and structure as the one used for the input and output; i.e. consistent with the OAF framework, we need to think of observable states characterized by the measurable attributes of the objects they relate to. The SSFD maps the flow of the states through the system and the functions required to achieve the transitions between the states. Figure 3 illustrates the development of the SSFD for the BTS system, showing only the main flow through the system, which in this case is that of bread. The functions defined can be mapped in terms of the object attribute changes required to transition between states. For example: • “F1 – load bread” and “F3 – remove toast” are associated with changes in the attributes relating to spatial location and orientation; • “F2 – Toast Bread” relates to the change in physical and chemical attributes of the bread when it is converted into toast.
Fig. 3. SSFD for the Main Flow in BTS
The box around the system defines the “system boundary”, i.e. the limits of the scope for responsibility for the design team. Once the main flow is depicted, the engineering design analysis and synthesis can be carried out to identify the best way in which the functions can be delivered through the engineered system. Based on the understanding of the science of toasting, the “working principle” of a BTS can summarized as “reduce bread moisture content and oxidize the surface of the bread”. The BTS engineering design task associated with function F2 is to find a way of delivering the function; in this case this relates to the delivery of heat energy from a given source to the “Bread retained in BTS”. Figure 4 shows an updated SSFD which maps the energy states flow through the BTS system. This shows an “Energy Source” as another input to the system, an intermediate state of “Heat”, and a function F4 to “Convert Energy into Heat”. Given that the SSFD delivered a solution independent analysis, the BTS engineer has the freedom to consider a variety of sources of energy (electrical, gas, chemical, sunlight), and a range of design concepts as ways of converting
118
F. Campean et al.
this energy into heat to achieve the F2- “toast bread” function. Therefore, the attributes of the 2 new states shown in Figure 4 (i.e. “Energy Source” and “Heat”) cannot be fully defined until technology and system design decisions have been made. Function F2 – “Toast Bread” is achieved directly by “Applying Heat to the Bread retained in the BTS”, i.e. heat will change the physical and chemical attributes of bread, transforming it into toast. In general, coherent with the OAF framework, an engineered function is completely defined in terms of the triad of (1) input object state, (2) output object state and (3) transforming energy or process. The functional decomposition is complete when functions are fully defined, i.e. specified in terms of the triad defined above, typically requiring several function decomposition iterations.
Fig. 4. SSFD for the Bread Toasting System (BTS)
The key feature of the functional representation in Figure 4 is that it is fully in the functional domain and solution-independent. As such, the SSFD in Figure 4 could provide an adequate representation for a range of BTS designs, e.g. a common household electric bread toaster (which holds the bread in a case), a hotel type bread toaster which uses a conveyor belt, or an ecological bread toaster where focused sunlight heat is used to toast the bread. The SSFD diagram in Figure 4 could equally represent a process of toasting bread under a gas grill or over a barbeque, if all the transportation functions on the main flow are performed by the user. From this SSFD representation we can directly extract a high level BTS Function Tree, Figure 5. This has been derived from a structured decomposition of the system in a solution neutral way, and not based on directed brainstorming (How-Why) which is the typical approach in practice [9].
Fig. 5. High Level Function Tree for the BTS
A Structured Approach for Function Based Decomposition
3.3
119
Design Analysis of System Control Features Using SSFD
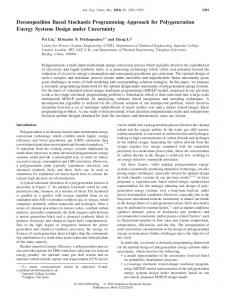
Most modern systems are required to have a control system in place to support the robust achievement of the consumer requirements. Consumer requirements are generally directed at the attributes of the output object state. For example, the “browning” level of the toast is a critical attribute that can be related to the customer requirement of “consistent good toast”. The browning level as an attribute of the output state, depends on the attributes of the input state and the functions (transformations) in the system. Figure 6 illustrates an attribute transformation matrix for the BTS system that supports the identification of the functions which can influence the browning level of bread. As discussed, functions F1 and F3 are associated with a change in the location and orientation attributes, and do not affect the browning level. However, the input state (in terms of the physical and chemical properties of the bread – such as moisture content, density, structure, chemical composition), and function F2 (in terms of the heat rate and overall heat exchanged) have a clear influence onto the browning level. The designer has little control over the attributes of the input state (arbitrary choice by the user), hence the control strategy must be directed at function F2, i.e. control the heat rate and the overall heat applied to the bread. The way in which a control feature is designed and implemented depends on the design solution adopted and the required level of control. For example, on a common domestic toaster the heat control can be based on time or heat rate setting, whereas for a hotel type bread toasting system the control is based on the belt speed and / or heat rate settings. The BTS control system
Critical output state attribute Browning level
Input State X
F1: Load Bread in BTS
F2: Apply Heat to Bread in BTS X
Fig. 6. Attribute Transformation Matrix
Fig. 7. SSFD for a BTS with Control System
F3: Remove Toast
120
F. Campean et al.
can be manual (i.e. adjusted by the user), or automated if based on in process measurements (e.g. sensing the “browning” level). For illustration, Figure 7 shows a SSFD “customized” for a common household electric bread toaster, showing two options of control system. The function “Convert energy into heat” has been further decomposed into “F4: Control supply of EE ” and “F5: Convert EE into Heat”, reflecting the design choices made – i.e. to use mains electrical energy (EE) as energy source, which is converted into radiated heat (applied to the bread, function F2) through a heat converter. The design elements that achieve functions F4 and F5 (i.e. the switched connector and the heat converter) have also been indicated on the SSFD. Figure 7 illustrates 2 control strategies: (1) Manual control based on timing, where the user selected setting for the browning level is converted to a timing control signal (F6.1), which controls the switch connector (F6.2); (2) Automatic control, based on sensing the toast browning level (F7.1), the conversion of the sensed browning level into a control signal (F7.2), which controls the switch connector (F7.3). It is important to note that the control functions are still solution independent; e.g. sensing the toast browning level can be achieved in a number of different ways which can be considered by the design engineers. Fundamentally, the only design decisions that have been made relate to the use of mains electric energy to power the BTS. The function tree can be updated to include the control functions derived from the SSFD, as sub-functions to “convert energy into heat” function on the high level BTS function tree shown in Figure 5. 3.4
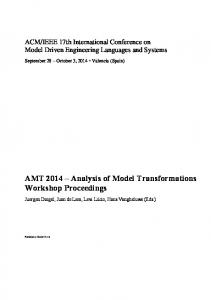
SSFD Illustration for an Electric Vehicle Powertrain System
Figure 8 illustrates the application of the SSFD to the analysis of an electric vehicle powertrain (EVP) for a small truck application [20]. In an EVP system there are 3 main flows, i.e. (i) to charge and store energy; (ii) to deliver controlled torque to the rear axle; (iii) to provide power for vehicle consumer units. The SSFD analysis shown in Figure 8 integrates these 3 flows into a compact functional representation of the
Fig. 8. SSFD for an Electric Vehicle Powertrain
A Structured Approach for Function Based Decomposition
121
EVP system. This analysis was conducted by a multi-disciplinary team of engineers, and used to define the functional breakdown of the system and the allocation of associated design responsibilities on a functional basis. The subsequent analysis of the functional integration of the EVP system, at the system level, was developed through an enhanced interface analysis, described in [20].
4
Discussion and Conclusions
The main aim of this paper was to introduce the Systems State Flow Diagram as a structured approach to high level solution-independent function based decomposition of a complex multi-disciplinary system. The review of current frameworks and tools for functional modelling as well as the discussion of current industrial practice pointed out the need for the development of such a tool. The SSFD draws on the FBS and OAF frameworks for function modelling, and introduces a state transition based graphical representation, which is intuitive to use, yet powerful in terms of maintaining the discipline of solution-independent thinking in the analysis of system decomposition on a function basis. The reasoning structure underpinning SSFD is similar in principle with the Contact and Channel framework [17-19], but it has the advantage that it offers a more straightforward graphical representation, it is more portable across multiple engineering disciplines (including mechatronics and control systems), and easier to integrate with other tools commonly used in industrial practice. The Bread Toasting System case study illustrated the development of the SSFD and showed that the requirements outlined in section 3 are met. The integration with other tools was illustrated in terms of the development of the Function Tree (Figure 5) – which is a common basis for engineering design deployment and analysis. The broader integration with other engineering tools (including interface analysis and Failure Modes and Effects Analysis) was discussed in [20]. The SSFD provides a system representation that is easy to understand, thus supporting the achievement within an engineering team of a common understanding of the functional decomposition of the system in a fundamental, solution independent way. Figure 7 clearly illustrates the ability of the SSFD to support multi-disciplinary analysis, by showing that control features can be accommodated in a seamless way within a SSFD. The SSFD has been rolled out with two major automotive OEMs, and feedback from the engineering teams has been extremely positive, in that it is a clear and easy to use tool, supporting a thorough and objective analysis of the system. It supports a better understanding of the functions that need to be delivered by the engineered system, and the way in which engineering design tasks can be allocated to teams to ensure a better integration of the system, focused on the customer required functions. A strong feature of the SSFD is that it improves communication between disciplines in the sense that it is a tool that can be equally used by engine component design engineers and engine calibration engineers, responsible for control feature development. The SSFD can be applied at all levels of the systems engineering cascade, and promotes a seamless integration between product and process engineering design on the basis that the SSFD is a similar representation to a process flow map.
122
F. Campean et al.
The authors’ experience of using the SSFD discussed in this paper has been mainly in conjunction with complex automotive systems. However, the SSFD framework and tool can be applied to any complex system.
References 1. Van Beek, T.J., Tomiyama, T.: Requirements for Complex Systems Modeling. In: The 18th CIRP Design Conference – Design Synthesis (2008) 2. D’Ameilo, V., Chmarra, M., Tomiyama, T.: Early design interference detection based on qualitative physics. Res. Eng. Design 22, 223–243 (2011) 3. Lindemann, U., Maurer, M.: Facing Multi-Domain Complexity in Product Development. In: Proc. 17th CIRP Design Conference. Springer, Berlin (2007) 4. Pimmler, T.U., Eppinger, S.D.: Integration analysis of product decompositions. In: ASME Design Theory and Methodology Conference, Minneapolis (September 1994) 5. Browning, T.: Applying the Design Structure Matrix to System Decomposition and Integration Problems: A Review and New Directions. IEEE Transactions on Engineering Management 48(3), 292–306 (2001) 6. Pahl, P., Beitz, W., Feldusen, J., Grote, K.H.: Engineering Design: A systematic approach, 3rd edn. Springer (2007) 7. Ulrich, K.T., Eppinger, S.D.: Product design and development, 3rd edn. McGrawHill/Irwin, New York (2003) 8. Webb, R.D.: Investigation into the application of robustness and reliability tools to the design process. MSc thesis, University of Bradford (2002) 9. Otto, K., Wood, K.: Product design: Techniques in reverse engineering and new product development. Prentice Hall, New Jersey (2001) 10. Stone, R.B., Wood, K.L.: Development of a Functional Basis for design. Journal of Mechanical Design 122, 359–370 (2000) 11. Suh, N.P.: The principles of design. Oxford University Press, New York (1990) 12. Jarratt, T.A.W.: A model-based approach to support the management of engineering change. PhD thesis, University of Cambridge (2004) 13. Srinivasan, V., Chakrabarti, A., Lindemann, U.: A Framework for Describing Functions in Design. In: Proc. 12th Int. Design Conference DESIGN 2012, Dubrovnik, pp. 1111–1122 (2012) 14. Umeda, Y., Tomiyama, T.: Functional Reasoning in Design. IEEE Expert: Intelligent Systems and their Applications 12, 275–288 (1997) 15. Van Beek, T.J., Tomiyama, T.: Integrating Conventional System Views with FunctionBehaviour-State Modelling. In: The 19th CIRP Design Conference – Design Synthesis (2009) 16. Sickafus, E.N.: Unified Structured Inventive Thinking: How to Invent. Michigan (1997) 17. Albers, A., Ohmer, M., Eckert, C.: Engineering design in a different way: cognitive perspective on the contact and channel model approach. In: Visual and Spatial Reasoning in Design, July 22-23, 2003. University of Sydney, Cambridge (2004) 18. Albers, A., Braun, A., Clarkson, P.J., Enkler, H.-J., Wynn, D.: Contact and channel modelling to support early design of technical systems. In: International Conference on Engineering Design – ICED 2009, Stanford, August 24-27 (2009) 19. Albers, A., Oerding, J., Alink, T.: Abstract objectives can become more tangible with the contact and channel model (C&CM). In: Models and Methods for Variation Management in Global Product Development: Proc. 20th CIRP Design Conference, pp. 203–213 (2011)
A Structured Approach for Function Based Decomposition
123
20. Campean, I.F., Henshall, E., Brunson, D., Day, A., McLellan, R., Hartley, J.: A structured approach for function analysis of complex automotive systems. SAE Int. J. Mater. Manuf. 4(1), 1255–1267 (2011) 21. Henshall, E., Campean, I.F., Brunson, D.: Robust and Reliable Teamwork within Engineering Projects, SAE Technical Paper 2011-01-1273 (2011), doi:10.4271/2011-01-1273 22. Campean, F., Henshall, E.: A function failure approach to fault tree analysis for automotive systems. Society of Automotive Engineers Technical Paper: 2008-01-0846 (2008) 23. Rausand, M., Hoyland, A.: System Reliability Theory: Models, Statistical Methods, and Applications, 2nd edn. Wiley Series in Probability and Statistics (2003)