Free University of Bolzano-Bozen ... Software (OSS) in a Public Administration located in Europe. In the specific, we introduced the office automation software ..... this phase marketing has the strongest importance than in other phases.
A study on the introduction of Open Source Software in the Public Administration B. Rossi, B. Russo, M. Scotto, A. Sillitti, G. Succi Free University of Bolzano-Bozen {bruno.rossi, barbara.russo, marco.scotto, alberto.sillitti, giancarlo.succi}@unibz.it
This paper reports about a study on the introduction of Open Source Software (OSS) in a Public Administration located in Europe. In the specific,
we
introduced
the
office
automation
software
OpenOffice.org. The Public Administration examined introduced OSS as a means to save on the license costs and to have a larger space for customisation purposes. The adoption of the new software can have an impact on the employees’ productivity that need to be evaluated during the migration process. In this article, we compare the usage of OpenOffice.org and Microsoft Office. Data about the usual office activities performed by the users participating to the experimentation have been collected by means of an automated non-invasive data collection tool. The result of this study reports a similar usage pattern of both suites in terms of workload, but a different approach in using
functionalities provided by each
software. A further analysis on the life cycles of documents elaborated with the office suites seem to validate the similarities among the software solutions examined. Keywords: Open Source Software, Office automation, migration. 1. Introduction The introduction of Open Source Software (OSS) in substitution or in parallel with Closed Source Software (CSS) is an argument that acquired recently great relevance. The proposed savings in terms of license costs and the broader opportunities for software customisation are arguments that interest particularly private and public companies. There are not many studies and market
researches on the convenience of the migration. The ones available, privilege one of the two solutions, depending mainly on the factor of cost considered. One of the most famous, the study of Yankee Group titled North American Linux TCO Survey, reports that there is not a clear and universal TCO (Total Cost of Ownership) measure that can be considered in order to perform a full migration from Windows to Linux [16]. Apart from the convenience of a migration, a complete transition process is not trivial to perform, especially in working environments where the interdependencies and the vertical integration is a key issue [12]. To help during this decisional problem, some preconditions to the migration to OSS were delineated by the IDA organization ( Interchange of Data between Administrations) in guidelines for migration to OSS publicly released [5]: –
before starting have a clear understanding of the reasons to migrate;
–
ensure that there is active support for the change from IT staff and users;
–
make sure that there is a champion for change – the higher up in the organisation the better;
–
build up expertise and relationships with the OSS movement;
–
start with non critical systems;
–
ensure that each step in the migration is manageable.
These considerations may be simple, but it's not rare the case in which they are overlooked or ignored. As for the reasons of migration reported in the same guidelines, the most important reasons for a migration are the need for open standards for e-Government, the level of security that OSS provides, the elimination of forced change and the cost of OSS. Actually, one survey submitted in 2005 to the visitors of the Computer Economics website [14] yielded by far as the best reason to switch to OSS the less dependence from vendors as motivation. This is not surprising, as many supporters of OSS also stress the importance to avoid the realisation of phenomena of lock-ins, situations in which a company commits itself to a single supplier or single data
format [8,12]. Very often the experience in the deployment of OSS in other organisations is seen as a way to evaluate a possible migration. In this sense, numerous and growing examples of case studies of successful migrations are available. We would like here to simply cite the ones of the city of Calgary in Canada [10] or the region of Extremadura in Spain [4]. We should also mention some of the cases of unsuccessful deployment, like the city of Nuremberg [15] or delays and over expenditures like the case of the city of Munich [6], both cases in Germany, as they can be even more important to analyse possible causes that could impact negatively on the migration process. After this small overview of the problem, we can delve into the main topic of the paper, the presentation of the results of an experimentation in the office automation field migration to OSS. Being aware of the difficulties and counter indications of the so-called Big-Bang migration, one that consists in a complete and instantaneous migration from the old system to the new one [5], the approach has been more gradual, presenting a situation in which both systems could be used in parallel, granting a constant monitoring of the system that could be used in case of a successive phased transition. In particular, the case study discussed concerns a European Public Administration, where a successful parallel introduction of the OpenOffice.org software on the desktop side has been monitored
for
two
months. The
contribution to the field of this study is not only the evaluation of the introduction of the new software, but also an evaluation of the similarities and differences in usage patterns of OpenOffice.org and Microsoft Office that were found during the experimentation period. This can shed some light on the effect of a transition on the routine of the office work also in other Public Administrations.
2. Study overview The study has been based on the data collected from a Public Administration in Europe during a migration to the OpenOffice.org1 suite. This office automation suite offers similar functionalities as the ones offered by Microsoft Office. It is composed of a word-processor, a spreadsheet software, a presentation software and a drawing tool.
The Public Administration (PA)
examined has been adopting OSS for some time, and the analysis we report refers to a situation, where the proprietary and open solution coexisted in the working environment. To monitor the time spent on different solutions, data have been collected with the aid of two different applications: -
PROM (PRO Metrics), a non-invasive monitoring tool, to evaluate the
usage of OpenOffice.org and Microsoft Office during all the transition process[13]. Metrics of interest were the number of documents handled and time spent per single document. The software has been running during all weeks of the experimentation, permitting to acquire objective data on the experimentation. With a non-invasive impact, the software gives the opportunity to register for every document the time spent, the name of the document and the functions used. This last feature is at the moment still limited, but can give useful insights of the different patterns of usage between the two solutions. -
FLEA (FiLe Extension Analyzer) has been used to perform a scan of the
data standards available on the users’ drives and analyse the eventual presence of macros. The software permits to collect information on the type of extension, date of creation, date of last access, size of the file, and for particular extensions also information about the macros contained. The scan was performed at the beginning of the experimentation. The tools used during the experimentation were useful to assess its constant evolution and in particular to gather quantitative and objective data about the migration process. A key characteristic of the software for data collection has 1 For precision, the version of OpenOffice.org installed has been version 1.1.4, the installations of Microsoft Office were different, mostly Office 2000 and XP.
been the non-invasiveness, the software had not to interfere in any way with the usual working activities. 3. Study experimental protocol In order to study the introduction of OpenOffice.org in the Public Administration target of our study, we followed an experimental protocol we deployed in other cases of migration to OSS [REF]. Obviously, due to the heterogeneity of the Public Administrations considered, not in all cases the same protocol could be strictly applied. In particular, the experimental protocol used in the study has been the following: 1. Selection of the participants to the experiment. Employees selected to take part to the experimentation were chosen by the single Public Administration. In this sense, we had almost no possibility to influence the final decision. 2. Submission of various questionnaires on the attitude towards OSS. Different questionnaires were submitted to selected users at the beginning of the experimentation, in order to evaluate their knowledge about OSS. 3. Motivational seminar on the reasons of the experimentation. A meeting with all users to explain the reasons of the experimentation and give some background on the OSS movement. In this specific case, the motivational seminar has been an activity assigned to the organisation of the single Public Administration. 4. Identification of the OpenOffice.org experimental group and control group. In similar cases we handled the experimentation as a pre-test-post-test control group design [2]. As reported, in the specific case, the selection of the sample was performed inside the single Public Administration and furthermore a control group could not be selected. 5. Analysis of the existing data standards available at the beginning of the experimentation. This step has been performed in order to evaluate the presence of a large number of documents in proprietary formats that could augment the complexity of the migration effect, either due to the network
effects that such a large amount of data files in one standard produce[12] or due to the increased effort required for a conversion to a new format, if feasible. 6. Installation of OpenOffice.org and translation in the OpenOffice.org format of the most used documents and on a per request basis. In the specific case, the conversion of the documents has been performed internally by the single Public Administration. In the study reported, the OpenOffice.org suite has been already available on some workstations, the installation in this phase has been extended to the remaining client machines. 7. Installation of the monitoring and data collection system to define the situation before the transition. The PROM system has been installed on the client machines of experimenters, while the FLEA system has been used as a one-shot instrument and required one single installation. 8. Training, performed on a single day, focusing on the different approach required in order to acquire confidence with the new software; users were instructed on how to perform the office automation tasks that were considered as more important for their specific duty. 9. Start of the OpenOffice.org data collection. Both software, Microsoft Office and OpenOffice.org have been monitored for several weeks in order to receive a constant evaluation of the adoption process. 10. Support given to users through an on-line forum and a hot-line. The support has been given mainly in accordance with the Public Administration employees' support policy. 11. Periodic verification meetings with users of OpenOffice.org to identify possible problems. This kind of ongoing verification and support could not be given in all cases, as it is better suited for smaller groups of experimenters. 12. Submission of the final questionnaires. The final questionnaire related the final perception of OSS made by users and the evaluation of the experimentation and applications deployed.
More details about the experimental design, details and results of the questionnaires submitted, and differences with another experimentation in the same context, can be found in [9]. The monitoring of users as we report in this paper has been performed during 2 months with both solutions installed in parallel. 100 users have been involved in the experimentation. In table 1, we summarise the different analysis performed and the goal of each analysis.
Analysis
Goal
1. Analysis of the available data
Commitment of organization to
standards
proprietary data standards
2. Analysis of documents
Evaluation of the level of
handled in terms of average time, adoption of both software over cardinality and typology of user
time
3. Functions used
Evaluation the differences in
4. Document Life Cycle
usage between the two software offered as alternative
Table 1 Summary of the analysis performed with the relative goal
The rest of the paper will analyse in detail the outcome of the experimentation. In the specific, we will first overview the data standards available, the usage of the different software according to several measures, and in the end the comparison of the functionalities and usage patterns that emerged. 4. Data standards analysis To perform an analysis of the situation for the data standards available, we used the FLEA software. In particular, our interest lied in discovering how much the organisation under scrutiny is committed towards proprietary data standards. For this reason, we were interested in the following: –
number of files available in proprietary data standards. In this sense, we focused on files for word-processors, spreadsheets, and presentations;
–
evolution over time of the files generated. For generation of files created we considered the creation date of the files. The focus in this case has been restricted only to proprietary data standards in the aforementioned categories;
–
evolution over time of the usage of files. For usage we considered the last modification date of the files. Also in this case the analysis has been restricted to proprietary files;
In particular, we are interested in this kind of information, as the large amount of information stored in one format can be one indicator of a situation of lock-in, due to the high switching costs necessary for data migration [12]. As a first step, we collected the number of files in the proprietary data standards that were useful for our analysis1 Word Processing Data standards TXT 542
SXW 10 RTF 34 PS 15 PDF 98
DOC 1841
Figure 1 Wordprocessors data standards analysed. Extensions considered have been DOC, RTF, TXT, PDF, PS, and SXW
In figure 1, we show the results of the wordprocessors' data standards collected. The majority of documents of this category is stored in the proprietary DOC format (72,48%). Interesting facts to note, the relative minimal impact of
1 to give more details, the formats we were most concerned with, were DOC, RTF, PPT, and XLS files, the formats of the Microsoft Office suite
PDF files (3,86%) and the still minimal impact of introduction of SXW files (0,39%)2. Spreadsheets data standards
Presentations data standards
SXC 3
SXI 5
PPT 14
XLS 121
Figure 2 Spreadsheet and presentations data standards analysed. Extensions considered have been SXC and XLS for spreadsheets and SXI, PPT for presentations
In figure 2, we report the results for spreadsheets and presentations, in this sense, the dominance of the proprietary XLS format (97,58%) is evident. In the context of applications for presentations, the difference is quite limited. Proprietary PPT format counts for 73,68% as opposed to the SXI format (26,32%). The importance of file for presentation in this specific case is very low. If we compare the number of files collected in the three categories, and we rank each one according to the number of documents available, we reach the following result: –
Wordprocessing (94,67%)
–
Spreadsheets (4,62%)
–
Presentations (0,71%)
2 the version of OpenOffice.org installed didn't support yet the Open Document Format (ODF) format, an open format for document exchange for office automation applications. In the results shown, the extensions reported are SXW (for wordprocessor files), SXC (for spreadsheet applications) and SXI (for presentation applications). For further information about the ODF format, http://www.odfalliance.org/
It is evident as the majority of activities of employees of our target Public Administration in office automation have to do with text processing. This information has been used to tailor the training activities to the real user needs. As a second step, we considered the evolution of the proprietary data standards generated. For generation, we considered the date of creation of the files, in order to evaluate if there has been an increase of file generation in specific data standards.
Creation of files 150 140 130 120 110 100 90 80 70 60 50 40 30 20 10 0
.doc .xls .ppt
20 20 20 20 20 20 20 20 20 20 20 20 20 20 20 20 20 20 20 20 20 20 20 20 20 20 20 20 20 20 20 20 20 20 20 20 20 20 20 20 20 20 20 20 20 20 20 20 20 20 20 20 20 20 20 20 20 20 00 00 00 00 00 00 00 00 00 00 00 00 01 01 01 01 01 01 01 01 01 01 01 01 02 02 02 02 02 02 02 02 02 02 02 02 03 03 03 03 03 03 03 03 03 03 03 03 04 04 04 04 04 04 04 04 04 04 Ja F M A M Ju Ju A S O N D Ja F M A M Ju Ju A S O N D Ja F M A M Ju Ju A S O N D Ja F M A M Ju Ju A S O N D Ja F M A M Ju Ju A S O
Figure 3 Creation of files during the years 2000-2004. Documents considered are DOC (in blue), XLS (in gray), and PPT (in black)
In figure 3, the creation of documents has been constant during the whole period, if we exclude two peaks of file generation at the beginning of year 2000 and at in April-May 2004. Without further data, we could not say in particular what happened during the last period, where each format considered increased significantly the generation rate. As a third step we report the modification of files for the proprietary data standards considered.
Modification of files 80 75 70 65 60 55 50 45 40 35 30 25 20 15 10 5 0
.doc .xls .ppt
20 20 20 20 20 20 20 20 20 20 20 20 20 20 20 20 20 20 20 20 20 20 20 20 20 20 20 20 20 20 20 20 20 20 20 20 20 20 20 20 20 20 20 20 20 20 20 20 20 20 20 20 20 20 20 20 20 20 00 00 00 00 00 00 00 00 00 00 00 00 01 01 01 01 01 01 01 01 01 01 01 01 02 02 02 02 02 02 02 02 02 02 02 02 03 03 03 03 03 03 03 03 03 03 03 03 04 04 04 04 04 04 04 04 04 04 Ja Fe M Ap M Ju Jul Au Se O No De Ja Fe M Ap M Ju Jul Au Se O No De Ja Fe M Ap M Ju Jul Au Se O No De Ja Fe M Ap M Ju Jul Au Se O No De Ja Fe M Ap M Ju Jul Au Se O
Figure 4 Modification of files during the years 2000-2004. Documents considered are DOC (in blue), XLS (in gray), and PPT (in black)
From figure 4, the evolution of file modification across time is shown, the evolution is quite constant during the years considered. In this section, we tried to acquire information about the last years of files generation and modification. This type of analysis is still preliminary, however, we think that the reason of interest for this kind of analysis is threefold: –
it can be performed easily and quickly on file servers that store employees' office automation documents
–
it can provide a sort of “historical view” of the activities performed also many years before;
–
can partially integrate or substitute an ongoing monitoring system;
as a drawback, we must cite that the modification and creation dates reported on the Microsoft Windows system are not always precise and can sometimes be misleading. An example of this behaviour has been reported for example in [3], where authors were interested in collecting various statistics about file usage of different file systems. 5. Study details To present the evolving situation during the first two months of the experimentation, we can see in figure 5 the comparison between Microsoft
Office and OpenOffice.org usage. As these numbers seem to report the daily averages are comparable across the period of experimentation.
Average documents per day 8,5 8 7,5 7 6,5 6 5,5 5
Avg doc per day OOO Avg doc per day MSO
4,5 4 3,5 3 2,5 2 1,5 1 0,5 0 1
2
3
4
5
6
7
8
9
10 11 12
13 14 15
16 17 18 19 20 21 22 23 24 25 26
27 28 29
30 31 32 33 34 35 36 37 38 39 40 41 42 43
44 45
46 47 48
49 50 51
Figure 5 Average number of OpenOffice.org documents per day (in gray) and MS Office documents per day (in black)
In Figure 6 the total daily number of documents per solution is reported.
Total documents per day 75 70 65 60 55 50 45
Total docs MSO Total docs Ooo
40 35 30 25 20 15 10 5 0 1
2
3
4
5
6
7
8
9
10 11 12 13 14 15 16 17 18 19 20 21 22 23 24 25 26 27 28 29 30 31 32 33 34 35 36 37 38 39 40 41 42 46 47 48
Figure 6 Total OpenOffice.org documents per day (in gray) and MS Office documents per day (in black)
From this table can be derived that, in the specific case, the adoption level is higher for the open solution. At the end of the period considered, the documents handled with OpenOffice.org have been 4.032 against 1.206 opened with Microsoft Office. This to justify that the migration examined is already in a mature state, in which the new technology introduced is taking over the old one. In Figure 7, users have been categorised in three different categories: users adopting only OpenOffice.org, only Microsoft Office or both for their daily office automation tasks. Users during the period 1 0,9 0,8 0,7 0,6
Both Only MSO
0,5
Only Ooo
0,4 0,3 0,2 0,1 0 1
2
3
4
5
6
7
8
9 10 11 12 13 14 15 16 17 18 19 20 21 22 23 24 25 26 27 28 29 30 31 32 33 34 35 36 37 38 39 40 41 42 43 44 45
Figure 7 Percentages of users during the period of experimentation, according to user type. Users adopting only OpenOffice.org (in gray), only MS Office (in black) or both software (in white) for the specified day
Two considerations can be derived from the figure. First, and as a confirmation to previous evaluations, OpenOffice.org users represent the majority of users. This result is fully in accordance with the advanced status of the migration reported so far. Second, and to further emphasize this result, the evaluation of the results shows that very few users adopt both software for office automation. Also in this case this reports that many users have already decided which software to use, an effect of the early phases of experimentation, where users were left free to choose an alternative without constrictions. We can go one step further and build on the basis of the considerations made by Everett Rogers [11] in the context of technology adoption in order to support marketing decisions. The author distinguished agents posed in front of an
innovation, depending on the stage in which they finally performed the adoption decision. The categorisation is among innovators, early adopters, early majority,
late
majority,
and
laggards.
Each
possesses
distinguishing
characteristics, that influence the stage of the adoption decision. By placing the experimentation in this context, we can see how the innovation, OpenOffice.org in our case, already captured the interest of innovators and early adopters and probably part of the early majority group. Late majority and laggards have still to make an adoption decision, but if we follow the theory, users remaining are the more skeptical and risk adverse. What we can conclude from this economical framework is the following: –
the time needed to involve them in the adoption process will be longer than in the case of other users;
–
the communication with other adopters will be a key factor to influence their final decision;
Overall, the purpose of this analysis is to give an overview of the situation that was found in the Public Administration focus of our study. 6. Functions used In this section we report the functionalities used on the different suites, divided per software. The first step in the analysis, has been to provide an overview of the most used functions by means of the software utilised. As a single function, we intend an action performed with the monitored software, like the opening or saving of one document. At the moment, and as we will further specify in the limitations, the version of the software deployed for the data collection process does not allow a more fine-grained analysis of all the functions utilised (e.g. the usage of shortcuts could not be detected). In table 2, we report the total numbers of functions adopted during the study. These were selected as being the most representative ones.
Microsoft Office
OpenOffice.org
Open
145
1038
Save As
205
1321
Print
170
1109
Spelling
178
578
Insert Table
2
43
Find and Replace
7
39
Table 2 Total functions used according to application type. On the left column the type of function and for each the number of occurrences per software used
In table 3, the same functions are reported, this time normalised with the number of documents handled per solution and ordered according to usage per single software.
Microsof t Office
OpenOff ice.org
Save As
0,21
Save As
0,31
Spelling
0,18
Print
0,26
Print
0,18
Open
0,24
Open
0,15
Spelling
0,13
Find and Replace
0,01
Insert Table
0,01
Insert Table
0,00
Find and Replace
0,01
Table 3 Total functions weighted per document handled. On the left column the type of function and for each the number of weighted occurrences. For each software, functions have been ordered in decreasing order of occurrence
The effects that we can get from this analysis are twofold. First, the higher number numbers of usage of functions for OpenOffice.org can be surprising, but we have to consider some peculiarities of the software that emerge from the table. As an example, OpenOffice.org users have the opportunity with the “Save As” function to store documents also in the formats offered by Microsoft Office and with the “Open” function, they can open files of the whole suite, not only the particular application they are using (e.g. a spreadshhet). These considerations are at the base of the different behaviours detected. Second consideration, the impact of activities like inserting tables and finding and replacing words seem very low in both solutions. We could not trace keyboard shortcuts, so the analysis in this sense is limited. Overall, we can conclude that in general the usage pattern of OpenOffice.org
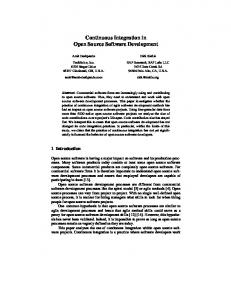
seems different, with more actions performed, like opening documents, saving and printing. Spelling instead had a higher impact in Microsoft Office than in OpenOffice.org. 7. Document life cycle To deepen the analysis of the differences between the two solutions, we derived a concept similar to the one of Product Life Cycle (PLC), in our case applied to documents. The concept of Product Life Cycle was first introduced by Theodore Levitt in 1965[1]. The purpose was to study the different phases of the life of a product, from the launch on the market to the final withdrawal. This in order to enhance the marketing strategies offered. The typical stages that were determined in a product life cycle are: Introduction, Growth, Maturity and Decline. There are many different variations of the Product Life Cycle model that differ mainly in the names used to describe the different stages and the purpose of the underlying analysis. A similar model has been used to study the diffusion of new technology [7]. In figure 8 a typical product life cycle is depicted, together with the different phases of maturity.
Figure 8 A typical product life cycle, with four phases of maturity (Introduction, Growth, Maturity, Decline)
–
The Introduction phase is where the product is introduced on the market, in this phase marketing has the strongest importance than in other phases.
–
The Growth phase is where the increase in sales supported by marketing becomes considerable.
–
In the Maturity phase the sales are stabilised and the speed of increase of sales is slowly reduced until it begins to become negative.
–
In the Decline phase, the product is no more attractive to possible customers, that may prefer a more technological concurrent product.
In the Product Life Cycle, the duration of each phase may be different between different products, as the adoption curve may have a different aspect. We decided to model the life of documents with a parallel with what seen for products for marketing purposes. We refer to this framework as Document Life Cycle (DLC). We used DLC as a measure of software usage discover
existing
analogies
between
both
software
target
to further of
the
experimentation. To perform this analysis, we collected information about all the documents handled by users during the period, in terms of number of times they were accessed. Subsequently, each document has been inserted into different stages of the life cycle. What we report in this section are some statistics about the length of the documents' life cycle. The statistics of the DLC of all the documents handled by users using both suites focus of our study are reported in table 4. The average length of the documents is very similar in a comparison between both solutions.
Application
Avg DLC length
Std. Dev.
Avg DLC length*
Max DLC length (days)
Microsof t Office
1,83
3,45
4,64
51
OpenOff ice.org
1,78
3,74
4,06
46
All documents
1,82
3,47
4,11
51
* excluding documents of shorter lif e cy cle
Table 4 Comparison of DLC of all documents, average marked with a * have been obtained by excluding documents with a life cycle of one day
As we should expect, the results of the DLC analysis are comparable, the difference between the two software solutions are minimal. Furthermore, from the analysis of the data distribution, we discovered that only 25% of all documents have a life cycle greater than one day. 8. Conclusions While the study is still limited, we are getting a clearer picture on the interactions of users with their desktop software. The study reported refers to a Public Administration where OSS has already been adopted in parallel with the closed solution for some time. In this sense we are in a more mature stage during the technology adoption, not the early phases of a complete migration. The next step would be the complete adoption of OSS for office automation, if the feasibility study performed show favourable. The results of our analysis show that proprietary and open solution can coexist on the working environment on the desktop side. Also the average number of documents per day seems comparable. Different analysis have been performed. First, the analysis of stored documents has shown how much the Public Administration is constrained in the migration process by the large amount of documents created in previous years. This is particularly significant for wordprocessing documents. Second, focusing on the functions used, some activities seem to be more adopted by users with the open solution than the closed one. During our study, some function we thought at first important were rarely used. A more fine-grained analysis will be possible with more accurate software for data collection, collecting more measures necessary to evaluate fully all the functions used.
Third, the analysis and evolution of the documents' life cycle, a concept borrowed from Economics, seem also to justify the strong similarities between the two solutions offered. 9. Limitations Overall, the different measures taken in consideration are suggesting the feasibility of the full migration for the Public Administration target of our study. However, some limitations have to be considered. First, the experimentation had the peculiarity of a migration process already ongoing. The results of the early stages of migration in another organization will present a different outcome. Second, the fully freedom in the selection of the sample and in the execution of the experimental protocol had to be sacrificed in some aspects. The most important of the one cited in the paper is the possibility to have a control group at disposal for the experimental design chosen. Third, and last limitation, some aspects of the data collection software in the context of functionalities constrained the subsequent analysis, limiting in fact the range of the conclusions. 10. Acknowledgements This work has been partially supported by COSPA (Consortium for Open Source Software in the Public Administration), EU IST FP6 project nr. 20022164. We would like to acknowledge in particular all the Public Administrations that took part to the project. Acknowledgments also go to all the users involved, participants to the experimentation, technical personnel, and supervisors: without their constant effort and their availability this study would not have been possible. 11. References [1] Bass, F., M. (1969). A New Product Growth Model for Consumer Durables, Management Science, 15, pp215-227 [2] Campbell, D.T., & Stanley, T.D. (1990). Experimental and Quasi-Experimental Design. Houghton Mifflin Company
[3] Douceur J. and Bolosky W. (1999). A Large-Scale Study of File-System Contents, Proceedings of the 1999 ACM Sigmetrics Conference, pp. 59–70, June 1999 [4] Marson, I. (2005). Linux Brings Hope to Spain's Poorest Region. Retrieved from http://insight.zdnet.co.uk/software/linuxunix/0,39020472,39197928,00.htm [5] IDA (Interchange of Data between Administrations) (2003). The IDA Open Source Migration Guidelines. Retrieved from http://ec.europa.eu/idabc/servlets/Doc?id=1983 [6] Landeshauptstadt München (2003). Clientstudie der Landeshauptstadt München. Retrieved from http://www.muenchen.info/pia/clientstudie_kurz.pdf [7] Levitt T. (1965). Exploit the Product Life Cycle. Harvard Business Review, Vol 43, NovemberDicember 1965, pp 81-94 [8] Liebowitz S., Margolis S. (1999). Winners, losers & Microsoft, Competition and Antitrust in High Technology, Oakland, Calif. : The Independent Inst. [9] Rossi, B., Scotto, M., Sillitti, A., Succi, G. (2005). An empirical study on the migration to OpenOffice.org in a Public Administration, in Special Issue on Web-based, Community Driven Open Source Systems of the International Journal of Information Technology and Web Engineering (IJITWE) [10] Rickwood, L. (2004) Real World Linux 2004 Conference and Expo Reports. Retrieved from http://www.realworldlinuxbiz.com/artman/publish/printer_rwl04rp.shtml [11] Rogers, E. (1995). Diffusion of Innovations. N.Y.: The Free Press [12] Shapiro C. e Varian H.R. (1999) “Information Rules: A Strategic Guide to the Network Economy”, Harvard Business School Press [13] Sillitti A., Janes A., Succi G., Vernazza T. (2003). Collecting, Integrating and Analyzing Software Metrics and Personal Software Process Data, in proceedings of EUROMICRO 2003, Belek-Antalya, Turkey, 1 – 6 September 2003. [14] Scavo,F. (2005) Key Advantage of Open Source is Not Cost Savings. Retrieved from Computer Economics, http://www.computereconomics.com/article.cfm?id=1043 [15] Stadt Nürnberg - Strategische Ausrichtung im Hinblick auf Systemunabhängigkeit und Open Source Software
[16] The Yankee Group (2005). North American Linux TCO Survey, retrieved from www.yankeegroup.com