Information and Software Technology 48 (2006) 745–755 www.elsevier.com/locate/infsof
A systematic review of statistical power in software engineering experiments Tore Dyba˚ a,b,*, Vigdis By Kampenes a, Dag I.K. Sjøberg a a
Simula Research Laboratory, P.O. Box 134, NO-1325 Lysaker, Norway b SINTEF ICT, NO-7465 Trondheim, Norway
Received 11 May 2005; revised 24 August 2005; accepted 31 August 2005 Available online 3 November 2005
Abstract Statistical power is an inherent part of empirical studies that employ significance testing and is essential for the planning of studies, for the interpretation of study results, and for the validity of study conclusions. This paper reports a quantitative assessment of the statistical power of empirical software engineering research based on the 103 papers on controlled experiments (of a total of 5,453 papers) published in nine major software engineering journals and three conference proceedings in the decade 1993–2002. The results show that the statistical power of software engineering experiments falls substantially below accepted norms as well as the levels found in the related discipline of information systems research. Given this study’s findings, additional attention must be directed to the adequacy of sample sizes and research designs to ensure acceptable levels of statistical power. Furthermore, the current reporting of significance tests should be enhanced by also reporting effect sizes and confidence intervals. q 2005 Elsevier B.V. All rights reserved. Keywords: Empirical software engineering; Controlled experiment; Systematic review; Statistical power; Effect size
1. Introduction An important use of statistical significance testing in empirical software engineering (ESE) research is to test hypotheses in controlled experiments. An important component of such testing is the notion of statistical power, which is defined as the probability that a statistical test will correctly reject the null hypothesis [12]. A test without sufficient statistical power will not be able to provide the researcher with enough information to draw conclusions regarding the acceptance or rejection of the null hypothesis. Knowledge of statistical power can influence both the planning, execution and results of empirical research. If the power of statistical tests is weak, the probability of finding significant effects is small, and the outcomes of the study will likely be insignificant. Furthermore, if the study fails to provide information about the statistical power of its tests, we cannot determine whether the insignificant results were due to insufficient power or if the phenomenon actually did not * Corresponding author. Tel.: C47 7359 2947; fax: C47 7359 2977. E-mail addresses:
[email protected] (T. Dyba˚),
[email protected] (V.B. Kampenes),
[email protected] (D.I.K. Sjøberg).
0950-5849/$ - see front matter q 2005 Elsevier B.V. All rights reserved. doi:10.1016/j.infsof.2005.08.009
exist. This will inevitably lead to misinterpretation of the outcomes of the study. Thus, failure to provide an adequate level of statistical power has implications for both the execution and outcome of research: “If resources are limited and preclude attaining a satisfactory level of statistical power, the research is probably not worth the time, effort, and cost of inferential statistics” ([1], p. 96). These considerations have prompted researchers in disciplines such as social and abnormal psychology [8,10,38], applied psychology [6,30], education [3], communication [7], behavioral accounting [2], marketing [37], management [5,16,25,30], international business [4], and information systems research [1,36] to determine the post hoc statistical power of their respective literature. Within software engineering (SE), Miller et al. [29] discussed the role of statistical power analysis in ESE research, suggesting that there is inadequate reporting and attention afforded to statistical power in the ESE literature, which leads to potentially flawed research designs and questionable validity of results: Any researcher not undertaking a power analysis of their experiment has no idea of the role that luck or fate is playing with their work and consequently neither does the Software Engineering community (p. 286).
T. Dyba˚ et al. / Information and Software Technology 48 (2006) 745–755
746
Although Miller et al. [29] made an important contribution in directing attention to the concept of statistical power in ESE research and how it can be incorporated within the experimental design process, they based their arguments on an informal review of the literature. There is, therefore, a need to conduct more formal investigations, similar to that of other disciplines, of the state-of-the-practice in ESE research with respect to statistical power. The purpose of this paper is thus (1) to perform a systematic review and quantitative assessment of the statistical power of ESE research in a sample of published controlled experiments, (2) to discuss the implications of these findings, and (3) to discuss techniques that ESE researchers can use to increase the statistical power of their studies in order to improve the quality and validity of ESE research. In Section 2, we present a brief background on statistical power and its determinants. In Section 3, we provide an overview of the research method employed to review and determine the statistical power in controlled software engineering experiments. Section 4 reports the results of the review, while Section 5 provides a discussion of the results, their implications, and some recommendations that should improve the quality and validity of future ESE research. Section 6 provides some concluding comments.
2. Background: statistical power 2.1. Power and errors in statistical inference According to Neyman and Pearson’s [31,32] method of statistical inference , testing hypotheses requires that we specify an acceptable level of statistical error, that is, the risk we are willing to take regarding the correctness of our decisions. Regardless of which decision rule we select, there are generally two ways of being correct and two ways of making an error in the choice between the null (H0) and the alternate (HA) hypotheses (see Table 1). A Type I error is the error made when H0 (the tested hypothesis) is wrongly rejected. In other words, a Type I error is committed whenever the sample results fall into the rejection region, even though H0 is true. Conventionally, the probability of committing a Type I error is represented by the level of statistical significance, denoted by the lowercase Greek letter alpha (a). Conversely, the probability of being correct, given that H0 is true is equal to 1Ka. The probability of making an error of Type II, also known as beta (b), is the probability of failing to reject the null hypothesis Table 1 Ways of being correct or making an error when choosing between two competing hypotheses Unknown true state of nature Statistical conclusion
H0: No difference
HA: difference
Accept H0
1Ka: Correct
b: Type II error
Reject H0
a: Type I error
1Kb: Correct (power)
when it is actually false. Thus, when a sample result does not fall into the rejection region, even though some HA is true, we are led to make a Type II error. Consequently, the probability of correctly rejecting the null hypothesis, i.e. the probability of making a correct decision given that HA is true, is 1Kb; the power of the statistical test. It is literally the probability of finding out that H0 is wrong, given the decision rule and the true HA. As can be seen from Table 1, statistical power is particularly important when there is a true difference in the population. In this situation, when the phenomenon actually exists, the statistical test must be powerful enough to detect it. If the test reveals a non-significant result in this case, the conclusion of ‘no effect’ would be misleading and we would thus be committing a Type II error. Traditionally, a is set to .05 to guard against Type I error, while b is set to .20 to guard against Type II error. Accepting these conventions also means that we are guarded four times more against Type I errors than we are against Type II errors. However, the distribution of risk between Type I and Type II errors need to be appropriate to the situation at hand. An illustrative case is made by Mazen et al. [25] regarding the illfated Challenger space shuttle, in which NASA officials faced a choice between two types of assumptions, each with a distinctive cost: The first [assumption] was that the shuttle was unsafe to fly because the performance of the O-ring used in the rocketbooster was different from that used on previous missions. The second was that the shuttle was safe to fly because there would be no difference between the performance of the O-rings in this and previous missions. If the mission had been aborted and the O-ring had indeed been functional, Type I error would have been committed. Obviously the cost of the Type II error, launching with a defective O-ring, was much greater than the cost that would have been incurred with Type I error (ibid, p. 370).
2.2. Determinants of statistical power The fundamental approach to statistical power analysis was established by Cohen [12], who described the relationships among the four variables involved in statistical inference: significance criterion (a), sample size (N), population effect size (ES), and statistical power (1Kb). For any statistical model, these relationships are such that each is a function of the other three. Thus, we can determine the power for any statistical test, given a, N, and ES (Table 2). The appropriate sections of Cohen [12] or Kraemer and Thiemann [21] should be consulted for details on how to perform statistical power analysis. Specifically, Chapter 12 in Cohen’s book provides the computational procedures that are used to determine the power and sample size values of the commonly used power tables and power charts. As mentioned, the significant criterion (a) is the probability of incorrectly rejecting the null hypothesis. Power increases
T. Dyba˚ et al. / Information and Software Technology 48 (2006) 745–755 Table 2 Determinants of statistical power Significance criterion (a)
The chosen risk of committing a Type I error (e.g. aZ0.05) The total number of subjects included in the analysis of data The magnitude of the effect under the alternate hypothesis (e.g. dZ0.5)
Sample size (N) Effect size (ES)
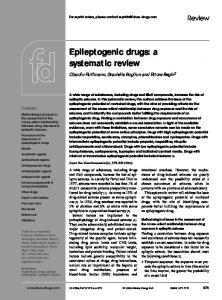
Accept H0
Reject H0
1- β
β
α
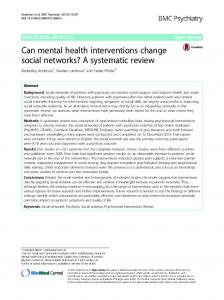
Fig. 1. Statistical power and the probability of Type I and Type II error in testing a directional hypothesis.
with larger a. A small a will, thus, result in relatively small power. The directionality of the significance criterion also affects the power of a statistical test. A non-directional twotailed test will have lower power than a directional one-tailed test at the same a, provided that the sample result is in the predicted direction. Note that a directional test has no power to detect effects in the direction opposite to the one predicted (see Fig. 1). The second determinant of power is sample size (N). At any given a level, increased sample size reduces the standard deviations of the sampling distributions for H0 and HA. This reduction results in less overlap of the distributions, increased precision, and thus increased power (see Fig. 1). The final determinant of power is the effect size (ES), which refers to the true size of the difference between H0 and HA (the
747
null hypothesis is that the effect size is 0), i.e. the degree to which the phenomenon is present in the population. The larger the effect size, the greater the probability that the effect will be detected and the null hypothesis rejected. The nature of the effect size will vary from one statistical procedure to the next (e.g. a standardized mean difference or a correlation coefficient), but its function in power analysis is the same in all procedures. Thus, each statistical test has its own scale-free and continuous effect size index, ranging upward from zero (see Table 3). So, whereas p values reveal whether a finding is statistically significant, effect size indices are measures of practical significance or meaningfulness. Interpreting effect sizes is thus critical, because it is possible for a finding to be statistically significant but not meaningful, and vice versa [13,23]. Effect size is probably the most difficult aspect of power analysis to specify or estimate. It can sometimes be determined by a critical assessment of prior empirical research in the area. However, due to a lack of empirical studies and cumulative findings in software engineering, the best option for a reasonable estimation of effect size is expert judgment [29]. Cohen [12] has facilitated such estimation of effect size. Based on a review of prior behavioral research, he developed operational definitions of three levels of effect sizes (small, medium, and large) with different quantitative levels for the different types of statistical test. In information systems (IS) research and in the behavioral sciences, the operationalized definitions of the effect size for each of these categories have become a research standard for the most commonly used statistical tests [1,36]. Cohen established these conventions in 1977 [11], and they have been fixed ever since. His intent was that “medium [effect size] represents an effect likely to be visible to the naked eye of a careful observer. small [effect size] to be noticeably smaller than medium but not so small as to be trivial, and. large [effect size] to be the same distance above medium as small was below it” ([13],p.156). Table 3 gives the definition of the ES indices and the corresponding ES values for the most common statistical tests. These ES values enable the comparison of power levels across studies in this survey, as
Table 3 Effect-size indexes and their values for small, medium, and large effects for the most common statistical tests ([13], p. 157) Statistical test
Effect-size index
Effect size Small
Medium
Large
1. The t-test for the difference between two independent means 2. The t-test for the significance of a productmoment correlation coefficient, r 3. The test for the difference between two independent rs 4. The normal curve test for the difference between two independent proportions 5. The chi-square test for goodness of fit (oneway) or association in two-way contingency tables 6. One-way analysis of variance 7. Multiple and multiple partial correlation
dZ ðmA KmB Þ=s
.20
.50
.80
r
.10
.30
.50
qZzAKzB
.10
.30
.50
hZfAKfB
.20
.50
.80
sffiffiffiffiffiffiffiffiffiffiffiffiffiffiffiffiffiffiffiffiffiffiffiffiffiffiffiffiffiffiffiffiffiffiffiffi k P wZ ðP1i KP0i Þ2 =P0i
.10
.30
.50
.10 .02
.25 .15
.40 .35
iZ1
fZsm/s f 2 Z R2 =ð1KR2 Þ
748
T. Dyba˚ et al. / Information and Software Technology 48 (2006) 745–755
well as across surveys conducted in other disciplines. As an example, the ES index for the t-test of the difference between independent means, d, is the difference expressed in units of the within-population standard deviation. For this test, the small, medium, and large ESs are, respectively, dZ.20, .50, and .80. Thus, an operationally defined medium difference between means is half a standard deviation.
3. Research method We assessed all the 103 papers on controlled experiments (of a total of 5,453 papers), identified by Sjøberg et al. [40], published in nine major software engineering journals and three conference proceedings during the decade 1993–2002 (Table 4). These journals and conference proceedings were chosen because they were considered to be representative of ESE research. Furthermore, since controlled experiments are empirical studies that employ inferential statistics, they were considered a relevant sample in this study. Since the term ‘experiment’ is used inconsistently in the software engineering community (often being used synonymously with empirical study), we use the term ‘controlled experiment’. A study was defined as a controlled experiment if individuals or teams (the experimental units) conducted one or more software engineering tasks for the sake of comparing different populations, processes, methods, techniques, languages, or tools (the treatments). We did not distinguish between randomized experiments and quasi-experiments in this study, because both designs are relevant to ESE experimentation. We excluded several types of study that share certain characteristics with experiments. While these might be highly relevant for the field, they are not controlled experiments as defined above. Thus, we excluded correlation studies, studies that are based solely on calculations on existing data, and Table 4 Distribution of ESE studies employing controlled experiments: Jan. 1993–Dec. 2002 Journal/conference proceeding Journal of Systems and Software (JSS) Empirical Software Engineering (EMSE) IEEE Transactions on Software Engineering (TSE) International Conference on Software Engineering (ICSE) IEEE International Symposium on Software Metrics (METRICS) Information and Software Technology (IST) IEEE Software IEEE International Symposium on Empirical Software Engineering (ISESE) Software Maintenance and Evolution (SME) ACM Transactions on Software Engineering (TOSEM) Software: Practice and Experience (SP&E) IEEE Computer Total
Number
Percent
24 22 17
23.3 21.4 16.5
12
11.7
10
9.7
8 4 3
7.8 3.9 2.9
2 1
1.9 1.0
– – 103
– – 100
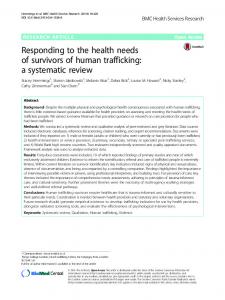
simulated team evaluations that use data for individuals. Studies that used projects or companies as treatment groups, in which data was collected at several levels (treatment defined, but no experimental unit defined) were also excluded because we consider these to be multiple case studies [43]. In order to identify and extract controlled experiments, one researcher systematically read the titles and abstracts of the 5,453 scientific articles. Excluded from the search were editorials, prefaces, article summaries, interviews, news, reviews, correspondence, discussions, comments, reader’s letters and summaries of tutorials, workshops, panels and poster sessions. If it was unclear from the title or abstract whether a controlled experiment was described, the complete article was read by two researchers. These criteria were met by 103 articles, which reported 113 experiments (Table 4). All of them involved a number of significance tests. However, not all of these were equally relevant to the hypotheses of the studies. In fact, it was not always clear from the reporting of the studies which hypotheses were actually tested or which significance tests corresponded to which hypotheses. The first two authors read all the 103 articles in detail and made separate extractions of the power data. Based on these two data sets, all three authors reviewed all tests in all experiments to reach a consensus on which experiments and tests to include. For 14 experiments, no statistical analysis was performed and for seven experiments, we did not manage to track which tests answered which hypothesis or research question. Five experiments were reported in more than one article. In these cases, we included the one most recently published. This assessment resulted in 78 articles (Fig. 2). Of these articles, we identified 459 statistical tests corresponding to the main hypotheses or research questions of 92 experiments. Similar to the methodology used by Baroudi and Orlikowski for MIS research [1] for MIS research, both parametric and nonparametric tests of the major hypotheses were included in this study. Table 5 shows the distribution of the 459 statistical tests in the final sample for which statistical power could be determined post hoc. The main parametric tests were Analysis of Variance (ANOVA) and t-tests. The main nonparametric
All articles 1993 - 2002 n = 5453
Not controlled experiments n = 5350
Controlled experiments n = 103
Excluded* n = 25
Analyzed n = 78
Fig. 2. Results of the literature review. *25 articles were excluded due to duplicate reporting, no statistical analysis or unspecified statistical tests
T. Dyba˚ et al. / Information and Software Technology 48 (2006) 745–755 Table 5 Distribution of statistical tests employed in 92 controlled SE experiments Statistical test
Number
Percent
ANOVA t-test Wilcoxon Mann–Whitney Fisher’s exact test Chi-square Kruskall–Wallis Other tests Total
179 117 41 39 15 14 8 46 459
39.0 25.5 8.9 8.5 3.3 3.1 1.7 10.0 100
tests were Wilcoxon, Mann–Whitney, Fisher’s exact test, Chisquare, and Kruskall–Wallis. Other tests include Tukey’s pairwise comparison (18), nonparametric rank-sum test (6), Poisson (3), regression (3), Mood’s median test (2), proportion (2), and Spearman rank correlation (2). The power of the nonparametric tests was determined by using analogous parametric tests where appropriate [9,10,18,21]. For example, the t-test for means approximates to the Mann–Whitney U test and the Wilcoxon rank test, the parametric F test to the Kruskal–Wallis H test, and Pearson’s r to the Spearman Rank Correlation. Chi-square approximations were not needed since Cohen provided separate tables to determine its power. Following the post hoc method, the power of each test was determined by using the stated sample size, setting the a level to the conventional level of .05, and choosing the nondirectional critical region for all power computations. Furthermore, power was calculated in relation to Cohen’s definitions of small, medium, and large effect sizes [12]. This is similar to that of past surveys of statistical power in other disciplines, such as IS research (e.g. [1,36]). All power calculations were made using SamplePower 2.0 from SPSS.1 4. Results The 78 articles selected for this study with available data for calculating power yielded 459 statistical tests of the major hypotheses being investigated in the 92 reported controlled experiments. Table 6 shows the distribution of sample size for the experiments by type of statistical test. On average, the statistical tests covered 55 observations. However, the high standard deviation for several of the tests reveals a large amount of variation in sample sizes. For example, among the ANOVA subsample the average sample size was 79, yet 165 of the 179 tests examined had an average sample size of 50, while the remaining 14 tests had an average of 450. Similarly, for the Chi-square subsample the average sample size was 126. However, two of the tests had a sample size of 531 observations, while the average sample size of the remaining 12 tests was 58 observations. Also, in the group of other tests, with an average sample size of 39 observations, the three regression tests had a sample size of 242 observations, while 1
See www.spss.com/samplepower/
749
the average sample size for the remaining 43 tests was 25 observations. Several of the experiments surveyed in this study used within-subject designs so that each subject contributed several observations to the sample size of a statistical test. The most extreme cases were as follows: one study that used 800 observations from 100 subjects for an ANOVA test; another study that used 564 observations from 94 subjects for an ANOVA test; and yet another study that used 531 observations from 266 subjects in a Chi-square test. The latter study was also the one with the highest number of subjects in our sample. So, while the average sample size of all 459 statistical tests in this study was 55 observations, with a standard deviation of 87, the median sample size was as low as 34 observations. Correspondingly, the average number of subjects in the surveyed experiments was 48, with a standard deviation of 51 and a median of 30. As a comparison, the average sample size of all tests in Rademacher’s power study in IS research was 179 subjects (with a standard deviation of 196) [36]. Table 7 presents the power distribution of the 459 statistical tests in the 92 experiments using Cohen’s conventional values for small, medium, and large effect sizes (see Table 3). Small effect size: The average statistical power of the tests when we assumed small effect sizes was as low as .11. This means that if the phenomena being investigated exhibit a small effect size, then, on average, the SE studies examined have only a one in ten chance of detecting them. Table 7 shows that only one test is above the .80 conventional power level and that 97% have a less than 50% chance of detecting significant findings. Medium effect size: When we assume medium effect sizes, the average statistical power of the tests increases to .36. Although this is an improvement over the .11 power level achieved by tests of small effect sizes, the studies only have, on average, just about a one-third chance of detecting phenomena exhibiting a medium effect size. Table 7 indicates that only 6% of the tests examined achieve the conventional .80 power level or better, and that 78% of the tests have a less than 50% chance of detecting significant results. Large effect size: Assuming large effect sizes, the average statistical power of the tests increases further, to .63. This means that, on average, the studies still have slightly less than a Table 6 Distribution of sample sizes (observations) occurring in 92 controlled SE experiments Statistical test
Mean
Std.
Min
Median
Max
ANOVA t-Test Wilcoxon Mann–Whitney Fisher’s exact test Chi-square Kruskall–Wallis Other Total
79 34 40 34 40 119 26 38 55
118 29 23 13 27 180 19 57 87
6 5 10 6 16 10 15 10 5
65 30 34 32 20 30 15 16 34
800 136 78 66 74 531 69 242 800
T. Dyba˚ et al. / Information and Software Technology 48 (2006) 745–755
750
Table 7 Frequency and cumulative percentage distribution of power in 92 controlled SE experiments Power level .91–.99 .81–.90 .71–.80 .61–.70 .51–.60 .41–.50 .31–.40 .21–.30 .11–.20 .00–.10 Total Average power
Small effect size
Medium effect size
Large effect size
Freq.
Cum. %
Freq.
Cum. %
Freq.
Cum. %
–
– 100 100 100 99 97 97 97 94 68 –
18 11 14 13 44 50 76 107 94 32 459 0.36
100 96 94 91 88 78 67 51 27 7 –
69 75 49 70 58 21 43 43 31 – 459 0.63
100 85 69 58 43 30 25 16 7 – –
1 – 2 9 2 – 13 120 312 459 0.11
two-thirds chance of detecting their phenomena. As can be seen from Table 7, 31% of the tests attain or exceed the .80 power level, and 70% obtain a greater than 50% chance of correctly rejecting their null hypotheses. Thus, even when we assume that the effect being studied is so large as to make statistical testing unnecessary, as much as 69% of the tests fall below the .80 level. Table 8 presents the power of the studies by type of statistical test employed. None of the tests reaches the conventional .80 power level on average; not even when we assume large effect sizes. ANOVA and t-tests account for almost two-thirds of all statistical analyses in controlled SE experiments, yet their mean power level for detecting large effect sizes is only .67 and .61, respectively, while the corresponding power levels assuming medium effect sizes are as low as .40 and .33. In summary, this quantitative assessment revealed that controlled SE experiments, on average, only have a two-thirds chance of detecting phenomena with large effect sizes. The Table 8 Power analysis by type of statistical test in 92 controlled SE experiments Statistical test
ANOVA t-Test Wilcoxon Mann– Whitney Fisher’s exact test Chi-square Kruskall– Wallis Other
Small effect size
Medium effect size
Large effect size
Means
Std. Dev.
Means
Std. Dev.
Means
Std. Dev.
.12 .10 .12 .09
.11 .03 .05 .02
.40 .33 .46 .29
.24 .17 .24 .10
.67 .61 .74 .59
.28 .23 .24 .19
.06
.05
.25
.22
.49
.34
.18 .09
.20 .02
.43 .31
.33 .15
.64 .59
.28 .28
.10
.11
.26
.25
.44
.24
corresponding chance of detecting phenomena with medium effect sizes is around one in three, while there is only a one in 10 chance of detecting small effect sizes. Finally, a qualitative assessment of the treatment of power within the sampled studies revealed an interesting pattern. Of the 78 papers in our sample, 12 discussed the statistical power associated with the testing of null hypotheses. Of these studies, nine elaborated on the specific procedures for determining the statistical power of tests. Three of the nine performed a priori power analysis, while six performed the analysis a posteriori. Only one of the papers that performed an a priori power analysis used it to guide the choice of sample size. In this case, the authors explicitly stated that they were only interested in large effect sizes and that they regarded a power level of .5 as sufficient. Still, they included so few subjects in the experiment that the average power to detect a large effect size of their statistical tests was as low as .28. Of the six papers that performed a posteriori power analysis, two gave recommendations for the necessary sample sizes in future replication studies. Thus, overall, 84.6% of the sampled experimental studies did not reference the statistical power of their significance tests. 5. Discussion In this section, we discuss the implications of the findings in this study for the interpretation of experimental SE research. We suggest several ways to increase statistical power, and we provide recommendations for future research. First, however, we compare the main findings in the current study with the related discipline of IS research. 5.1. Comparison with IS research We compared the results of the current study with two corresponding reviews of the statistical power levels in IS research [1,36]. In the former study, 63 statistically-based studies were identified from the issues of Communications of the ACM, Decision Sciences, Management Science, and MIS Quarterly over the five-year period from January 1980 to July 1985. The final sample included 149 statistical tests from 57 studies. In the latter study, 65 statistically-based studies that employed 167 statistical tests were selected from MIS Quarterly over the seven-year period from January 1990 to September 1997. In comparison, the current study included 92 controlled experiments that comprised 459 statistical tests published in nine major software engineering journals and three conference proceedings during the decade 1993–2002 (see Tables 4 and 5). Statistical power in the two IS research studies and the current SE research study for small, medium, and large effect sizes are compared in Table 9. The results of the two IS studies indicate that the power levels for all effect sizes have improved substantially in the decade between the two studies. Furthermore, the results show that IS research now meets the desired power level of .80 specified by Cohen [12] for medium effect sizes, which is assumed as the target level by most IS researchers [36].
T. Dyba˚ et al. / Information and Software Technology 48 (2006) 745–755 Table 9 Comparison of current survey with statistical power values in prior IS research Related IS study [1] [36] Current study
No. of articles 57 65 78
Means for different effect-size assumptions Small
Medium
Large
.19 .34 .11
.60 .81 .36
.83 .96 .63
751
sizes that are twice as large as those found in SE research for these tests. In fact, the situation is a little worse than that, since observations are used as the sample size in the current study, while the IS studies refer to subjects. Moreover, the power levels of the current study to detect medium effect sizes are only about half of the corresponding power levels of IS research. 5.2. Implications for interpreting experimental SE research
The results of the current study show that the power of experimental SE research falls markedly below the levels attained by IS research. One reason for this difference might be that the IS field has benefited from the early power review of Baroudi and Orlikowski [1], and thus explicit attention has been paid to statistical power, which has paid off with contemporary research displaying improved power levels, as demonstrated by Rademacher [36]. What is particularly worrying for SE research is that the power level displayed by the current study not only falls markedly below the level of 1999 study by Rademacher, but that it also falls markedly below the level of the 1989 study by Baroudi and Orlikowski. While medium effect sizes are considered the target level in IS research [36], and the average power to detect these effect sizes are .81 in IS research, Table 7 indicates that only 6% of the tests examined in the current research achieve this level, and that as much as 78% of the tests in the current research have a less than 50% chance of detecting significant results for medium effects. Unless it can be demonstrated that medium (and large) effect sizes are irrelevant to SE research, this should be a cause for concern for SE researchers and practitioners. Consequently, we should explore in more depth what constitutes meaningful effect sizes within SE research, in order to establish specific SE conventions. A comparison of power data for the two most popular types of statistical test in experimental SE research, with the corresponding tests in IS research, is provided in Table 10. As can be seen from Table 5, these tests (ANOVA and t-test) constitute about two-thirds of the statistical tests in our sample. The results show that, on average, IS research employ sample
Table 10 Comparison of the two most popular types of tests in the current survey with corresponding power data for IS research Statistical test ANOVA (medium effect size) Sample sizea Power (mean value) Power (std. deviation) t-test (medium effect size) Sample sizea Power (mean value) Power (std. deviation)
[1]
[36]
Current study
64 .56 .30
136 .82 .19
79 .40 .24
45 .53 .27
70 .74 .18
34 .33 .17
a Note that sample size in the two IS studies refers to subjects, while in the current study it refers to observations.
An important finding of this study is that explicit consideration of power issues, e.g. in terms of discussion, use, and reporting of statistical power analysis, in experimental SE research is very limited. As mentioned above, 15.4% of the papers discussed statistical power in relation to their testing of the null hypothesis, but in only one paper did the authors perform an a priori power analysis. In addition, and perhaps as a consequence, the post hoc power analyses showed that, overall, the studies examined had low statistical power. Even for large effect sizes, as much as 69% of the tests fell below the .80 level. This implies that considerations of statistical power are underemphasized in experimental SE research. Two major issues that are particularly important for experimental SE research arise from this underemphasis of statistical power: (1) the interpretation of results from individual studies and (2) the interpretation of results from the combination or replication of empirical studies [22,24, 27,29,35]. As mentioned above, a test without sufficient statistical power will not provide the researcher with enough information to draw conclusions regarding the acceptance or rejection of the null hypothesis. If no effects are detected in this situation, researchers should not conclude that the phenomenon does not exist. Rather, they should report that no significant findings were demonstrated in their study, and that this may be due to the low statistical power associated with their tests. Another issue regarding the interpretation of results from individual studies with low power is the use of multiple tests. In this case, which included 91.3% of the experiments, the probability of obtaining at least one statistically significant effect might be large, even if the probability that any specific effect is statistically significant is small (see [28]). As an example, recall from Table 7 that the probability that a medium effect size is statistically significant is only .36. At the same time, the 84 experiments in this study with more than one test had an average of 5.4 tests per experiment. Thus, with this number of tests, we would expect about two statistically significant results for medium effect sizes in each of the experiments in this study. So, although power is sufficient for attaining statistical significance somewhere, it is not sufficient for any specific test. Again, this inadequate power for testing specific effects makes it difficult to interpret properly the results of any single study. It would be helpful, therefore, if researchers reporting results from statistical hypothesis testing were to distinguish between the tests of primary and secondary hypotheses.
752
T. Dyba˚ et al. / Information and Software Technology 48 (2006) 745–755
Low statistical power has also a substantial impact on the ability to replicate experimental studies based on null hypothesis testing. Ottenbacher nicely demonstrates an apparent paradox that results from the replication of such low powered studies [34], showing that: .the more often we are well guided by theory and prior observation, but conduct a low power study, the more we decrease the probability of replication! Thus a literature with low statistical power is not only committing a passive error, but can actually contribute to diverting attention and resources in unproductive directions (ibid, p.273). Consequently, the tendency to underpower SE studies makes replication and meta-analysis troublesome, and will tend to produce an inconsistent body of literature, thus hindering the advancement of knowledge. The results of our review also raise another important issue: the interpretation of studies with very high levels of power. Some of the studies in this review employed large sample sizes, ranging from 400 to 800 observations. This poses a problem for interpretation, because virtually any study can be made to show significant results if the sample size is large enough, regardless of how small the true effect size may be [18]. Hence, it is of particular importance that researchers who report statistically significant results from studies with very large sample sizes, or with very large power levels, also report the corresponding effect sizes. This will put the reader in a better position to interpret the results and judge whether the statistically significant findings have practical importance. 5.3. Ways to increase statistical power Increase the size of the sample: The most obvious way to increase the statistical power of a study is to increase the size of the sample. However, there is invariably some cost in terms of time, effort, and money per subject that must be considered. With this in mind, most researchers try to use the smallest number of subjects necessary to have a reasonable chance of obtaining significant results with a meaningful effect size [9]. However, while using only a few subjects may result in meaningful effects not being detected, trivial effects may show up as significant results when the sample size is very large. Consequently, if the researcher wants significance to reflect a sizable effect and also wants to avoid being led into a blind alley by a significant result, attention should be paid to both aspects of sample size. As a general rule, the sample size should be large enough to give confidence that meaningful effects will be detected. At the same time, the reporting of effect sizes will ensure that trivial associations will be detected even though they might be statistically significant. Relax the significance criterion: Power can also be increased by relaxing the significance criterion. This approach is not common, however, because of widespread concern about keeping Type I errors to a fixed, low level of, e.g. .01 or .05. Still, as the example of the Challenger space shuttle showed, the significance criterion and the power level should be
determined by the relative seriousness of Type I and Type II errors. Thus, researchers should be aware of the costs of both types of errors when setting the alpha and power levels, and must make sure that they explain the consequences of the raised probability of Type I errors if they relax the significance criterion. When possible, researchers should analyze the relative consequences of Type I and Type II errors for the specific treatment situation under investigation. Choose powerful statistical tests: In general, parametric tests are more powerful than their analogous nonparametric tests [21]. Thus, the power of a study can most often be increased by choosing an appropriate parametric test. It is important to note, however, that these tests make a number of assumptions about the properties (parameters) of the populations, such as the mean and standard deviation, from which samples are drawn. On the other hand, given the empirical evidence for the robustness and enhanced power provided by parametric tests, “researchers are encouraged to use the parametric test most appropriate for their study and resort to non-parametric procedures only in the rare case of extreme assumption violations” ([1], p. 98). The power of a test can also be increased by retaining as much information as possible about the dependent variable. In general, tests comparing data categorized into groups are less powerful than tests using data measured along a continuum. As Baroudi and Orlikowski recommend [1], “statistics that permit continuous data to be analyzed in continuous form, such as regression, should be used over those that require data to be divided in groups, such as the analysis of variance” (p. 99). Furthermore, as we have already noted, the direction of the significance criterion also affects the power of a statistical test. A directional, one-tailed test will yield higher power than a non-directional two-tailed test at the same alpha level, provided that the sample results are in the predicted direction. Note, however, that a directional test has no power to detect effects in the direction opposite to that predicted. Thus, the primary guide for the researcher deciding whether a hypothesis should be tested with a directional or non-directional test must be the comparative term of the original research question. Reduce measurement error and subject heterogeneity: The larger the variance on the scores within the treatment and control groups, the smaller the effect size and the power will be. One source of such variance is measurement error, i.e. variability in scores that is unrelated to the characteristic being measured. Another source is the heterogeneity of subjects on the measure [23]. Thus, anything that makes the population standard deviation small will increase power, other things being equal. In general, subject heterogeneity can be reduced by selecting or developing measures that do not discriminate strongly among subjects. If the measure, nevertheless, does respond substantially to subject differences, these could be reduced statistically during data analysis. To reduce such variance, and thus increase statistical power, the researcher can utilize a repeated measures or paired subjects design, or a factorial design that employs blocking, stratification, or matching criteria [39]. Researchers can also reduce subject
T. Dyba˚ et al. / Information and Software Technology 48 (2006) 745–755
heterogeneity by employing a research design that covaries a pretest measure with the dependent variable [14]. Measurement error can be reduced by exercising careful control over experimental subjects and conditions. In addition, the researcher can use some form of aggregation, or averaging, of multiple measures that contain errors individually, to reduce the influence of error on the composite scores [33,41]. So, whenever applicable, the researcher should use reliable, multiitem measures to increase power [15]. Balance groups: The statistical power of a study is based less on the total number of subjects involved than on the number in each group or cell within the design. In addition, because the power of a test with unequal group sizes is estimated using the harmonic mean [12], the ‘effective’ group size is skewed toward the size of the group with the fewest subjects. Thus, with a fixed number of subjects, maximal statistical power is attained when they are divided equally into treatment and control groups [23]. Researchers should, therefore, try to obtain equal, or in the case of factorial designs, proportional, group sizes rather than getting a large sample size that results in there being unequal or disproportional groups [1]. Investigate only relevant variables: One of the best strategies for increasing statistical power is to use theory and prior research to identify those variables that are most likely to have an effect [23]. Careful selection of which independent variables to include and which variables to exclude is, thus, crucial to raising the power of a study and the legitimacy of its potential findings. Kraemer and Thiemann suggested that only factors that are absolutely necessary to the research question, or that have a documented and strong relationship to the response, should be included in a study [21]. Accordingly, they recommended “Choose a few predictor variables and choose them carefully.” (p. 65), or as McClelland put it [26]: “Doubling one’s thinking is likely to be much more productive than doubling one’s sample size.” (p. 964). In summary, when criterion significance and power levels are set, and a threshold for the minimum effect size to be detected has been decided, the two primary factors for consideration in a power analysis are the operative effect size and the sample size. Since much of what determines effect size has to do with the selection of measures, statistical analysis, treatment implementation, and other issues that are intrinsic parts of the research design, effect size enhancements are, generally, more cost-effective to engineer than are sample size increases [23]. However, determining how best to enhance the effect size requires some analysis and diagnosis of these factors for the particular research situation at hand. A tactic that is almost always effective, though, is procedural and statistical variance control. Procedural variance control means tight standardization of treatment and control conditions, sampling, and measurement, while statistical variance control uses such techniques as covariates or blocking factors to separate variance judged irrelevant to the assessment of treatment effects from the error term for significance testing (see above). As shown by Lipsey [23],
753
such techniques can sometimes increase the operative effect size two or threefold or even more. Thus, when designing SE experiments, the goal should be to obtain the largest possible effect size with the smallest investment in the number of subjects studied. This presupposes that the researcher understands the factors that influence statistical power and skilfully applies that knowledge in the planning and implementation of each study undertaken. For a more in-depth treatment of these issues, see Lipsey’s excellent work on design sensitivity to the statistical power of experimental research [23]. 5.4. Limitations The main limitations of this study are publication selection bias and inaccuracy in data extraction. As the basis for our investigation was the recent survey of controlled SE experiments performed by [40], the current study has the same publication selection basis as the main study. However, we consider the 12 surveyed journals and conferences to be leaders in software engineering in general and empirical software engineering in particular. Besides, Sjøberg et al.’s selection of journals is a superset of those selected by others (e.g. [17,44]). Nevertheless, if the main study also had included the grey literature (theses, technical reports, working papers, etc.) on controlled SE experiments, the current study could, in principle, provide more data and possibly allow more general conclusions to be drawn [19]. Regarding the selection of articles, the main study utilized a multistage process involving several researchers who documented the reasons for inclusion/ exclusion as suggested in [19] (see [40]). As described in Section 3, the first two authors read all 103 articles included in the main study in detail and made separate extractions of the power data. Based on these two data sets, all three authors reviewed all tests in all experiments to reach a consensus on which experiments and tests to include. However, because it was not always clear from the reporting of the studies which hypotheses were actually tested, which significance tests corresponded to which hypotheses, or how many observations were included for each test, the extraction process may have resulted in some inaccuracy in the data. 5.5. Recommendations for future research Based on the problems that we have identified that are associated with statistical power in experimental SE research, we offer some recommendations to SE researchers who perform null hypothesis testing. First, before embarking on studies involving statistical inference, we recommend that SE researchers plan for acceptable power on the basis of attention to the effect size, either by assessing previous empirical research in the area and using the effect sizes found in these studies as a guide, or by looking at their own studies and pilot studies for guidance. However, due to the limited number of empirical studies in SE this approach may be difficult to apply [29]. Alternatively, researchers can use a judgmental approach to decide what effect size they are interested
T. Dyba˚ et al. / Information and Software Technology 48 (2006) 745–755
754
in detecting. However, until there is a better basis for establishing conventions specific to SE, we recommend the same general target level of medium effect sizes as used in IS research, determined according to Cohen’s definitions [12]. Second, we recommend that SE researchers analyze the implications of the relative seriousness of Type I and Type II errors for the specific treatment situation under investigation. Unless there are specific circumstances, we do not recommend that researchers relax the commonly accepted norm of setting alpha to .05. Similarly, we recommend that SE researchers plan for a power level of at least .80 and perform power analyses accordingly. Thus, rather than relaxing alpha, we generally recommend increasing power to better balance the probabilities of committing Type I and Type II errors. Third, in agreement with Kitchenham et al. [20] and Wilkinson [42], we recommend that significance tests of experimental studies be accompanied by effect size measures and confidence intervals to better inform readers. In addition, studies should report the data for calculating such items as sample sizes, alpha level, means, standard deviations, statistical tests, the tails of the tests, and the value of the statistics. Finally, we recommend that journal editors and reviewers pay closer attention to the issue of statistical power. This way, readers will be in a better position to make informed decisions about the validity of the results and meta-analysts will be in a better position to perform secondary analyses. 6. Conclusion The purpose of this research was to perform a quantitative assessment of the statistical power of current experimental SE research. Since this is the first study of its kind in SE research, it was not possible to compare the statistical power data of the current study with prior experimental SE research. Therefore, we found it useful to draw on the related discipline of IS research, because this provided convenient baseline data for measuring and validating the results of the statistical power analysis of this research. The results showed that there is inadequate attention to power issues in SE research in general, and that the level of
statistical power falls substantially below accepted norms as well as below the levels found in the related discipline of IS research. For example, only 6% of the studies in this analysis had power of .80 or more to detect a medium effect size, which figure is assumed as the target level by most IS researchers. In conclusion, attention must be directed to the adequacy of sample sizes and research designs in experimental SE research to ensure acceptable levels of power (i.e. 1KbR.80), assuming that Type I errors are to be controlled at aZ.05. At a minimum, the current reporting of significance tests should be enhanced by reporting the effect sizes and confidence intervals to permit secondary analysis and to allow the reader a richer understanding of, and an increased trust in, a study’s results and implications. Acknowledgements We are grateful to Jo E. Hannay, Ove Hansen, Amela Karahasanovic´, Nils-Kristian Liborg and Anette C. Rekdal for providing help in identifying the 103 papers on controlled experiments used in our review. Thanks to Chris Wright for proofreading the paper. Appendix A. A numeric guide to sample size for the t-test We assume that a researcher plans to test a non-directional hypothesis that two means do not differ by conducting a controlled experiment with one experimental and one control group. Such a study can be analyzed suitably with an unpaired t-test with two-tailed rejection regions. The effect size index (d) under these circumstances can be calculated by dZ
ME KMC s
where ME is the mean score of the experimental group; MC is the mean score of the control group; and s is the standard deviation based on either group or both. A small effect size would be dZ.2, a medium effect size would be dZ.5, while a large effect size would be dZ.8.
Table A1 A numeric guide to sample size for small, medium, and large effects sizes for different values of a and power for a two-tailed t-test Power
aZ.01
aZ.05
aZ.10
dZ.2
dZ.5
dZ.8
dZ.2
dZ.5
dZ.8
dZ.2
dZ.5
dZ.8
.95 .90 .85 .80 .75 .70 .65 .60 .55 .50
893 746 655 586 530 483 441 402 367 334
145 121 107 96 87 79 72 66 61 55
58 49 43 39 35 32 30 27 25 23
651 527 450 394 348 310 276 246 219 194
105 86 73 64 57 51 45 41 36 32
42 34 30 26 23 21 19 17 15 14
542 429 361 310 270 236 207 181 158 136
88 70 59 51 44 39 34 30 26 23
35 28 24 21 18 16 14 12 11 10
T. Dyba˚ et al. / Information and Software Technology 48 (2006) 745–755
The sample size2 (N) required for each group as a function of effect size, alpha, and power is shown in Table A13. As an example, if the researcher wants to be able to detect a medium difference (dZ.5) between the two independent means at aZ .05, a sample size of NZ64 is required in each group. Similarly, at the same alpha level, if the researcher has 60 subjects available for the experiment, a power level of .85 will be attained for detecting a large effect size. Alternatively, by relaxing the alpha level to .10, 30 subjects in each group would yield a power of .60 to detect a medium effect size.
References [1] J. Baroudi, W. Orlikowski, The problem of statistical power in MIS research, MIS Quarterly 13 (1) (1989) 87–106. [2] S.C. Borokowski, M.J. Welsh, Q. Zhang, An analysis of statistical power in behavioral accounting research, Behavioral Research in Accounting 13 (2001) 63–84. [3] J.K. Brewer, On the power of statistical tests in the American educational research journal, American Educational Research Journal 9 (1972) 391–401. [4] J.K.U. Brock, The ‘Power’ of International Business Research, Journal of International Business Studies 34 (1) (2003) 90–99. [5] L.H. Cashen, S.W. Geiger, Statistical power and the testing of null hypotheses: a review of contemporary management research and recommendations for future studies, Organizational Research Methods 7 (2) (2004) 151–167. [6] L.J. Chase, R.B. Chase, A statistical power analysis of applied psychology research, Journal of Applied Psychology 6 (2) (1976) 234–237. [7] L.J. Chase, R.K. Tucker, A power-analytic examination of contemporary communica-tion research, Speech Monographs 42 (1) (1975) 29–41. [8] D. Clark-Carter, The account taken of statistical power in research published in the british journal of psychology, British Journal of Psychology 88 (1) (1997) 71–83. [9] B.H. Cohen, Explaining Psychological Statistics, second ed., Wiley, New york, 2001. [10] J. Cohen, The statistical power of abnormal-social psychological research: a review, Journal of Abnormal and Social Psychology 65 (3) (1962) 145–153. [11] J. Cohen, Statistical Power Analysis for the Behavioral Sciences, Academic Press, New York, 1977, Revised Edition. [12] J. Cohen, Statistical Power Analysis for the Behavioral Sciences, second ed., Laurence Erlbaum, Hillsdale, New Jersey, 1988. [13] J. Cohen, A power prime, Psychological Bulletin 112 (1) (1992) 155–159. [14] T.D. Cook, D.T. Campbell, Quasi-Experimentation: Design & Analysis Issues for Field Settings, Houghton Mifflin Company, Boston, 1979. [15] T. Dyba˚, An instrument for measuring the key factors of success in software process improvement, Empirical Software Engineering 5 (4) (2000) 357–390. [16] T.D. Ferguson, D.J. Ketchen Jr., Organizational configurations and performance: The role of statistical power in extant research, Strategic Management Journal 20 (1999) 385–395. [17] R.L. Glass, I. Vessey, V. Ramesh, Research in software engineering: an analysis of the literature, Information and Software Technology 44 (8) (2002) 491–506. [18] W.L. Hays, Statistics, fifth ed., Harcourt Brace, New York, 1994. [19] B.A. Kitchenham, Procedures for performing systematic reviews, Keele University Technical Report TR/SE-0401 and NICTA Technical Report 0400011T.1, 2004.
2 In fact, the samples size in the table represents the harmonic mean of the sample sizes in the treatment and control groups. 3 Calculation of the sample sizes in Table A1 was made with SamplePower 2.0 from SPSS.
755
[20] B.A. Kitchenham, S.L. Pfleeger, L.M. Pickard, P.W. Jones, D.C. Hoaglin, K. El Emam, J. Rosenberg, Preliminary guidelines for empirical research in software engineering, IEEE Transactions on Software Engineering 28 (8) (2002) 721–734. [21] H.C. Kraemer, S. Thiemann, How Many Subjects? Statistical Power Analysis in Research, Sage, Beverly Hills, 1987. [22] R.M. Lindsay, A.S.C. Ehrenberg, The design of replicated studies, The American Statistician 47 (3) (1993) 217–228. [23] M.W. Lipsey, Design Sensitivity: Statistical Power for Experimental Research, Sage, Newbury Park, CA, 1990. [24] S.E. Maxwell, The persistence of underpowered studies in psychological research: causes, consequences, and remedies, Psychological Methods 9 (2) (2004) 147–163. [25] A.M. Mazen, L.A. Graf, C.E. Kellogg, M. Hemmasi, Statistical power in contemporary management research, Academy of Management Journal 30 (2) (1987) 369–380. [26] G.H. McClelland, Increasing statistical power without increasing sample size, American Psychologist 55 (8) (2000) 963–964. [27] J. Miller, Applying meta-analytic procedures to software engineering experiments, Journal of Systems and Software 54 (2000) 29–39. [28] J. Miller, Statistical significance testing—a panacea for software technology experiments? Journal of Systems and Software 73 (2004) 183–192. [29] J. Miller, J. Daly, M. Wood, M. Roper, A. Brooks, Statistical power and its subcomponents—missing and misunderstood concepts in empirical software engineering research, Information and Software Technology 39 (4) (1997) 285–295. [30] M.A. Mone, G.C. Mueller, W. Mauland, The perceptions and usage of statistical power in applied psychology and management research, Personnel Psychology 49 (1) (1996) 103–120. [31] J. Neyman, E.S. Pearson, On the use and interpretation of certain test criteria for purposes of statistical inference, Biometrika 20A (1928) 175– 240 263–294. [32] J. Neyman, E.S. Pearson, On the problem of the most efficient tests of statistical hypotheses, Transactions of the Royal Society of London Series A 231 (1933) 289–337. [33] J.C. Nunnally, I.A. Bernstein, Psychometric Theory, third ed., McGrawHill, New York, 1994. [34] K.J. Ottenbacher, The power of replications and the replications of power, The American Statistician 50 (3) (1996) 271–275. [35] L.M. Pickard, B.A. Kitchenham, P.W. Jones, Combining empirical results in software engineering, Information and Software Technology 40 (14) (1998) 811–821. [36] R.A. Rademacher, Statistical power in information systems research: application and impact on the discipline, Journal of Computer Information Systems 39 (4) (1999) 1–7. [37] A.G. Sawyer, A.D. Ball, Statistical power and effect size in marketing research, Journal of Marketing Research 18 (3) (1981) 275–290. [38] P. Sedlmeier, G. Gigerenzer, Do studies of statistical power have an effect on the power of studies?, Psychological Bulletin 105 (1989) 309–316. [39] W.R. Shadish, T.D. Cook, D.T. Campbell, Experimental and QuasiExperimental Designs for Generalized Causal Inference, Houghton Mifflin Company, Boston, 2002. [40] D.I.K. Sjøberg, J.E. Hannay, O. Hansen, V.B. Kampenes, A. Karahasanovic´, N.-K. Liborg, A.C. Rekdal, A survey of controlled experiments in software engineering, IEEE Transactions on Software Engineering 31(9) (2005) 733–753. [41] P. Spector, Summated rating scale construction: an introduction, Sage University Paper series on Quantitative Applications in the Social Sciences, 07–082, Sage, Newbury Park, California, 1992. [42] L. Wilkinson, The task force on statistical inference, Statistical methods in psychology journals: guidelines and explanations, American Psychologist 54 (8) (1999) 594–604. [43] R.K. Yin, Case Study Research: Design and Methods, Sage, Thousand Oaks, CA, 2003. [44] M.V. Zelkowitz, D. Wallace, Experimental validation in software engineering, Information and Software Technology 39 (11) (1997) 735– 743.